EP0489904B1 - Radiation therapy x-ray simulator - Google Patents
Radiation therapy x-ray simulator Download PDFInfo
- Publication number
- EP0489904B1 EP0489904B1 EP91913217A EP91913217A EP0489904B1 EP 0489904 B1 EP0489904 B1 EP 0489904B1 EP 91913217 A EP91913217 A EP 91913217A EP 91913217 A EP91913217 A EP 91913217A EP 0489904 B1 EP0489904 B1 EP 0489904B1
- Authority
- EP
- European Patent Office
- Prior art keywords
- detector
- simulator
- photodiode
- ray
- array
- Prior art date
- Legal status (The legal status is an assumption and is not a legal conclusion. Google has not performed a legal analysis and makes no representation as to the accuracy of the status listed.)
- Expired - Lifetime
Links
Images


Classifications
-
- H—ELECTRICITY
- H05—ELECTRIC TECHNIQUES NOT OTHERWISE PROVIDED FOR
- H05G—X-RAY TECHNIQUE
- H05G1/00—X-ray apparatus involving X-ray tubes; Circuits therefor
- H05G1/08—Electrical details
- H05G1/64—Circuit arrangements for X-ray apparatus incorporating image intensifiers
-
- A—HUMAN NECESSITIES
- A61—MEDICAL OR VETERINARY SCIENCE; HYGIENE
- A61B—DIAGNOSIS; SURGERY; IDENTIFICATION
- A61B6/00—Apparatus for radiation diagnosis, e.g. combined with radiation therapy equipment
- A61B6/02—Devices for diagnosis sequentially in different planes; Stereoscopic radiation diagnosis
- A61B6/03—Computerised tomographs
- A61B6/032—Transmission computed tomography [CT]
-
- A—HUMAN NECESSITIES
- A61—MEDICAL OR VETERINARY SCIENCE; HYGIENE
- A61B—DIAGNOSIS; SURGERY; IDENTIFICATION
- A61B6/00—Apparatus for radiation diagnosis, e.g. combined with radiation therapy equipment
- A61B6/58—Testing, adjusting or calibrating apparatus or devices for radiation diagnosis
- A61B6/582—Calibration
- A61B6/583—Calibration using calibration phantoms
-
- H—ELECTRICITY
- H04—ELECTRIC COMMUNICATION TECHNIQUE
- H04N—PICTORIAL COMMUNICATION, e.g. TELEVISION
- H04N5/00—Details of television systems
- H04N5/30—Transforming light or analogous information into electric information
- H04N5/32—Transforming X-rays
-
- A—HUMAN NECESSITIES
- A61—MEDICAL OR VETERINARY SCIENCE; HYGIENE
- A61B—DIAGNOSIS; SURGERY; IDENTIFICATION
- A61B6/00—Apparatus for radiation diagnosis, e.g. combined with radiation therapy equipment
- A61B6/54—Control of apparatus or devices for radiation diagnosis
- A61B6/548—Remote control of the apparatus or devices
-
- Y—GENERAL TAGGING OF NEW TECHNOLOGICAL DEVELOPMENTS; GENERAL TAGGING OF CROSS-SECTIONAL TECHNOLOGIES SPANNING OVER SEVERAL SECTIONS OF THE IPC; TECHNICAL SUBJECTS COVERED BY FORMER USPC CROSS-REFERENCE ART COLLECTIONS [XRACs] AND DIGESTS
- Y10—TECHNICAL SUBJECTS COVERED BY FORMER USPC
- Y10S—TECHNICAL SUBJECTS COVERED BY FORMER USPC CROSS-REFERENCE ART COLLECTIONS [XRACs] AND DIGESTS
- Y10S128/00—Surgery
- Y10S128/92—Computer assisted medical diagnostics
Definitions
- This invention pertains to a radiation therapy x-ray simulator.
- US-A-4 426 721 discloses an x-ray radiography apparatus including an image intensifier for detecting a fan beam of x-rays and for producing on an output display screen an intensified output visible light image which is optically focussed by means of lenses and sensed by scannable, linear arrays of solid state diode detectors.
- computed tomography In recent years, much interest has been evidenced in a field now widely known as computed tomography.
- an X-ray source and detector are physically coupled together on opposite sides of the portion of a sample which is to be examined.
- the sample can be a patient or phantom or other objects, for example.
- X-rays are made to transit through the sample to be examined, while the detector measures the X-rays which make it through the sample without being absorbed or deflected.
- the paired source and detector Periodically, the paired source and detector are rotated to differing angular orientations about the sample, and the data collection process repeated.
- a very high number of measurements of attenuation values may be obtained by procedures of this type.
- the relatively massive amounts of data thus accumulated are processed by a computer, which typically does a mathematical data reduction to obtain attenuation values for a very high number of transmission values (typically in the hundreds of thousands) within the section of the sample being scanned.
- This data may then be combined to enable reconstruction of a matrix (visual or otherwise) which constitutes an accurate depiction of the density function of the sample section examined.
- skilled medical diagnosticians may diagnose various body elements such as tumors, blood clots, cysts, hemorrhages and various abnormalities, which heretofore were detectable, if at all, only by much more cumbersome and, in many instances, more hazardous-to-the-patient techniques.
- the radiation source and the detector means are positioned on opposite sides of the portion of the patient to be examined and these elements are made to rotate through a revolution or portion thereof about the patient. During such rotation, the detectors measure the radiation absorption at the plurality of transmission paths defined during the rotational process.
- application-specific conversion schemes are usually employed. That is, when the signal-to-noise ratio of the input transducer exceeds that of the analog-to-digital converter, then input signal preprocessing is typically used to compress the input signal.
- X-ray CT scanners are now a common tool for the diagnostic radiologist. Typically these are expensive, i.e. greater than a million dollars. These systems typically have scan times of 1 to 2 seconds with 0.3 mm spatial resolution. Density resolution as low as 0.25%, with degraded spatial resolution, is achievable.
- the technology of generator/detector design and the improvements in the microcomputer area over the past 10 years have enabled image detection and processing to approach real time.
- Radiation therapists often attempt to use scans from diagnostic CT scanners in planning a radiation therapy treatment. Because high levels of radiation are used during radiation therapy treatment it is important that the therapists be able to precisely locate the site to be treated. However, the relative position of organs within the body during a diagnostic CT scan are not the same as when a patient is placed on a flat couch of the radiation therapy machine. This occurs because the diagnostic CT scanner couch is more crescent shaped. Therefore, radiation therapy simulators have come into use (see, for example, EP-A-0 247 449). These simulators have patient couches that are identical to couches of radiation therapy machines.
- the X-ray focal spot for fluoroscopic/radiographic imaging is positioned to allow the same target-to-patient isocenter as in the therapy machine. Beam shaping devices and other accessories can be added which attempt to exactly duplicate the therapy setup.
- simulators yield a projected planar image of the patient anatomy that is much more geometrically compatible with the position of the radiation therapy system.
- cross-sectional CT images could be obtained at the same time, then the therapist would be further aided in planning the treatment.
- a radiation therapy simulator is a diagnostic imaging X-ray machine shaped to simulate the geometry of radiation therapy (or radiotherapy) treatment units.
- a simulator includes an X-ray imaging source, a gantry to support and position the X-ray imaging source, a couch to support the patient, and an image forming system.
- the dimensions of the gantry are such that it positions the x-ray imaging source relative to the couch in a geometry mathematically similar to the geometry of the radiotherapy machine. Images formed on the imaging system can then be interpreted in terms of the geometry of the radiotherapy machine. Images can be taken from different angles to aid in the planning of how to form the radiotherapy beam to maximize dose to the target and minimize damage to healthy organs.
- the X-ray imaging source and image forming system are limited to a configuration which is less than optimal for the quality of the image. Both the source and the image-detector-part of the image forming system are far from the patient. The image at the detector has been recorded on film.
- An image intensifier has been used to increase the brightness of the image which can be used to produce a television image.
- a computer has been used to process and enhance the television image.
- a detector with a minimum signal to noise ratio (S/N) of at least 200,000:1 is necessary. This is assuming a typical surface dose of 2 rads/scan and no compensating bolus around the patient. It is also necessary that the IIT, lens optics and photo detector yield an X-ray to electron quantum efficiency of greater than unity.
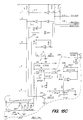
- FIG. 1 consisting of Fig. 1A and Fig. 1B, shows a block diagram of a detector system.
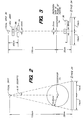
- FIG. 2 shows a diagram of the reconstruction diameter for a head scan.
- FIG. 3 shows a side view diagram of simulator geometry for a heat CT.
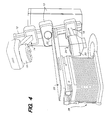
- FIG. 4 shows a simplified perspective view of a radiation treatment simulator in conjunction with which the present invention can be used.
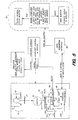
- FIG. 5 is a block diagram which illustrates the elements (indicated by a "*") which embody the present invention which can be added to a radiation treatment simulator system to obtain a CT simulator system in accordance with the present invention.
- FIG. 6 shows a side view diagram of simulator geometry for a body CT.
- FIG. 7 shows a diagram of the reconstruction diameter for a body scan.
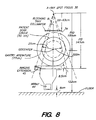
- FIG. 8 shows the addition of an imaging extension detector array to the IIT which can be used to increase the scan circle diameter in accordance with the present invention.
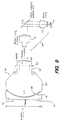
- FIG. 9 provides a cross sectional view of a typical image intensifier tube, and the associated optics.
- FIG. 10 is a simplified schematic of the photodiode linear array, preamplifier, and ADC.
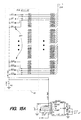
- FIG. 11 consisting of Figs. 11A, 11B and 11C, provides a detailed schematic of the circuitry used to implement one embodiment of the pre-amp, integrator, reset and clamp circuit.
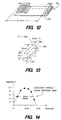
- FIG. 12 illustrates the relative positioning of the photodiodes of the imaging extension detector array.
- FIG. 13 illustrates a detector from the imaging extension detector array.
- FIG. 14 illustrates the sensitivity profile along the detector face of a detector from imaging extension detector array.
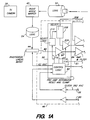
- FIG. 15, consisting of Figs. 15A, 15B and 15C, is a detailed schematic of the sampling preamplifier circuitry used with the imaging extension detector array.
- FIG. 16 consisting of Figs. 16A and 16B, illustrates the relative timing involved in the data acquisition from the photodiode linear array and the imaging extension detector array.
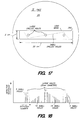
- FIG. 17 shows a top view of the mirror alignment apparatus.
- FIG. 18 shows a plot of detector response using the mirror alignment apparatus of FIG. 17.
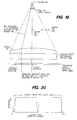
- FIG. 19 shows the moving pin arrangement used in the center finding procedure.
- FIG. 20 shows a plot of detector response in the center finding procedure.
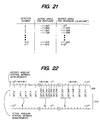
- FIG. 21 illustrates a table in which is tabulated the angle of the occluded ray, and the detector which responded to the occluded ray.
- FIG. 22 illustrates the manner in which the information tabulated in FIG. 21 is used in connection with actual measurement data.
- FIG. 23 shows the apparatus and response for determining the point spread function.
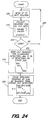
- FIG. 24 illustrates the gathering and preparation of the point spread function data.
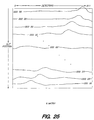
- FIG. 25 illustrates what the data might look like after the real peaks have been zeroed out.
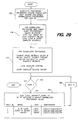
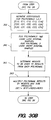
- FIG. 26 shows the overall sequence of data collection and correction.
- FIG. 27 illustrates a table tabulating photodiode number and coefficient values.
- FIG. 28 shows a diagram of polynomial fitting of dose versus measured detector response.
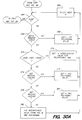
- FIG. 29 illustrates a procedure for determining the coefficients for three 4th-order polynomials which correct for non-linearities in the photodiode response.
- FIG. 30A illustrates the correction of the detector readings using the three polynomials illustrated in FIG. 29.
- FIG. 30B illustrates the correction of the detector readings in which the results of each polynomial are weighted, and the sum of the weighted polynomial then used as the corrected detector reading.
- FIG. 30C illustrates the weighing function used in FIG. 30B, for one example of count ranges.
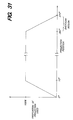
- FIG. 31 illustrates the weight assigned to the data from each projection for overlay projection corrections.
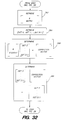
- FIG. 32 illustrates the manner in which the ⁇ matrix, illustrated in FIGS. 24 and 25, is used to implement the deconvolution which corrects for the PSF.
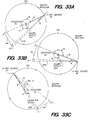
- FIGS. 33A, 33B, and 33C illustrate how different positions of X-ray source 30 cause different detectors in photodiode linear array to be affected by a ray occluded by the calibration needle.
- an object of interest is scanned to provide a series of projections at different selected angles about a rotational axis of the object.
- the projections are formed by passing a full or partial fan of radiation through the object of interest at each of these selected angles.
- the object-attenuated fan of radiation is applied to an image intensifier tube which converts radiation photons to visible light photons.
- the visible light photons are then detected using a photodiode linear array. Signals from the photodiode linear array are conditioned and then converted into digital form.
- the digital information is then processed under computer control to correct the data for background noise, non-linearities in the image intensifier tube and photodiode array, point spread in the imaging chain; and for other effects. Thereafter, the corrected data from each of the projections is used to reconstruct an image of the cross section of the object of interest for that scan. Multiple scans can be taken to provide a three-dimensional view of the object of interest. These scans can then be displayed on a monitor with variations in the image being displayed representing different absorption coefficients or absorption densities. The reconstructed image can also be stored in digital form for later viewing.
- a full or a partial fan-beam of x-ray radiation depends upon the diameter of the object being scanned and the dimensions of the detector electronics available. For example, where a 12" (30cm) image intensifier tube is used, and a scan of the head of a patient is desired, a full fan-beam is used. As such, the centers of the fan-beam, the head of the patient, and the image intensifier tube, are aligned along a common axis.
- an imaging extension is provided by which the maximum patient scan circle diameter is increased, for example, from 40 to 50cm when a 30cm (12") image intensifier tube is used. It allows for an increase in patient to gantry clearance from 60cm to 77cm, and also allows for a full 48cm wide patient couch to be used.
- the maximum size object which can be scanned is limited by the image intensifier tube diameter and its distance from the x-ray source.
- the 12-inch (30cm) image intensifier tube active area varies from unit-to-unit, but typically has been 28cm ⁇ 1cm across the face at 135cm from the x-ray source.
- head-scan centered at 100cm, as seen in FIG. 2, this geometry limits the maximum size object to 21cm diameter. This covers approximately 95% of the U.S. male population according to Diffrient's Humanscale publication. (See N. Diffrient et al., Humanscale 11213 Manual, 1979, The MIT Press.)
- Most diagnostic CT scanners have a 25cm maximum head scan circle which allows for approximately 100% population coverage and less critical patient positioning.
- Both head and body scans can be increased in size by using an asymmetric (or partial) x-ray fan-beam.
- the simulator head scan circle can be increased to 25cm by using an asymmetric verses full-fan approach. In this mode the image intensifier tube is shifted a few cm off center and a 360 degree scan is performed. Thus, a larger area is covered compared to the full-fan mode. Some loss in contrast and spatial resolution results because the entire object is not viewed in each projection.
- the projection data is then reconstructed using a variation of the Pavkovich fan-beam reconstruction method, described in copending patent application entitled “Partial Fan-beam Tomographic Apparatus and Data Reconstruction Method", filed even date herewith, and assigned to the assignee of the subject application.
- the image intensifier tube is shifted to the maximum extent.
- the largest body scan with the above arrangement is less than 40cm diameter as depicted in FIG. 7. This covers approximately 95% of the U.S. males across the chest, but less than 50% across the shoulders.
- the majority of the diagnostic scanners have a 50cm maximum body scan which covers 97% of the same population.
- the present invention is for use in conjunction with a radiation treatment simulator and planning system.
- Simulator simulate the geometry and movement of megavoltage radiation therapy equipment.
- the following are the basic items into which the simulator system can be divided: floor mounted drive unit with rotating arm, X-ray head and crosswire assembly, detector including image intensifier, treatment couch, relay frame, and control units.
- detector including image intensifier, treatment couch, relay frame, and control units.
- Many of the basic simulator system elements suitable for use with the present invention can be found in the Ximatron CR Radiotherapy Simulator System, manufactured by Varian, the assignee of the subject application.
- the drive unit 10 comprises a welded steel fabrication which is bolted on a plinth, which is preferably cast in the floor, prior to the completion of the final floor finish.
- the drive structure houses the variable speed electric drive unit and a high precision slewing ring bearing on which is fitted the rotating arm 12.
- On the arm 12 are mounted the carriages 14 and 16 for the X-ray head assembly 18 and the image intensifier tube assembly 20, respectively.
- Attached to the front of the arm is a circular disk 22, the circumference of which carries a scale mark in degrees from 0.0 to 360.0 degrees.
- a screen wall (not shown) is supplied which carries the zero data mark for the scale together with a small sub-scale for ease of reading if the zero data is visually obstructed.
- the screen wall is built into a partition wall which seals off the drive unit and control gear from the room, thus presenting a clean finish.
- the X-ray head assembly 18 Protruding through the top of the arm 12 is the X-ray head assembly 18 which is carried on a rigidly constructed steel fabrication.
- the X-ray system on the simulator has a generator having an output of 125 kVp and 300 mA (radiographic mode) or 125 kVp and 30 mA (fluoroscopic mode), in conjunction with a double focus (0.6 mm and 1 mm) X-ray tube, with a permanent 2 mm element and filter.
- the X-ray tube is mounted in a yoke on the end of the steel fabrication.
- a lead-bladed collimator which can be manually set to give field sizes from 0 to 35 by 35 cm and 100 cm F.S.A.D.
- the collimator also contains a lamp operated by a switch on the side of the housing, which will define the area of the X-ray beam through the blades onto the patient's skin.
- a crosswire assembly Mounted with and in front of the collimator is a crosswire assembly. This is fitted with two pairs of motorized tungsten wires to give any square or rectangular field from 4 x 4 cm to 30 x 30 cm at 100 cm F.S.A.D. Windows inside of the crosswire housing have scales fitted indicating the field sizes at 100 cm. These are repeated on electrical indicators fitted in the remote control console.
- the collimator and crosswire assembly have motorized and manual rotation over the range ⁇ 45°. A suitable scale is provided for reading the angular position.
- the complete head is capable of being electrically driven from its maximum F.S.A.D. of 100 cm down to 60 cm.
- the image intensifier tube assembly 20 Protruding through the front bottom of the arm 12 is the image intensifier tube assembly 20.
- This unit is mounted on a double carriage to enable scanning over an area of ⁇ 18 cm about the center of the X-ray beam both longitudinally and laterally.
- the complete assembly is also capable of being electrically driven from a maximum of 50 cm from the rotation axis to the image intensifier tube face 24, down to 10 cm.
- Anti-collision bars fitted to the image intensifier tube face 24 will, when operated, isolate the electrical supplies to the operating motors. Provision is made to override the anti-collision interlocks in order to drive out of the collision situation.
- the couch assembly 26 includes a steel framework supported on a large precision bearing ring. These are mounted in a pit cast in the floor.
- the framework carries the telescopic ram assembly 28 for the couch 26 together with a circular floor section.
- the bearing allows the couch 26 to be isocentered ⁇ 100° about the X-ray beam, either electrically or manually.
- a scale is fitted around the edge of the pit for positioning.
- the telescopic ram assembly 28 provides vertical movement of the couch top from a minimum height of 60 cm to a maximum of 120 cm.
- Attached to the top of the telescopic ram is a sub-chassis which provides for manually lateral movement.
- a manual brake is provided by levers on either side of the couch, to lock the top in its set position.
- Fitted to this sub-chassis is a side channel couch top having a width of 50cm and a length of 213cm. This is fitted for motorized longitudinal movement of 123cm and provision for manual override to facilitate rapid setting.
- Manual rotation of the couch top of the telescopic ram assembly is provided.
- the manual brake is provided to lock the top to its desired position.
- a cushion top is provided with three removable sections giving clear openings of 43 x 31 cm.
- An overall transparent plastic film provides patient support when the cushions are removed.
- a removable head cushion is provided to expose a drill plate suitable for mounting head clamps, etc.
- FIG. 1 is a block diagram which illustrates the data gathering elements in relation to an X-ray source 30 and patient 32.
- FIG. 5 is a block diagram which illustrates the elements (indicated by a "*") of an embodiment of the present invention which are added to the above referenced Ximatron simulator system to obtain a CT simulator system in accordance with the present invention.
- the additional elements include: pre-patient collimator 34, post-patient collimator 36, grid 38, image intensifier tube 40, right angle flip mirror 42, photodiode linear array 44, imaging extension 45, 16-bit ADC and interface electronics 46, data acquisition interface 48, and a processing and display computer 50.
- an x-ray source 30 passes radiation through a pre-patient collimator 34, then through the patient 32, then through a post-patient collimator 36 and anti-scatter grid 38 to an image intensifier tube 40 (IIT) and imaging extension 45.
- IIT image intensifier tube 40
- the image from image intensifier tube 40 is projected onto a photodiode linear array 44 using first lens 52, right angle mirror 42 and second lens 54.
- first lens 52 right angle mirror 42
- second lens 54 second lens 54
- the image from the image intensifier tube 40 can be viewed with a television camera 56.
- Signals from the photodiode array 44 and imaging extension 45 are sent, on command, to a pre-amp, integrator, reset and clamp circuit 58.
- Control logic circuitry 60 in the preamp, integrator, reset and clamp circuit 58 provides timing signals, which are in turn derived from clocks provided by a phase locked loop timing and control circuit 62. Circuit 62 is synchronized to the 50/60 Hz line frequency.
- Control signals and light intensity signals are sent from the pre-amp, integrator, reset and clamp circuit 58 through an amplifier and filter 64, multiplexed in multiplexer 65 with signals from an x-ray normalization detector 66, and signals from imaging extension detector array 45, to the analog-to-digital - converter and control circuit 68 (ADC).
- ADC analog-to-digital - converter and control circuit 68
- the ADC 68 sends an enable signal to a gantry angle encoder and logic circuit 70, and both send signals to the data processing computer 50 (FIG. 5), via an optically isolated data path 72 and multiplexer 67 in a time-multiplexed manner.
- the computer 50 returns handshake signals to the ADC 68.
- Pre-patient collimator 34 provides the primary collimation of the fan beam that is incident on the object of interest.
- These collimators are typically constructed of lead (“Pb"), are configured to be removable, and typically provide a beam width at the isocenter 74 of between 0.5cm and 1.0cm.
- Pb lead
- FIGS. 2, 3, 6, and 7, typical dimensional relationships are illustrated (without the imaging extension 45) between the X-ray source 30, the pre-patient collimator 34, the center of rotation of the patient 32 ("isocenter"), the post-patient collimator 36, and the image intensifier tube face 24.
- FIGS. 3 and 2 illustrate these dimensional relationships for a full fan-beam "head” scan.
- FIGS. 6 and 7 illustrate these dimensional relationships for a partial fan-beam "body” scan.
- FIGS. 3 and 2 For a "head" scan, referring to FIGS. 3 and 2, it can be seen that the focal spot of the X-ray source 30 is positioned approximately 100cm from the isocenter 74, and the image intensifier tube face 24 is positioned approximately 32cm from isocenter 74.
- FIG. 3 is taken transverse to the width of the beam, so that the axis of rotation of the rotating arm 12 is in the plane of the paper.
- FIG. 2 is taken looking across the width of the beam so that the axis of rotation of the rotating arm 12 is coming out of the plane of the paper.
- beam dimension adjustment jaws 76 Positioned in the x-ray beam are beam dimension adjustment jaws 76, followed by pre-patient collimator 34 at approximately 65 cm from the focal spot of X-ray source 30.
- X-ray normalization detector 66 is positioned on the x-ray source side of the pre-patient collimator 34.
- the post-patient collimator 36 is positioned just above the image intensifier tube 40.
- a full fan-beam is used with a beam thickness of approximately 5mm (at isocenter 74). See Fig. 3.
- the image intensifier tube face 24 is centered in the beam.
- pre-patient collimator 34 has a slit width of approximately 6mm.
- Post-patient collimator 36 has a slit width of approximately 8mm.
- Beam dimension adjustment jaws 76 are set to provide a beam thickness at pre-patient collimator 34 wide enough to illuminate x-ray normalization detector 66, and to provide a beam width which is approximately 21.1cm at the isocenter 74 (see FIG. 2). Further, beam dimension adjustment jaws 76 are positioned close enough to pre-patient collimator 34 so that the latter is the primary collimator of the beam.
- a partial fan-beam is used, with a beam width of approximately 1 cm used at the isocenter 74.
- pre-patient collimator 34 is positioned between 55-65cm from the focal spot of X-ray source 30, and has a slit width of approximately 6mm.
- the image intensifier tube face 24 is positioned approximately 35cm from the isocenter 74.
- Post-patient collimator 36 has a slit width of approximately 13mm.
- the image intensifier tube face 24 is offset from center, and the beam dimension adjustment jaws 76 are set so that a partial fan-beam is generated.
- the beam from the pre-patient collimator 34 would illuminate the image intensifier tube face 24 edge-to edge, but the portion of the beam passing through the isocenter 74 would be incident approximately 3cm from one edge of the image intensifier tube face 24. See FIG. 7.
- the beam would have an outer edge approximately 1.27 degrees from a center line 75 running between the focal spot of the X-ray source 30 and the isocenter 74, and its other outer edge at approximately 10.49 degrees from the center line 75.
- the slice thickness for head scans is 5mm at isocenter, F.I.D. is 147cm.
- F.I.D. 147cm.
- the current slice thickness is 1cm at isocenter, with an F.I.D. at 147cm. This provides additional patient scan circle clearance.
- a 14:1 cylindrically focused grid is included in the post-patient collimation 36.
- the pre-patient collimator 34 gives a well defined fan which helps to reduce patient dose and scatter. It also carries the beam shaping filters which attenuate the peripheral portions of the x-ray beam which pass through thinner portions of the patient 32. This not only reduces patient dose but also reduces the dynamic range over which the IIT 40 and photodiode linear array 44 must respond.
- FIG. 8 illustrates the dimensional relationship when the imaging extension 45 is used.
- a partial fan beam can be used for a 50cm patient scan circle.
- the pre-patient collimator 34 is positioned between 59-63 cm from the X-ray source 30; and the isocenter is approximately 100 cm from the X-ray source 30.
- the image intensifier tube face 24 is positioned approximately 147 cm from the X-ray source 30; and the most vertical point of imaging extension 45 is approximately 8.5cm above the image intensifier tube face 24.
- the x-ray normalization detector 66 is mounted to one side of the slit in the pre-patient collimator 34 and provides readings of source intensity which are used to normalize x-ray tube output variations during the scan.
- the x-ray normalization detector 66 measures the unattenuated x-ray beam flux, allowing the detector to sample quite a large solid angle of the beam.
- X-ray normalization detector 66 is formed by combining a scintillating cadmium-tungstate (CdWO 4 ) crystal with a silicon photodiode. Preferably, the crystal measures 6x6mm by 3mm thick. Additional details of the crystal material, photodiode, and construction are provided hereinbelow in the discussion of the imaging extension detector array 45.
- the 12-inch (30cm) image intensifier tube (IIT) 40 is a conventional medical image intensifier and serves as an X-ray photon to visible light photon converter.
- FIG. 9 provides a cross sectional view of a typical image intensifier tube, and the associated optics of the present invention.
- Incident X-ray photons are absorbed by the thin 0.3 mm CsI (cesium-iodide) scintillator 78 on the image intensifier tube face 24.
- the CsI crystal emits light photons which are converted to electrons by the attached photocathode 80.
- the electrons are accelerated and focused by focusing grids G1, G2 and G3, onto the output phosphor 82 for light conversion.
- the quantum efficiency of this process is characterized by a 4 to 5 order of magnitude (10 4 to 10 5 ) increase in light photons to incident X-ray photons.
- the CsI scintillator 78 is typically 12 mils (300 ⁇ m) thick.
- the output phosphor 82 is preferably "P20" type (ZnCdS).
- the accelerating voltage is typically between 30-35kV.
- a one inch (2,5 cm) diameter image is produced at the output of image intensifier tube 40.
- Lead post-patient collimator 36 (FIG. 1) and anti-scatter grid 38 are used to define the CT slice thickness and to reduce X-ray scatter.
- the post-patient collimator 38 arrangement is mounted on a circular aluminum plate which is then bolted onto the mounting ring of the IIT 40.
- the overall QDE of the measurement system is dependent on the efficient collection of these light photons at the IIT output phosphor 82.
- the light collection optics 84 which views the IIT output is a lens system as shown in FIGS. 1 and 9.
- the light collection efficiency for this lens geometry is proportional to the transmission and the square of the numerical aperture. With both lenses 52 and 54 focused at infinity, their light collection efficiency is approximately 1%, depending on the f-stop setting of the second lens.
- the IIT to light detector QDE in this case is still 2 to 3 orders of magnitude (10 2 to 10 3 ) above unity.
- first lens 52 is a conventional 82mm lens set at a 1.2 f-stop and focused at infinity
- second lens 54 is a conventional 80mm lens set at a 5.6 f-stop and focused at infinity.
- a dual port distributor with a motorized 45 degree flip mirror 42 is used, and is mounted on the IIT 40 in place of the standard distributor.
- the flip mirror 44 normally rests in the fluoro position and when the CT mode is selected, the mirror is flipped through 90 degrees so that the IIT light output is directed onto the linear detector array 44 through second lens 54.
- a variety of solid-state arrays have been evaluated for their suitability as light detectors of image data from the IIT.
- the requirements for the light detector in this system are: compatible spectral sensitivity, a wide signal dynamic range, i.e. 100,000:1, and sufficient spatial resolution for image reproduction.
- Compatible geometrical dimensions are also necessary to permit easy coupling of the photodiode linear array 44 to the output of the IIT 40.
- a commercially available 512 channel linear silicon diode array meets these requirements and has yielded excellent results.
- This array is linear image sensor number S2301, manufactured by Hamamatsu of Hamamatsu City, Japan.
- the array is 1 inch (25.6 mm) in length and 2.5 mm in width.
- Each diode detector is 50 microns by 2.5 mm with 72% active area.
- a 1-to-1 arrangement light collection optics 84 is used between the IIT 40 and the array 44.
- the photodiode linear detector array 44 is built into a camera housing which is mounted at one of the exit windows of the right angled flip mirror 42.
- the normalized photon response of the array is greater than 60% from 475 to 875 nanometers and overlaps the IIT output phosphor spectrum.
- the IIT light output spectrum from the "P20" phosphor peaks at 532 nm.
- the silicon photodiode spectral response is a reasonable match to the "P20" phosphor curve.
- the QDE for silicon is approximately 0.6 - 0.7 electrons/photon. Therefore, from the above, the overall QDE ratio of incident X-ray photon to electron-hole pairs in silicon is still much greater than unity for the system as a whole.
- the detector To obtain a spatial resolution of 1 mm on an object, the detector must have a sufficient number of channels to permit one to digitize the image.
- the photodiode linear array 44 has 512 channels, which translates to 0.6 mm per detector at the image intensifier tube face 24 for a 12 inch (30cm) tube. Tests and specifications on the image intensifier tube 40 have indicated that its spatial resolution is approximately 3.5 line pairs/mm over the 12-inch (30cm) diameter, which exceeds the diode array's equivalent 0.9 line pairs/mm. Therefore, projected to the object, 1 mm resolution is possible in the reconstructed image data.
- the photodiode linear array 44 is a 512 channel linear device with each channel capable of accumulating 22 pico coulombs of charge during an exposure.
- the noise characteristics of the commercial array and preamp is specified as 3500 electrons rms.
- the saturation level to noise ratio yields a single measurement maximum signal to noise ratio of 39,000:1.
- the point spread response of the image intensifier tube 40 indicates a dynamic signal range of at least 100,000:1.
- the single channel dynamic range of the photodiode linear array 44 has been measured to be only 35,000:1 when used with the manufacturer's preamp.
- the photodiode linear array 44 does not have sufficient dynamic range to match the IIT 40 output.
- a dual exposure time scheme may be employed, along with some additional improvements in the charge preamplifier circuitry, to permit the 100,000:1 signal range of IIT 40 to be utilized.
- a new preamplifier integrator design provides a 50,000:1 range at room temperature.
- the combination of the dual exposure time scheme and new preamplifier integrator design provides an array-preamp dynamic range of 400,000:1, or 19 bits total, for each channel, over a measurement interval of 100/83 msec (50/60Hz) while maintaining photon statistics.
- the improvements in dynamic range are obtained in part by minimizing of the effect of the charge amplifier reset noise in the preamplifier, by phase locking the measurement to the line frequency, and by using an analog amplification scheme to amplify the signal from photodiode linear array 44 prior to converting it to digital form.
- ripple and harmonics are a by-product of the rectification of the line voltage used in generating the high voltage CW for the x-ray source.
- phase locked loop timing and control circuit 62 provides a number of clocks which are synchronized to the line frequency. More specifically, phase locked loop timing and control circuit 62 includes a voltage controlled oscillator (not shown) which is operating at a preselected multiple of the line frequency and which is synchronized to the line frequency. Within phase locked loop timing and control circuit 62 are divider circuits which divide down the voltage controlled oscillator signal into a sampling clock 86 and a start frame clock 88. In the embodiment shown in FIG. 1, the sampling clock 86 is 262KHz and the start frame clock includes a 13.3Hz component and a 120Hz component. These clocks are applied to pre-amp integrator, reset and clamp circuit 58.
- phase locked timing and control circuit 62 supplies a select signal to analog-to-digital converter and control circuit 68 to synchronize its operation.
- FIG. 10 a simplified schematic of photodiode linear array 44 is shown.
- the anodes of the 512 photodiodes are connected to a low noise reference, such as a bandgap voltage reference.
- the cathode of each of the 512 diodes is coupled to a video line 90 by way of pass transistors 92.
- the pass transistors are sequentially pulsed by an internal clock which operates off of sample clock 86, FIGS. 1 and 11.
- Input stage 96 includes a low noise, high input-impedance amplifier stage.
- a pair of discrete low noise field effect transistors such as type 2N5912, are used as a front end voltage follower of the amplifier. See FIG. 11.
- the output of the stacked pair is then applied to the inverting input of a high impedance operational amplifier, such as device number OP-27, manufactured by PMI of Santa Clara, California.
- the pre-amp, integrator, reset and clamp circuit 58 includes a reset transistor 102 connected in parallel with capacitor 94, and a clamp transistor 104 connected to the end of coupling capacitor 98 connected to low pass filter 100. Reset transistor 102 is pulsed to discharge capacitor 94 in preparation for receipt of charge from the next photodiode being sampled.
- reset transistor 102 is pulsed with a positive going pulse for a predetermined time, such as two microseconds.
- clamp transistor 104 is pulsed with a negative going pulse, but for a period about twice as long, such as four microseconds.
- coupling capacitor 98 charges to the offset voltage.
- the end of coupling capacitor 98 connected to low pass filter 100 follows the output of input stage 96, which will assume a voltage proportional to the charge being transferred from the next photodiode being sampled in photodiode linear array 44.
- FIG. 11 provides a detailed schematic of the circuitry used to implement one embodiment of the pre-amp, integrator, reset and clamp circuit 58.
- low pass filter 100 is implemented in three separate stages: 106, 108, and 110, with coupling capacitor 98 and clamping transistor 104 being located between stages 106 and 108.
- Stage 106 is non-inverting and provides a gain of 3.6 and low pass filter knee at 610 kHz; stage 108 operates as a follower; and stage 110 in inverting and provides a gain of 1.2 and a low pass filter knee at 220 kHz.
- circuits 112 for generating a three-phase clock for use in sampling the photodiode linear array 44; the reset pulse 114 and clamp pulse 116 supplied to reset and clamp transistors, 102 and 104, respectively; and also the convert signal 118 supplied to ADC 68.
- the imaging extension detector 45 includes an array of 32 discrete detectors 200.
- Each detector 200 includes a high density cadmium tungstate (CdWO 4 ) scintillating crystal 202 mounted and optically coupled to a UV-enhanced silicon photodiode 204.
- the scintillating crystals 202 are 2mm wide by 12mm long by 3mm deep, and have the following characteristics: Stopping power of 150keV gammas in 3mm 90% Stopping power of 3MeV gammas in 12mm 30% Light output relative to NaI (T1) 40% Wavelength of maximum emission 540nm Decay constant 5 ⁇ sec Afterglow at 3msec 0.1% Index of refraction at 540nm 2.2-2.3 Temp. coeff. of light out at 300K 0%/deg.K Density 7.9g/cc Melting point 1598 K Hygroscopic No These crystals are available from NKK of Tokyo, Japan and Harshaw Chemical, of Solon, Ohio.
- Each crystal is resin mounted to a photodiode 204, with the side facing the photodiode being polished, painted with a white reflective coating, and sealed with black epoxy.
- the photodiodes 204 are preferably model no. S1337-16Br manufactured by Hamamatsu of Hamamatsu City, Japan, and have the following characteristics at 25 degrees C: Quantum efficiency at 540nm 70% Radiant sensitivity at 540nm 0.35A/W Noise equivalent power 6x10 -15 W/root Hz Rise time 0.2 ⁇ sec Dynamic range 10 -12 to 10 -4 A Dark current at 10mV rev. bias 25 pA max. Junc. cap. at 10mV rev. bias 65pF Dark current at 5V rev. bias 60 pA typ. Junc. cap. at 5V rev. bias 22pF
- the photodiodes 204 have an active area of 1.1 by 5.9 mm.
- the photodiode 204 case of 2.7mm wide by 15mm long. This yields detector spacing of 2.85 and the 9mm length of the imaging extension detector array 45.
- Each scintillating crystal 202 has an active face of 2mm by 12mm, which yields a slice thickness of the imaging extension detector array 45, referred to the isocenter, of 8mm.
- the limitation on photodetector length is due to the photodiode's active length and case size.
- the x-ray signal is typically very high at the periphery of the scan circle and thus the loss in signal is insignificant. More specifically, the dynamic range requirements at the periphery of the scan circle are a factor of 10 less as compared to detectors at the center. Detectors at the center typically receive the fewest x-ray photons.
- the width of the imaging extension detector 45, referred to the isocenter is approximately 1.9mm, compared to 0.37 mm for the photodiode linear array 44. This yields a spacial resolution approximately a factor of 5 less than the photodiode linear array 44. However, this lower spacial resolution is not significant because high spacial content objects are typically not viewed at the periphery of a body scan circle.
- the array is mounted at the edge of the existing 30cm image intensifier tube face 24.
- a measured x-ray sensitivity profile along the detector face is shown in FIG. 14.
- the combination of image intensifier tube 40 and imaging extension detectors 45 forms an overlapping hybrid detector design.
- X-ray photons which have passed through the object being scanned, are incident on the 2mm by 12mm face of the scintillating crystals 202.
- Each photodiode 204 is operated in the photoconductive mode with 5 volts of reverse bias applied after each integration and readout.
- X-rays absorbed in the scintillator produce light photons which are converted to electron-hole pairs in the diode.
- the resulting current flow discharges the diode and the preamplifier measures this loss in charge for each channel.
- This scheme is a discrete circuit implementation that is similar to the approach used in large integrated circuit linear and 2-D photodiode arrays.
- a multichannel scanning charge preamplifier is used to sample each of the 32 detectors and multiplex this data with the existing IIT camera 512 channel data.
- the sampling of these detectors operate similarly to that used in connection with photodiode linear array 44, described hereinabove. Referring to FIGS. 1 and 15, a simplified block diagram and a detailed schematic of such a circuit are provided.
- Imaging extension detector array 45 is connected to pre-amp, integrator, reset and clamp circuit 58 by way of a multiwire harness 206. Signals from each of the photodiodes 204 in the imaging extension detector array 45 are brought out from, and a 5V reference and ground connections are provided to, imaging extension detector array 45 over the multiwire harness 206. As was the case with the photodiodes of the photodiode linear array 44, a low noise reference is used at the anode of photodiodes 204. The signals from the photodiodes 204 are then applied in parallel to a bank of select circuits 208. These select circuits 208 are controlled by select logic circuit 210 to sequentially and serially place the signals from the photodiodes 204 onto a video line 212.
- select circuits 208 are gating circuits which transfer data applied at their "D” inputs to the "S” output, under control of signals applied to the "G" terminals.
- Select logic circuit 210 includes a bank of parallel to serial shift registers 210-A, 210-B, 210-C and 210-D, which operate to scan the bank of select circuits 208.
- Select logic circuit 210 can be implemented using part number 74HC164.
- the scan is begun upon receipt of a start extension pulse on line 213.
- This pulse is clocked along the parallel to serial shift registers 210-A through 210-D, at a rate set by the extension clock supplied on line 214.
- the start extension pulse and extension clock are supplied from control logic 60 on line 216.
- the preamplifier 234 for the imaging extension detector array 45 uses a input amplifier 219 with a capacitor 220 connected in a negative feedback configuration.
- Line 212 is tied to one end of capacitor 220.
- a reset transistor 218 connected in parallel with a capacitor 220 to reset it in preparation for receipt of the next sample.
- a coupling capacitor 224 couples the output of input amplifier 219 to non-inverting amplifier 226.
- a clamp transistor 222 is connected to the end of coupling capacitor 224 that is connected to non-inverting amplifier 226.
- the output of non-inverting amplifier 226 is connected to lowpass filter 228.
- Reset transistor 218 is pulsed to discharge capacitor 94 in preparation for receipt of charge from the next photodiode being sampled, and clamping transistor 224 is pulsed during this operation, as is the case with reset transistor 102 and clamping transistor 104 in the charge amplifier for the photodiode linear array 44.
- the reset pulse for reset transistor 218 is provided on line 230, while the clamping pulse is supplied on line 232 from the extension clock 216.
- a complete set of X-ray transmission data is obtained by collecting 720 projections or 2 per degree of rotation for 60 seconds. In practice, slightly more projections are collected or slightly more than 360 degrees of rotation. However for purposes of this discussion, 720 projections and 360 degrees of rotation will be assumed.
- line 120 illustrates the allocation of the 720 projections across one revolution of the X-ray head assembly 18 and image intensifier tube assembly 20 about the object of interest. Each such projection takes up approximately 83.3msec (60Hz).
- Line 122 illustrates how each projection can be view as a series of periods of duration T. The example illustrated in FIG. 16 uses T equal to 8.33msec. Within a projection, the periods are grouped to define a long sample interval, 9T in length, and a short sample interval, 1T in length.
- the dynamic range of the photodiode linear array 44 can be greatly increased by utilizing a dual exposure time scheme in the above manner. That is, by using a short sample interval and a long sample interval over which the photodiodes are permitted to convert photons to electrons, the most accurate measurement of the two can be selected for use.
- the point spread response of the IIT 20 indicates a dynamic signal range of at least 100,000:1.
- the single channel dynamic range of the photodiode linear array 44 has been measured to be 35,000:1 when used with the manufacturer's preamp.
- the photodiodes alone will saturate under high levels from IIT 40.
- the short interval sample will be the most accurate for high intensity levels from IIT 40
- the long interval sample will be the most accurate for low intensity levels from the IIT 40. This effectively extends the dynamic range of the photodiodes into the 100,000:1 range.
- the saturation level is 22 picocoulombs.
- the f-stop of second lens 54 is set so that the photodiodes will not saturate over a short interval period when there is no object in the x-ray beam; i.e. with the beam at 125kVp and 15mA.
- this f-stop setting will result in a light level at the photodiode linear array 44 of about one-half to three-fourths the saturation level with no object in the x-ray beam.
- Line 124 illustrates the points at which the photodiodes of photodiode linear array 44 are sampled relative to one another.
- a first series 126 of 544 sample points 512 for the photodiode linear array 44, and 32 for the imaging extension detector array 45. These occur during the left most T-period of line 122; i.e. during the last T-period of projection 1, line 120.
- the second series 128 of 544 sample points occurs during the first T-period in projection 2, line 122.
- the long interval sample for projection 2 is taken during the third series 130 of 544 sample points.
- the short interval sample for projection 2 is taken during the fourth series 132 of 544 sample points.
- the time period between the sampling of diode 1 in second series 128 and third series 130 is nine T-periods. Diode 1 is therefore permitted to integrate the incident photons for nine T-periods before it is again sampled.
- the samples taken in third series 130 thus represent the long interval sample for projection 2.
- Line 134 in FIG. 16 illustrates the time for the sample points for diodes 1-4 in series 126, line 124. As can be seen, the time between sample points is approximately 15.3 microseconds. Within this 15.3 microsecond period, the input stage 96 of pre-amp, integrator, reset and clamp circuit 58 is reset (line 136), the clamp transistor 104 is pulsed (line 138), charge from the photodiode being sampled (for example photodiode 1) is placed on the video line 90 (line 140), and convert signal 114 is sent to ADC 68 (line 142). Lines 144 and 146 show the relative timing of the sampling pulses for photodiodes 2 and 3.
- each diode sample period there are four base-clock periods in each diode sample period. These base-clock periods are related to the 262KHz clock 86 from phase locked loop timing and control circuit 62, FIG. 1. Similarly, the 8.33 microsecond duration of each T-period is related to the 120Hz clock 88 from phase locked loop timing and control circuit 62. Finally, the 13.3Hz clock 88 from phase locked loop timing and control circuit 62 relates to the duration of nine T-periods.
- the intensity of the x-ray source is monitored by x-ray normalization detector 66, FIG. 1.
- the signal from x-ray normalization detector 66 is amplified and filtered and then applied to a multiplexer 65. Also applied to the inputs of multiplexer 65 is the signal from pre-amp, integrator, reset and clamp circuit 58. The output of multiplexer 65 is then applied to ADC 68.
- a select signal 61 is supplied from control logic circuit 60 to select between the signal from x-ray normalization detector 66 or the from pre-amp, integrator, reset and clamp circuit 58 for conversion by the pre-amp, integrator, reset and clamp circuit 58.
- a simple optical switch (not shown) is mounted on the drive stand and a corresponding "finger" is attached to the main gantry gear wheel. This arrangement generates a pulse when the gantry goes through zero degrees, indicating start of scan. The next pulse from the optical switch (360 degrees of rotation later) signals the end of a scan. When the system is ready for data collection, this trigger initiates data acquisition, a pre-set number of projections are always collected, and the end of scan pulse sets a flag in the projection data.
- the data collection controller is set to acquire more projections than are required, so there is a slight overscan (5-10 degrees) at the beginning and end of the gantry rotation. This allows the x-ray generator output to settle and the gantry to reach constant angular velocity before data acquisition begins. Data acquisition stops as soon as the end of scan pulse is detected and the x-ray generator can be turned off.
- a gantry angle encoder and logic circuit 70 is attached to the potentiometer which measures the angle of the rotating arm 12. This encoder nominally gives ten (10) pulses per degree of gantry rotation and hence allows the determination of projection angles to 0.1 degree (12-bit counter).
- Data acquisition interface 48 is an optically isolated interface which utilizes conventional photodiodes and a receiver link. Use of an optical link greatly reduces electrical ground problems.
- an analog channel (not shown) is brought out from amplifier and filter 64 via data acquisition interface 48 for use in calibration and set up purposes.
- Processing and display computer 50 is preferably a conventional 80286 based personal computer.
- the processing and display computer 50 corrects for detector system spatial and intensity non-linearities and offsets.
- the data is preprocessed in the processing and display computer 50 by the array processor. That is, after background subtraction and normalization, the array data is convolved with an empirical filter which compensates for the non-ideal point spread response. After all the projection data is obtained, a 512 x 512 pixel image is then generated using a convolution and backprojection technique.
- the resulting CT image has better than 1 mm spatial resolution and 1% density resolution on a 20 cm water calibration phantom.
- Imaging chain sources of error are: 1) time varying x-ray flux from X-ray source 30; 2) photon scatter; 3) image intensifier tube 40 (non-linearity across face, s-curve distortion, EHT variation with current, center detector, edge effects, curved face, dark current); 4) photodiode linear array 44 (non-linear response, saturation, long versus short integration values, dark current); and 5) optics (internal reflections, distortion, mirror alignment).
- Mechanical system sources of error are: 1) wandering isocenter 74; 2) mechanical flexing; 3) non-uniform rotational speed; 4) lack of stiffness in IIT structure; and 5) non-repeatability of machine positioning.
- the x-ray flux from the X-ray source 30 can vary with time (power frequency fluctuations, photon statistics, etc.). This is measured directly by means of x-ray normalization detector 66.
- the output from x-ray normalization detector 66 provides a current proportional to the number of incident photons. It is assumed that this device is perfectly linear and the readings from the other detectors are normalized to it, i.e., detector elements are scaled as if the x-ray flux was constant and at its peak value.
- the approach used in the present invention is to attempt to eliminate scatter problems by: 1) accurately collimating the fan beam, and 2) using a 14:1 cylindrically focused scatter suppression grid in front of the face of the IIT, although this does cause loss of primary x-ray photons.
- Errors and distortion from the image intensifier tube 40 can arise for the following reasons: 1) uneven distribution of absorbing material/scintillator (CsI) at the face; 2) curvature of the glass face and its increasing thickness away from the center; 3) observed spatial non-linearity across the face of the IIT due to electron focusing errors; 4) s-curve distortion which varies as the IIT 40 is reoriented in the earth's magnetic field; 5) dark current (i.e., noise); 6) dynamic range (max signal:noise); and 7) finite point spread function across the tube face due to internal optical light scatter at the input and output of the tube.
- CsI material/scintillator
- the second lens 54 f-stop is generally set to 5.6 so it could easily be opened up to 4.0 to allow twice as many light photons through.
- the IIT 40 has a QDE of 1,000-10,000, therefore there can be a loss of light photons before the QDE of the system reduces to unity.
- Potential sources of errors in the detector array are: 1) non-linear detector/amplifier response with respect to number of light photons detected; 2) dark current; 3) different response with changes in integration period (for a given light input); 4) detector saturation; and 5) non-repeatability of center detector position.
- a calibration procedure has been implemented to quantify and correct for data acquisition errors.
- the image intensifier tube 40, optics, and photodiode linear array 44 chain are treated as a single unit for the purposes of calibration and data correction. Information obtained as a result of these calibration steps is used to correct the data collected during an actual scan.
- the calibrations are performed in the following order: a) mirror alignment; b) dark current (background); c) center detector and detector array limits (fan angle limits); d) detector system spatial linearity; and e) system point spread function. Additionally, every detector array is calibrated for response non-linearities by using a calibrated light source.
- right angle flip mirror 42 Physical alignment of right angle flip mirror 42 in this system is important since a highly collimated beam of light is to be projected onto a long narrow detector array.
- the adjustment is carried out when the system is installed by carefully centering a specially drilled lead mask 300 over the face of the image intensifier tube 40. See FIG. 17.
- the incident x-ray beam is collimated so that only the drilled area of the mask 300 is illuminated and the x-ray flux is adjusted so that none of the detectors saturate.
- the mirror is adjusted so that the response (displayed on an oscilloscope) of the detectors in the photodiode linear array 44 is symmetrical, flat, and with the correct number of detector peaks.
- FIG. 18 illustrates the typical detector response pattern obtained when using the mask 300. As can be seen from the figure, the magnitude of response is greater for the detectors which receive signals from the large drilled holes.
- first lens 52 and second lens 54 may be adjusted by looking at the "sharpness" of the detected peaks. See FIG. 18. This adjustment need not be performed again unless any of the elements in the optical chain are changed.
- the detector system dark current (noise) is determined by collecting data with the x-ray beam off. The usual number of data projections are collected. The readings for each detector are then summed and averaged to give an average dark current (i.e., background) for each individual detector element in the array.
- the center detector is identified as follows: 1) collect background data; 2) set the x-ray flux so that no detectors saturate; 3) collect data with nothing in the beam; 4) set a pin or needle 302 at the isocenter 74; 5) ignore detectors close to the ends of the photodiode linear array 44 where readings fall off rapidly; 6) run a scan of the pin to collect a full set of readings.
- FIG. 20 shows a typical set of readings for any particular projection.
- the readings are then processed as follows: a) background correct the data; b) select long/short integration values (the longs will always be selected since the x-ray flux is set so that no detectors saturate); c) calculate ln(air norm)-ln(data); and d) set non-useful detectors to zero.
- the peak attenuation values for each projection are identified and a corresponding interpolated detector number calculated, i.e., the center detector for that projection.
- the markers When a ruler with attenuating markers is placed over the face of the IIT and irradiated, the markers will not be equally spaced when viewed at the exit window of the IIT, if there are spatial non-linearities in the detector system.
- the photodetectors in photodiode linear array 44 are uniformly spaced, various effects in the IIT 40 and the imaging path can cause a detector, other than the predicted detector, to be affected when an object is positioned in the fan beam. See FIG. 19.
- image intensifier tube face 24 Among the factors which influence spatial (or geometric) non-linearity are the curvature of image intensifier tube face 24. As can be seen from FIG. 19, the tube face has a convex shape with respect to the fan-beam. This results in rays at the outside of the beam striking the face 24 at a larger relative displacement than rays near the center of the beam. Within the image intensifier tube 40, non-linearities in the focusing grids G1, G2 and G3, can cause the trajectory of emitted electrons to depart from the predicted path. Lens errors in first lens 52 and second lens 54, and mispositioning of the right angle flip mirror 42, are also a source of spatial non-linearities.
- a second pin 304 is placed at an offset from the center pin 302 and then moved slowly through the beam. See FIG. 19. In practice, this effect is actually achieved by keeping the pin fixed and rotating the gantry.
- FIGs. 33a through 33c this effect is illustrated in simplified form.
- top dead center (TDC) of the gantry rotation path is shown at the top of the figure.
- the circle illustrates the path of the gantry rotation.
- X-ray source 30 is shown in a different position in each of the figures. For these different positions of X-ray source 30 it can be seen that a different detector in photodiode linear array 44 is affected by the occluded ray 306.
- the angle ⁇ indicating the angle between center line 75 and TDC, is measured using gantry angle encoder and logic circuit 70.
- Angle ⁇ is the angular position of the calibration needle 304 from top dead center.
- the angle ⁇ can then be calculated from ⁇ , a, the distance from X-ray source 30 to isocenter 74, and the distance between isocenter 74 and calibration needle 304, using well known geometric techniques.
- the angle of the occluded ray 306, and the detector which responded to the occluded ray 306, can be tabulated. See FIG. 21, where such a table is shown with data selected to illustrate the concept. From the geometry of the system, the detector which should have been affected for any position of the "moving" pin 304 can be predicted. This information is also included in the tabulation of FIG. 21. The total fan angle is calculated by examining when the "moving" pin moves into the fan beam and then leaves it.
- the system point spread function is an inherent problem in the imaging chain and is due to: 1) defocusing of electrons in the IIT 40, 2) defocusing and scatter of light photons in the optics, and 3) internal reflections within the optics.
- the point spread function is measured by using a lead slit 312 in conjunction with post patient collimator 36, to cause a selected spot to be illuminated on image intensifier tube face 24.
- the PSF is determined by positioning the lead slit at isocenter 74 and collecting data as the IIT 40 is moved laterally by the simulator motor system on arm 16. The IIT 40 is moved to a position where a detector is fully illuminated and the detector array readings for that position are read out. This is repeated until all 512 detectors of the photodiode linear array 44 have been illuminated and readings for the other 511 photodetectors in the array taken.
- the idealized response to this excitation is shown as curve 314 at the bottom of FIG. 23 as being all zero except in the immediate vicinity of the photodetector which receives the intensified photons from IIT 40.
- the dashed line 316 in the figure shows the expected response, taking into account the physical limitations of the imaging system.
- curve 318 shows what has been actually measured. It is to be noted that there is a distinct "tail" in the response, located symmetrically opposite the real peak.
- step 320 IIT 40 is positioned so that successive photodiodes in photodiode linear array 44 are illuminated as loop 322 is repeated.
- step 324 readings for all 512 photodetectors are taken and placed into a matrix of calibration values in step 324.
- Such a matrix might be arranged so that each column corresponds to the detector readings for a particular slit position, and so that each row corresponds to the magnitudes read at particular detector over all of the slit positions.
- Step 330 checks to determine if all slit positions have been interrogated. If no, loop 322 is repeated and the slit 312 is "moved" to the next position. If yes, the PSF data gathering is completed.
- step 326 for each slit position, the data corresponding to the real peak is zeroed out, along with 5 to 10 detector readings on either side of the peak. This leaves the "tails" intact, and zeros down the diagonal of the matrix.
- FIG. 25 illustrates what the data might look like after the real peaks have been zeroed out. For ease of illustration, the remaining data are depicted in continuous curve form, rather than their actual digital values.
- step 328 the readings in each column which remain from step 326 are then divided by the sum of the readings which were zeroed out for that column. This forms what will be referred to as an " ⁇ matrix.”
- the resulting point spread function tail is a very small number.
- several adjacent detectors are illuminated at any particular slit position.
- the division step in step 328 accounts for the illumination of more than one detector at a time. The manner in which the ⁇ matrix is used to correct the measurement data for the point spread function effect is described in greater detail hereinbelow in connection with step 390, FIG. 26.
- Imaging extension detector array 45 Measurements from imaging extension detector array 45 are combined with those from photodiode linear array 44 to provide 544 measurements.
- the imaging extension detector array 45 When the imaging extension detector array 45 is added to the image intensifier tube 40, its first photodiode is positioned to overlap the last several photodiodes in the photodiode linear array 44.
- the detector spacing of the photodetectors in the imaging extension detector array 45 is approximately five times that of the effective detector spacing in the photodiode linear array 44.
- this lower spatial resolution is not significant because high spatial content objects are typically not viewed at the periphery of a body scan circle.
- values can be obtained which correspond to the desired uniform angular displacement for measurements by the imaging extension detector array 45 by interpolating the actual measurement data. These interpolated values are then moved into the correct "expected detector” slots ready for further processing and back projection.
- the long integrate period is nine half-line cycles (T-periods) long and the following short integrate period is one half-line cycle (T-period) long.
- T-periods nine half-line cycles
- T-period one half-line cycle
- This approach gives an extended period in which to count low numbers of photons accurately. If this reading saturates, then the short integrate value can be used, multiplied by a scaling factor to scale it up to generate an equivalent long integrate value. This approach assumes that the detector response is linear. It also importantly preserves photon statistics. When the short integrate is used the detected x-rays are of sufficient number to discard ninety percent of them in the measurement.
- This dual sample interval approach thus provides a substantial and significant increase in the dynamic range of the imaging system.
- the long interval samples have a 16-bit range
- the use of the short sample interval extends the measurement range to effectively 19-bits.
- the long interval samples would be used for counts up to about 62,000.
- the short samples would be used for counts between 62,000 and about 500,000.
- a dynamic range increase of about 3-bits, or a factor of about 9 is achieved by use of the dual sample interval approach.
- the response of the photodetectors in photodiode linear array 44 are slightly non-linear.
- a simple apparatus for calibrating the photodetector array is used.
- a photodiode calibration fixture holding a single LED and a single normalization photodiode are employed and mounted over the detector array in place of the second lens 54.
- the light output from the single LED is directly proportional to the applied current, thus, the response curves for the photodiodes in the linear array 44 can be determined by plotting photodiode response versus current applied to the LED, and is normalized by curve fitting the data against data from the normalization photodiode.
- the normalizing photodiode can be the same photodiode as used in normalizing detector 66, but without the scintillating crystal.
- constants C 0 , C 1 , C 2 , C 3 and C 4 for 4th-order polynomials for each detector are determined and placed in memory during calibration. These constants are used for example in a fourth order polynomial in which the data obtained for each photodiode has been fit to the normalizing photodiode response data using a least-squares curve fit approach. That is, calibration data is obtained for the normalizing photodiode. This data is assumed linear. Then calibration data for each of the photodiodes in linear array 44 is obtained. The calibration data from the photodiodes in linear array 44 is then curve fit to the normalizing photodiode calibration data using a least squares curve fit criteria.
- FIG. 27 illustrates a table tabulating photodiode number and coefficient values.
- a polynomial rather than table lookup is used because the polynomial is continuous and can be conveniently executed in the array processor.
- the use of a lookup table lookup for the dynamic range found in the present invention would require too much memory and be too slow.
- fourth order polynomials are preferably used, it is to be understood that polynomials of nth-order, where "n" is more or less than four, can be used within the spirit of the invention.
- an adjustment factor is determined prior to curve fitting the calibration data from the photodiodes in the linear array 44 to the calibration data from the normalization photodiode.
- This adjustment factor permits the non-linearities of the photodiode being curve-fit to be more easily interpreted.
- the adjustment factor is determined as follows.
- the normalization factor is determined for the light intensity level that causes the linear array photodiode to output a particular middle range level, e.g. 40,000 counts.
- a linear array photodiode output (“d i ") of 40,000 counts is produced by a light intensity level of I 0
- the normalizing photodetector output (“n i ") is 36,000 counts
- an adjustment factor, g is formed by taking the ratio of n i to d i : n i
- the normalizing photodetector output is always set to be lower than any detector which is being claibrated so that the detector under calibration will staturate before the normalizing detector.
- the adjustment factor, g is then used to multiply the calibration data for the normalizing photodetector, and the calibration data for the linear array photodiodes are curve fit against this adjusted normalizing photodetector calibration data, n i *.
- This procedure effectively sets the coefficient for the first order terms in the nth-order polynomial close to "1", thus better revealing the higher order effects.
- n i normalizing photodiode response for light intensity i
- d i linear array photodiode response for light intensity i
- g the ratio of n i for light intensity I 0 to d i for light intensity I 0 .
- one polynomial accurately describes the curve below about 4000 counts and a second polynomial is used from about 2000 to about 62,000 counts. A third is used above about 44,000 counts. See FIG. 28. Corrected values between 2000 and 4000 counts are obtained by applying both polynomials 1 and 2, then interpolating a final result. Corrected values between 44,000 and 62,000 counts are obtained by applying polynomials 2 and 3, then interpolating a final result.
- polynomial 1 is used with data below 4,000 counts
- polynomial 2 is used with data between 2,000 and 62,000 counts
- polynomial 3 is used with data above 44,000 counts.
- the overlapping portion of these polynomials is used to determine the values in the transitional ranges 2000 to 4000, and 44,000 to 62,000 by interpolation. This provides smooth transition between one polynomial and the next.
- FIG. 29 illustrates a procedure for determining the coefficients for the three polynomials.
- the photodiode calibration fixture (not shown) having the single LED light source and the single normalization photodiode is substituted for lens 54, FIG 1.
- the response of the photodiode normalization detector and the photodiodes in the linear array 44 is determined over the full range of the expected light intensity values. For each intensity level used, a long and a short sampling interval is used to obtain a long and a short measurement.
- step 337 the scaling factor (for multiplying the short interval) is determined as follows using the data from the normalizing photodiode.
- the long and short interval measurements are examined in the range between about 32,000 and 62,000 counts.
- the short measurements are multiplied by a scaling factor which is optimized by least squares fit to obtain the best fit between the long sample measurements and the scaled short sample measurements in that range.
- the optimized scaling factor is then stored for use in multiplying the short sample measurements for the normalizing photodiode.
- the scaling factor is a two-part factor as follows.
- the constants ⁇ and ⁇ are optimized for the best fit over the count range from about 40,000 to 60,000. That is, for the light intensity values that produce values for L i in the 40,000 to 60,000 range, the values for L i and corresponding values for S i are applied to the above equation and the constants a and ⁇ are optimized for best least squares fit.
- Typical values for ⁇ are on the order of 10 -7 , and for ⁇ are approximately 9.
- the coefficients for three, fourth-order polynomials are determined for the photodiode measurement values in the linear array 44, one polynomial each for the ranges 0 to 4,000, 2,000 to 62,000, and 44,000 to 500,000, respectively.
- a "least squares" curve fit is employed. As discussed above, the curve fit is against the calibration data obtained from the normalizing photodiode.
- the calibration values, n i for the normalizing photodiode are provided over the range from 0 to 500,000 counts, with the counts below 60,000 being provided using the long sample interval measurements, L i , multiplied by (1 + ⁇ L i ) and the counts above 60,000 being provided using the short sample interval measurements, S i , multiplied by the constant ⁇ .
- the determination of the constants for the 4th-order polynomial for the 44,000 to 500,000 count range is made using the normalizing photodetector value ⁇ S i and the unscaled short sample interval measurement for the particular photodiode from the linear array 44. Because of this, the coefficients C 30 , C 31 , C 32 , C 33 and C 34 will effectively incorporate the scaling factor ⁇ . Recall that the scaling factor ⁇ adjusts the magnitudes of the short sample interval measurements to the order of the long sample interval measurement, and in doing so effectively increases the dynamic range of the detection system by 3-bits. In the above manner, the increase in dynamic range is passed on to the measurements made by the photodiodes in the linear array 44. These coefficients are then saved for later use.
- step 344 the coefficients C 10 , C 11 , C 12 , C 13 , and C 14 correspond to polynomial 1; the coefficients C 20 , C 21 , C 22 , C 23 , and C 24 correspond to polynomial 2; and the coefficients C 30 , C 31 , C 32 , C 33 , and C 34 correspond to polynomial 3.
- the long sample interval measurements are used for polynomials 1 and 2.
- the short sample interval measurements are used for polynomial 3. These short measurements are fit against the normalizing photodiode measurements which can be long interval measurements, or short interval measurement which have been multiplied by the scaling factor.
- step 343 data is collected in step 345.
- the readings obtained at every projection are: Projection number; Short sampling interval value; Short normalizing detector value; Long sampling interval value; Long normalizing detector value; and gantry angular position.
- Corrected detector data is determined in step 347, FIG. 26.
- processing of the actual detector readings is performed while a scan is in process. Because a scan typically takes about a minute to complete, a significant amount of processing of the data can be done during the scan.
- projection averaging is run to obtain one set of projection readings per degree of gantry rotation. This involves appropriately weighting the projection data taken at angles close to the angle for which the projected data is desired. As discussed earlier, data for two projections per degree are taken; i.e., approximately 720 projections per 360 degrees of rotation in a 60Hz system. The projection averaging reduces the number of projections to about 360, and thus reduces the computational load. For example, projection for gantry angle 321.5°, 322°, and 322.5° might be averaged together to obtain a set of data for a projection 322°.
- POLYNOMIAL 3: DET.' C 30 + C 31 *DET. + C 32 *DET. 2 + C 33 *DET.
- DET. Short sampling interval value.
- DET.' is the CORRECTED DETECTOR value being calculated.
- the coefficients for polynomial 3 will incorporate the scaling factor so that the short sample interval measurement need not be multiplied prior to being plugged into polynomial 3.
- Steps 364, 366, and 368 illustrate that the result from polynomial 1 will be used for DET.' when DET. is less than 2,000. From steps 370 and 372, it can be seen that the interpolated valves from polynomials 1 and 2 will be used for DET.' when DET. is between 2,000 and 4,000. When DET. is less than 44,000, but greater than 4,000, steps 366, 370, 374, and 376, the results from polynomial 2 will be used for DET.'. For DET.
- the particular order of processing can be selected to increase processing speed by taking advantage of the array processor characteristics. Thus, in the present embodiment, it is faster to run all three polynomials on the data, rather than to screen the data first to determine the proper range and polynomial, then run the polynomial.
- step 358 the coefficients for the three polynomials are retrieved.
- step 360 the polynomials 1 and 2 are run using the long sample interval values for the photodiode from the linear array 44, and polynomial 3 is run using the short sample interval valve.
- step 362 the "weights" W 1 , W 2 , W 3 , for each of the three polynomials are determined as a function of the magnitude of the long sample interval value.
- weights W 1 , W 2 , and W 3 are shown.
- the vertical axis represents the weight assigned, while the horizontal axis represents the long sample interval count.
- the count range is O to 500,000
- the transitions between polynomials occur at 2000 to 4000 and at 44,000 to 62,000 counts.
- the weighting factor, W 1 for polynomial 1 covers the count range from 0 to 4000 counts, with a break point at 2000 counts.
- the weighting factor, W 2 for polynomial 2
- the weighting factor W 3 for polynomial 3, covers the count range from 44,000 to 500,000.
- step 347 PSF corrections are made in step 390.
- the vector [I] is the information that is being sought.
- step 392 the ⁇ matrix is retrieved from memory.
- step 394 the DET.' values ("[R]"), from step 347, FIG. 26, are retrieved.
- step 396 the correction vector is determined by multiplying the DET.' values by the ⁇ matrix.
- step 398 the correction vector is subtracted from the DET.' values to obtain the vector [I], [DET. "O, DET.” 1,...DET.” 511].
- the assumption that the PSF is a slowly varying function of position is further exploited to speed up the above identified calculations.
- the ⁇ matrix might initially take the form of a 128x128 matrix.
- actual measurements are taken for the corresponding 128 detectors, and the vector [I] is then calculated from this more limited set of data.
- the resulting 128 element [I] vector can be interpolated to a full 512 element vector with minimal loss of resolution.
- the line integral difference is conventional in the computerized tomography scanner art, and involves taking the difference between the natural logarithm of the intensity measured during an actual projection and the intensity measured by the normalizing photodiode and the intensity using a phantom having known absorption characteristics.
- step 402 is processed in which adjustments are made to compensate for geometric or spatial non-linearites.
- rays in the partial fan-beam which are separated by uniform angles do not necessarily produce responses at detectors in the photodiode linear array 44 which are spaced a correspondingly uniform distance apart.
- FIG. 22 illustrates the averaging/interpolation technique employed in step 402, FIG. 26, which corrects for these spatial non-linearites.
- the upper section of axis 308 illustrates the desired uniform angular interval between measurements, for example, a measurement every ⁇ degrees, between ⁇ 12 degrees.
- the bottom section of axis 308 illustrates the actual angular interval between the actual measurements. Note that due to the spatial non-linearities in the imaging system detector responses occur at other than the required angles.
- intensity values for a desired angular position are determined by selecting a subset of the detector measurements and interpolating those measurements.
- the intensity value for the angular position three- ⁇ intervals from the -12° point might be determined by interpolating the measurements from detectors 1 and 2.
- the intensity value for the angular position two- ⁇ intervals to the left of the 0° position might be determined by interpolating the measurements from detectors 250-253.
- responding detector readings can be averaged/interpolated together and then moved into the correct "required detector" slots ready for further processing and back projection.
- the corrected data is then written to a reconstructor input file where it adjusted for partial fan reconstruction and is then ready for partial fan reconstruction, step 404, FIG. 26.
- CT simulator system can be provided in which images are produced which are calibrated to CT numbers.
- the CT simulator system according to the invention provides data which is calibrated to CT numbers covering the scale of -1000 to +3000, as in conventional diagnostic CT scanners.
- a phantom of known materials is scanned and the transmission values obtained for each of the materials is stored.
- transmission data from an actual scan is obtained, such data is compared against the values obtained for the phantom and appropriate adjustments are made to the data.
Description
- ABS:
- Automatic Brightness System
- ADC:
- Analog to Digital Converter
- CdWO4:
- Cadmium Tungstate
- Cij:
- Polynomial Coefficient for the ith polynomial and the jth order factor in the polynomial
- CsI:
- Cesium Iodide
- CT:
- Computed Tomography
- DET.:
- Actual Detector Measurement
- DET.':
- Actual Detector Measurement Corrected for Photodiode Non-linearities
- DMA:
- Direct Memory Access
- FAD:
- Focus to Axis (Isocenter) Distance
- FID:
- Focus to Intensifier Distance
- F.S.A.D.:
- Focal Spot to Access Distance
- IIT:
- Image Intensifier Tube
- LED:
- Light Emitting Diode
- Pb:
- Lead
- PSF:
- Point Spread Function
- RAM:
- Random Access Memory
- RMS:
- Root Mean Square
- TDC:
- Top Dead Center
- WORM:
- Write Once Read Many
| Stopping power of 150keV gammas in 3mm | 90% |
| Stopping power of 3MeV gammas in 12mm | 30% |
| Light output relative to NaI (T1) | 40% |
| Wavelength of maximum emission | 540nm |
| Decay constant | 5µsec |
| Afterglow at 3msec | 0.1% |
| Index of refraction at 540nm | 2.2-2.3 |
| Temp. coeff. of light out at 300K | 0%/deg.K |
| Density | 7.9g/cc |
| Melting point | 1598 K |
| Hygroscopic | No |
| Quantum efficiency at 540nm | 70% |
| Radiant sensitivity at 540nm | 0.35A/W |
| Noise equivalent power | 6x10-15W/root Hz |
| Rise time | 0.2µsec |
| Dynamic range | 10-12 to 10-4 A |
| Dark current at 10mV rev. bias | 25 pA max. |
| Junc. cap. at 10mV rev. bias | 65pF |
| Dark current at 5V rev. bias | 60 pA typ. |
| Junc. cap. at 5V rev. bias | 22pF |
DET.' is the CORRECTED DETECTOR value being calculated. In practice, the coefficients for polynomial 3 will incorporate the scaling factor so that the short sample interval measurement need not be multiplied prior to being plugged into polynomial 3.


[A]-1:
Claims (19)
- A radiation therapy x-ray simulator comprising an x-ray source, a gantry to support the x-ray source, a couch to support a patient and an image forming system, wherein the simulator is constructed such that the x-ray source is positioned relative to the couch in a geometry essentially identical to the geometry of the same elements of a target radiotherapy machine, said image forming system including;characterised in that the detector (44) is a photo diode detector having a third quantum efficiency, in that the product of said first, second and third quantum efficiencies is greater than unity, the photo diode detector including a main array of photodiodes (44) positioned to receive the visible radiation coupled by the lens means and providing an output signal; and in thatan image intensifier (40) for converting x-rays from said x-ray source to electrons after said x-rays have passed through said patient, and for accelerating said electrons to an output phosphor screen (82) to provide visible radiation, said image intensifier (40) having a first quantum efficiency;a detector (44) for converting said visible radiation from the image intensifier into an electrical signal, said detector having a dynamic range of at least 35.000 to 1;lens means (52, 54) for coupling said visible radiation from said image intensifier to said detector, said lens means being interposed between said output phosphor screen (82) and said detector and having a geometry having a second quantum efficiency;
an extension photo diode detector array (45) is provided, which is positioned to receive x-rays and which provides an output signal. - A simulator as claimed in claim 1 wherein the output phosphor screen of the image intensifier has an output spectrum and further wherein said photodiode detector is a semiconductor array which exhibits a spectral response in the region which overlaps the spectrum of the output phosphor.
- A simulator as claimed in claim 2 wherein the semiconductor array spectral response in the spectral region which overlaps the spectrum of the image intensifier phosphor screen is at least 0.5 electrons/visible photon.
- A simulator as claimed in claim 2 wherein the photodiode detector includesa plurality of photodiodes each of which convert the visible radiation into a quantity of charge;means for integrating the quantity of charge from each of the photodiodes, andmeans for resetting the integrating means in preparation for receipt of a subsequent detector signal.
- A simulator as claimed in claim 4 wherein the means for integrating includesan amplifier having an output, an inverting input to which the quantity of charge is supplied, and a non-inverting input which is coupled to a system common point;capacitor means coupled between the output and the inverting input of the amplifier for accumulating the applied quantity of charge; and further wherein the resetting means includesfirst switch means coupled in parallel with the capacitor means for controllably discharging the capacitor means in preparation for receipt of a subsequent quantity of charge; andsecond switch means coupled between the output of the amplifier and the system common point for clamping the output of the amplifier to system common whenever the first switch means is controlled to discharge the capacitor means.
- A simulator as claimed in claim 5 wherein the output of the amplifier is digitized by analog to digital converter means.
- A simulator as claimed in claim 6 wherein the photodiode detector include means for phase locking the operation of the integrating means, the resetting means, and the analog to digital converter means to a designated reference signal.
- A simulator as claimed in claim 7 wherein the therapy simulator machine is powered by a line voltage, and the designated reference signal is the line voltage.
- A simulator as claimed in any one of claims 1 to 8 wherein the extension detector array comprises a plurality of detectors, each of which comprisesa body of scintillating crystal material providing visible light photons over a range of the visible light spectrum in proportion to an intensity of the impinging x-rays; anda photodiode optically coupled to the body, having a response characteristic which is compatible with the range of the visible light spectrum providing by the body, and providing a current which is proportional to the visible light photons received from the body.
- A simulator as claimed in claim 9 wherein said photodiode detector includes means for accommodating output signal magnitudes from the main array of photodiodes and the extension detector array.
- A simulator as claimed in claim 10 wherein said means for accommodating detector signal magnitudes includes means for measuring the photodiode outputs from the main array and the extension detector array over two sample intervals one of which is longer than the other and for selecting the sample which most accurately represents the magnitude of the x-ray photons impinging on the image intensifier and the extension detector array.
- A simulator as claimed in claim 10 wherein said means for accommodating detector signal magnitudes includes analog electronics.
- A simulator as claimed in claim 12 including digitizing means for providing an effective 19 bit signal representative of the outputs from the main array of photodiodes and from the extension detector array.
- A simulator as claimed in claim 13 wherein said digitizing means includes a 16 bit analog-to-digital converter and means for transforming the 16 bits of data from the 16 bit analog-to-digital converter into an effective 19 bit signal when a predetermined sample interval is used to sample the photodiode detector.
- The simulator of claim 1 wherein said diode photodetector includes means for measuring the electrical signals from the image intensifier over a first sample interval and a second sample interval, the first sample interval being longer than the second sample interval.
- The simulator of claim 15 wherein photodiodes of the photodetector accumulate charge when the visible radiation impinges upon them, and further wherein the means for measuring during the first and second sample intervals are in communication with the photodiodes of the photodetector means and control the first and second time intervals over which photodiodes are permitted to accumulate charge.
- The simulator of claim 16 wherein the sum of the first and second time intervals for accumulating charge is a predetermined magnitude, and further wherein the first time interval is nine times longer than the second time interval.
- The simulator of claim 17 wherein the simulator is operable to obtain a plurality of scans, and a plurality of projections within each of the plurality of scans, and further wherein all photodiodes of the photodetector are each sampled over the first time interval and over the second time interval during each of the plurality of projections.
- The simulator of claim 17 wherein the electrical signals from the photodiode detector have an expected range of magnitudes, and further wherein the first time interval samples are selected as the electrical signal to be used in constructing a tomographic x-ray image when the detector signal magnitude is below a transition range of magnitudes; and further wherein the second time interval samples, multiplied by a scaling factor, are selected as the electrical signal to be used in constructing the tomographic x-ray image when the detector signal magnitude is above the transition range of magnitudes, and a weighted combination of the first interval samples and the scaled second interval samples are selected as the detector signal to be used in constructing the tomographic x-ray image when the electrical signal magnitude falls within the transition range of magnitudes.
Applications Claiming Priority (3)
| Application Number | Priority Date | Filing Date | Title |
|---|---|---|---|
| US54745090A | 1990-07-02 | 1990-07-02 | |
| US547450 | 1990-07-02 | ||
| PCT/US1991/004778 WO1992000567A1 (en) | 1990-07-02 | 1991-07-02 | Computed tomography apparatus using image intensifier detector |
Publications (3)
| Publication Number | Publication Date |
|---|---|
| EP0489904A1 EP0489904A1 (en) | 1992-06-17 |
| EP0489904A4 EP0489904A4 (en) | 1993-05-05 |
| EP0489904B1 true EP0489904B1 (en) | 1998-03-04 |
Family
ID=24184691
Family Applications (1)
| Application Number | Title | Priority Date | Filing Date |
|---|---|---|---|
| EP91913217A Expired - Lifetime EP0489904B1 (en) | 1990-07-02 | 1991-07-02 | Radiation therapy x-ray simulator |
Country Status (6)
| Country | Link |
|---|---|
| US (1) | US5692507A (en) |
| EP (1) | EP0489904B1 (en) |
| JP (1) | JP3197559B2 (en) |
| AU (1) | AU646068B2 (en) |
| DE (1) | DE69129008T2 (en) |
| WO (1) | WO1992000567A1 (en) |
Cited By (1)
| Publication number | Priority date | Publication date | Assignee | Title |
|---|---|---|---|---|
| GB2366501A (en) * | 2000-08-16 | 2002-03-06 | Elekta Ab | Radiotherapy simulation apparatus |
Families Citing this family (80)
| Publication number | Priority date | Publication date | Assignee | Title |
|---|---|---|---|---|
| US5613205A (en) * | 1995-03-31 | 1997-03-18 | Telefonaktiebolaget Lm Ericsson | System and method of locating a mobile terminal within the service area of a cellular telecommunication system |
| US5867553A (en) * | 1995-11-02 | 1999-02-02 | Analogic Corporation | Computed tomography scanner with reduced power x-ray source |
| US5760974A (en) * | 1997-02-18 | 1998-06-02 | Photometrics, Ltd. | Lens system for maximizing light collection efficiency and transmission |
| US6047042A (en) * | 1998-03-25 | 2000-04-04 | Continental X-Ray Corporation | Automatic exposure and brightness control for fluoroscopic and radio-graphic imaging |
| US6266434B1 (en) * | 1998-07-17 | 2001-07-24 | General Electric Company | Methods and apparatus for reducing spectral artifacts in a computed tomograph system |
| US6370217B1 (en) * | 1999-05-07 | 2002-04-09 | General Electric Company | Volumetric computed tomography system for cardiac imaging |
| US6396898B1 (en) * | 1999-12-24 | 2002-05-28 | Kabushiki Kaisha Toshiba | Radiation detector and x-ray CT apparatus |
| SE518801C2 (en) * | 2000-06-05 | 2002-11-26 | Xcounter Ab | Device and method for detecting ionizing radiation |
| US6618604B2 (en) * | 2000-12-28 | 2003-09-09 | Ge Medical Systems Global Technology Company, Llc. | Method and apparatus for correcting the offset induced by field effect transistor photo-conductive effects in a solid state x-ray detector |
| US6389097B1 (en) * | 2000-12-28 | 2002-05-14 | Ge Medical Systems Global Technology Company, Llc | Multi-plate volumetric CT scanner gap compensation method and apparatus |
| FR2819368B1 (en) * | 2001-01-09 | 2006-09-15 | Ge Med Sys Global Tech Co Llc | CALIBRATION METHOD OF RADIOLOGY APPARATUS, AND RADIOLOGY APPARATUS |
| US7141812B2 (en) | 2002-06-05 | 2006-11-28 | Mikro Systems, Inc. | Devices, methods, and systems involving castings |
| WO2002098624A1 (en) | 2001-06-05 | 2002-12-12 | Mikro Systems Inc. | Methods for manufacturing three-dimensional devices and devices created thereby |
| US7785098B1 (en) | 2001-06-05 | 2010-08-31 | Mikro Systems, Inc. | Systems for large area micro mechanical systems |
| US6434215B1 (en) * | 2001-06-28 | 2002-08-13 | General Electric Company | EKG-less cardiac image reconstruction |
| US6728571B1 (en) | 2001-07-16 | 2004-04-27 | Scimed Life Systems, Inc. | Electronically scanned optical coherence tomography with frequency modulated signals |
| US7058211B2 (en) * | 2001-07-18 | 2006-06-06 | Scimed Life Systems, Inc. | Electronics interface for an ultrasound console |
| US6914959B2 (en) * | 2001-08-09 | 2005-07-05 | Analogic Corporation | Combined radiation therapy and imaging system and method |
| US6888919B2 (en) * | 2001-11-02 | 2005-05-03 | Varian Medical Systems, Inc. | Radiotherapy apparatus equipped with an articulable gantry for positioning an imaging unit |
| US7058210B2 (en) * | 2001-11-20 | 2006-06-06 | General Electric Company | Method and system for lung disease detection |
| CA2478296A1 (en) * | 2002-03-06 | 2003-09-18 | Tomotherapy Incorporated | Method for modification of radiotherapy treatment delivery |
| US6868138B2 (en) | 2002-05-29 | 2005-03-15 | The Regents Of The University Of Michigan | Method, processor and computed tomography (CT) machine for generating images utilizing high and low sensitivity data collected from a flat panel detector having an extended dynamic range |
| US7356115B2 (en) | 2002-12-04 | 2008-04-08 | Varian Medical Systems Technology, Inc. | Radiation scanning units including a movable platform |
| US7227925B1 (en) | 2002-10-02 | 2007-06-05 | Varian Medical Systems Technologies, Inc. | Gantry mounted stereoscopic imaging system |
| US7657304B2 (en) | 2002-10-05 | 2010-02-02 | Varian Medical Systems, Inc. | Imaging device for radiation treatment applications |
| US7208717B2 (en) | 2002-10-16 | 2007-04-24 | Varian Medical Systems Technologies, Inc. | Method and apparatus for correcting excess signals in an imaging system |
| US7672426B2 (en) | 2002-12-04 | 2010-03-02 | Varian Medical Systems, Inc. | Radiation scanning units with reduced detector requirements |
| US7945021B2 (en) | 2002-12-18 | 2011-05-17 | Varian Medical Systems, Inc. | Multi-mode cone beam CT radiotherapy simulator and treatment machine with a flat panel imager |
| JP4133429B2 (en) * | 2003-02-24 | 2008-08-13 | 浜松ホトニクス株式会社 | Semiconductor device |
| GB2401766B (en) * | 2003-03-11 | 2006-03-15 | Symetrica Ltd | Improved gamma-ray camera system |
| US7412029B2 (en) * | 2003-06-25 | 2008-08-12 | Varian Medical Systems Technologies, Inc. | Treatment planning, simulation, and verification system |
| JP2007518442A (en) * | 2003-07-10 | 2007-07-12 | コーニンクレッカ フィリップス エレクトロニクス エヌ ヴィ | Imaging system, X-ray imaging apparatus, method and computer program for reducing artifacts in a three-dimensional reconstructed volume |
| TWI252393B (en) * | 2003-09-08 | 2006-04-01 | Samsung Electronics Co Ltd | A spread spectrum clock generator and method and system of generating a spread spectrum clock |
| US7123015B2 (en) * | 2004-09-29 | 2006-10-17 | General Electric Company | Magnetic resonance system and method |
| US7215732B2 (en) * | 2004-09-30 | 2007-05-08 | General Electric Company | Method and system for CT reconstruction with pre-correction |
| US7957507B2 (en) | 2005-02-28 | 2011-06-07 | Cadman Patrick F | Method and apparatus for modulating a radiation beam |
| WO2007018646A1 (en) | 2005-04-29 | 2007-02-15 | Varian Medical Systems Technologies, Inc. | Radiation treatment systems and components thereof |
| US10004650B2 (en) | 2005-04-29 | 2018-06-26 | Varian Medical Systems, Inc. | Dynamic patient positioning system |
| US8232535B2 (en) | 2005-05-10 | 2012-07-31 | Tomotherapy Incorporated | System and method of treating a patient with radiation therapy |
| KR20080044251A (en) | 2005-07-22 | 2008-05-20 | 토모테라피 인코포레이티드 | Method of placing constraints on a deformation map and system for implementing same |
| KR20080039920A (en) | 2005-07-22 | 2008-05-07 | 토모테라피 인코포레이티드 | System and method of evaluating dose delivered by a radiation therapy system |
| US8442287B2 (en) * | 2005-07-22 | 2013-05-14 | Tomotherapy Incorporated | Method and system for evaluating quality assurance criteria in delivery of a treatment plan |
| EP1907065B1 (en) | 2005-07-22 | 2012-11-07 | TomoTherapy, Inc. | Method and system for adapting a radiation therapy treatment plan based on a biological model |
| WO2007014108A2 (en) | 2005-07-22 | 2007-02-01 | Tomotherapy Incorporated | Method and system for evaluating quality assurance criteria in delivery of a treament plan |
| DE602006021803D1 (en) | 2005-07-22 | 2011-06-16 | Tomotherapy Inc | A system for delivering radiotherapy to a moving target area |
| JP2009514559A (en) | 2005-07-22 | 2009-04-09 | トモセラピー・インコーポレーテッド | System and method for generating contour structure using dose volume histogram |
| EP1907059A4 (en) | 2005-07-22 | 2009-10-21 | Tomotherapy Inc | Method of and system for predicting dose delivery |
| EP2532386A3 (en) | 2005-07-22 | 2013-02-20 | TomoTherapy, Inc. | System for delivering radiation therapy to a moving region of interest |
| EP1907984A4 (en) | 2005-07-22 | 2009-10-21 | Tomotherapy Inc | Method and system for processing data relating to a radiation therapy treatment plan |
| US7643661B2 (en) | 2005-07-22 | 2010-01-05 | Tomo Therapy Incorporated | Method and system for evaluating delivered dose |
| EP1907057B1 (en) | 2005-07-23 | 2017-01-25 | TomoTherapy, Inc. | Radiation therapy delivery device utilizing coordinated motion of gantry and couch |
| US7880154B2 (en) | 2005-07-25 | 2011-02-01 | Karl Otto | Methods and apparatus for the planning and delivery of radiation treatments |
| JP4772426B2 (en) * | 2005-08-25 | 2011-09-14 | 株式会社東芝 | X-ray computed tomography system |
| US7596254B2 (en) * | 2006-03-17 | 2009-09-29 | William Marsh Rice University | Intra-operative 3-D reconstruction of bone cement boli using X-rays |
| US7336760B2 (en) * | 2006-07-28 | 2008-02-26 | Varian Medical Systems Technologies, Inc. | Methods, systems, and computer-program products to estimate scattered radiation in cone-beam computerized tomographic images and the like |
| EP2046450A4 (en) * | 2006-07-28 | 2009-10-21 | Tomotherapy Inc | Method and apparatus for calibrating a radiation therapy treatment system |
| US9451928B2 (en) * | 2006-09-13 | 2016-09-27 | Elekta Ltd. | Incorporating internal anatomy in clinical radiotherapy setups |
| USRE46953E1 (en) | 2007-04-20 | 2018-07-17 | University Of Maryland, Baltimore | Single-arc dose painting for precision radiation therapy |
| EP2214582A2 (en) * | 2007-10-25 | 2010-08-11 | Tomotherapy Incorporated | Method for adapting fractionation of a radiation therapy dose |
| US8577115B2 (en) * | 2008-03-04 | 2013-11-05 | Tomotherapy Incorporated | Method and system for improved image segmentation |
| WO2010025372A2 (en) * | 2008-08-28 | 2010-03-04 | Tomotherapy Incorporated | System and method of contouring a target area |
| CN102138155A (en) | 2008-08-28 | 2011-07-27 | 断层放疗公司 | System and method of calculating dose uncertainty |
| EP2559534B1 (en) | 2008-09-26 | 2023-10-25 | Raytheon Technologies Corporation | Composition and method for casting manufacturing |
| US20100228116A1 (en) * | 2009-03-03 | 2010-09-09 | Weiguo Lu | System and method of optimizing a heterogeneous radiation dose to be delivered to a patient |
| JP4516626B1 (en) * | 2009-09-28 | 2010-08-04 | 株式会社吉田製作所 | Dental X-ray equipment |
| WO2011041412A2 (en) * | 2009-09-29 | 2011-04-07 | Tomotherapy Incorporated | Patient support device with low attenuation properties |
| WO2011053802A2 (en) * | 2009-10-30 | 2011-05-05 | Tomotherapy Incorporated | Non-voxel-based broad-beam (nvbb) algorithm for intensity modulated radiation therapy dose calculation and plan optimization |
| CN103038669A (en) | 2010-06-22 | 2013-04-10 | 卡尔·奥托 | System and method for estimating and manipulating estimated radiation dose |
| JP2012024344A (en) * | 2010-07-23 | 2012-02-09 | Canon Inc | X-ray imaging apparatus, x-ray imaging method, program, and computer storage medium |
| US8813824B2 (en) | 2011-12-06 | 2014-08-26 | Mikro Systems, Inc. | Systems, devices, and/or methods for producing holes |
| CN103837272A (en) * | 2012-11-27 | 2014-06-04 | Ge医疗系统环球技术有限公司 | Curved-surface film pressure sensor and manufacturing method thereof |
| CN105027227B (en) | 2013-02-26 | 2017-09-08 | 安科锐公司 | Electromagnetically actuated multi-diaphragm collimator |
| US20160231452A1 (en) * | 2013-10-11 | 2016-08-11 | Analogic Corporation | Tomosynthesis imaging |
| US9216005B2 (en) * | 2013-10-28 | 2015-12-22 | Kabushiki Kaisha Toshiba | Synchronized view data acquisition between stationary spectral detectors and rotating energy integrating detectors for spectral computer-aided tomography |
| US9801595B2 (en) * | 2014-09-08 | 2017-10-31 | Toshiba Medical Systems Corporation | Count-weighted least squares parameter estimation for a photon-counting detector |
| JP6342437B2 (en) * | 2016-02-22 | 2018-06-13 | ゼネラル・エレクトリック・カンパニイ | Radiation tomography system and control program therefor |
| US10806409B2 (en) | 2016-09-23 | 2020-10-20 | Varian Medical Systems International Ag | Medical systems with patient supports |
| US10921467B2 (en) | 2017-09-15 | 2021-02-16 | Analogic Corporation | Detector array for imaging modality |
| US11050398B2 (en) | 2019-01-16 | 2021-06-29 | Analog Devices International Unlimited Company | Large input current detection and fast response optical receiver |
| CN111489623A (en) * | 2020-04-28 | 2020-08-04 | 中南民族大学 | CT principle virtual simulation experiment teaching system based on Ulty |
Citations (4)
| Publication number | Priority date | Publication date | Assignee | Title |
|---|---|---|---|---|
| US4426721A (en) * | 1980-10-07 | 1984-01-17 | Diagnostic Information, Inc. | X-ray intensifier detector system for x-ray electronic radiography |
| US4647975A (en) * | 1985-10-30 | 1987-03-03 | Polaroid Corporation | Exposure control system for an electronic imaging camera having increased dynamic range |
| EP0247449A1 (en) * | 1986-05-19 | 1987-12-02 | Varian-Tem Limited | Improvements in or relating to a radiation therapy simulator |
| US4833698A (en) * | 1986-02-24 | 1989-05-23 | Exxon Research And Engineering Company | Apparatus for three dimensional tomography utilizing an electro-optic x-ray detector |
Family Cites Families (35)
| Publication number | Priority date | Publication date | Assignee | Title |
|---|---|---|---|---|
| US3624428A (en) * | 1970-03-20 | 1971-11-30 | Rca Corp | Electric signal processing circuit employing capacitively scanned phototransistor array |
| US3983398A (en) * | 1974-11-29 | 1976-09-28 | The Board Of Trustees Of Leland Stanford Junior University | Method and apparatus for X-ray or γ-ray 3-D tomography using a fan beam |
| US4149247A (en) * | 1975-12-23 | 1979-04-10 | Varian Associates, Inc. | Tomographic apparatus and method for reconstructing planar slices from non-absorbed and non-scattered radiation |
| US4149248A (en) * | 1975-12-23 | 1979-04-10 | Varian Associates, Inc. | Apparatus and method for reconstructing data |
| NL7605253A (en) * | 1976-05-17 | 1977-11-21 | Optische Ind De Oude Delft Nv | DEVICE FOR TOMOGRAPHY. |
| DE2622177A1 (en) * | 1976-05-19 | 1977-12-01 | Philips Patentverwaltung | ARRANGEMENT FOR DETERMINING THE ABSORPTION OF RADIATION IN ONE PLANE OF A BODY |
| NL7605687A (en) * | 1976-05-26 | 1977-11-29 | Optische Ind De Oude Delft Nv | DEVICE FOR TOMOGRAPHY. |
| NL7607976A (en) * | 1976-07-19 | 1978-01-23 | Optische Ind De Oude Delft Nv | DEVICE FOR TOMOGRAPHY WITH FACILITIES BY WHICH SIGNAL PROFILES DERIVATIVE FROM A RADIANT BEAM BE CONSTRUCTED INTO SIGNAL PROFILES EACH CORREPONDING WITH A BUNDLE OF BALANCED BEAM. |
| NL7611419A (en) * | 1976-10-15 | 1978-04-18 | Optische Ind De Oude Delft Nv | DEVICE FOR READING AND PROCESSING INFORMATION CONTAINED IN IMAGE FRAMES, SUCH AS FORMED BY IT CONSEQUENTLY FROM MULTIPLE DIRECTIONS WITH A BASICALLY FLAT BEAM OF SHORT-WAVE RADIATION, RADIATION OF AN OBJECT. |
| US4321486A (en) * | 1980-02-22 | 1982-03-23 | Honeywell Inc. | Photodetector signal control in charge transfer device imager |
| US4383327A (en) * | 1980-12-01 | 1983-05-10 | University Of Utah | Radiographic systems employing multi-linear arrays of electronic radiation detectors |
| US4399464A (en) * | 1981-05-04 | 1983-08-16 | General Dynamics, Pomona Division | Signal processor for an array of CID radiation detector elements |
| JPS58127132A (en) * | 1982-01-25 | 1983-07-28 | Asahi Optical Co Ltd | Photodetector |
| US4694339A (en) * | 1984-05-29 | 1987-09-15 | Elscint Ltd. | Power line locked image processing systems |
| US4734776A (en) * | 1986-08-15 | 1988-03-29 | General Electric Company | Readout circuit for an optical sensing charge injection device facilitating an extended dynamic range |
| US4868843A (en) * | 1986-09-10 | 1989-09-19 | Varian Associates, Inc. | Multileaf collimator and compensator for radiotherapy machines |
| JPH0771238B2 (en) * | 1986-09-24 | 1995-07-31 | 株式会社日立製作所 | Solid-state imaging device |
| US4945552A (en) * | 1987-12-04 | 1990-07-31 | Hitachi, Ltd. | Imaging system for obtaining X-ray energy subtraction images |
| JPH01285248A (en) * | 1988-05-12 | 1989-11-16 | Toshiba Corp | X-ray tv apparatus |
| JPH01307196A (en) * | 1988-06-02 | 1989-12-12 | Toshiba Corp | X-ray television apparatus |
| DE3877960D1 (en) * | 1988-10-05 | 1993-03-11 | Siemens Ag | X-RAY DIAGNOSTIC SYSTEM WITH A DETECTOR FOR THE MEDIUM IMAGE BRIGHTNESS. |
| US5138642A (en) * | 1989-03-02 | 1992-08-11 | Innovative Imaging Systems, Inc. | Detector imaging arrangement for an industrial CT device |
| US5057692A (en) * | 1990-06-29 | 1991-10-15 | General Electric Company | High speed, radiation tolerant, CT scintillator system employing garnet structure scintillators |
| US5117445A (en) * | 1990-07-02 | 1992-05-26 | Varian Associates, Inc. | Electronically enhanced x-ray detector apparatus |
| US5168532A (en) * | 1990-07-02 | 1992-12-01 | Varian Associates, Inc. | Method for improving the dynamic range of an imaging system |
| DE4232901A1 (en) * | 1992-10-01 | 1994-04-07 | Siemens Ag | Medical X=Ray diagnostic equipment with optimum setting of emission control - has stray transmitted emission received by sensors to provide signal compared with reference to control generator |
| JPH0799618A (en) * | 1993-02-02 | 1995-04-11 | Philips Electron Nv | Automatic-gain-control video device |
| US5461658A (en) * | 1993-05-21 | 1995-10-24 | U.S. Philips Corporation | X-ray examination apparatus |
| DE4330784C2 (en) * | 1993-09-10 | 1999-12-30 | Siemens Ag | X-ray diagnostic device |
| BE1007674A3 (en) * | 1993-10-28 | 1995-09-12 | Philips Electronics Nv | Ray research unit. |
| DE4343072C1 (en) * | 1993-12-16 | 1995-06-29 | Siemens Ag | X=ray diagnostic appts. |
| DE4415990A1 (en) * | 1994-05-06 | 1995-11-23 | Philips Patentverwaltung | Process for reproducing, in particular, a digital X-ray image as a visible image and arrangement for carrying out the process |
| US5537452A (en) * | 1994-05-10 | 1996-07-16 | Shepherd; Joseph S. | Radiation therapy and radiation surgery treatment system and methods of use of same |
| US5473660A (en) * | 1994-06-01 | 1995-12-05 | U.S. Philips Corporation | Image sensing device |
| DE4420833C2 (en) * | 1994-06-15 | 1996-11-07 | Siemens Ag | Real-time X-ray television imaging system with a CCD solid-state image sensor |
-
1991
- 1991-07-02 EP EP91913217A patent/EP0489904B1/en not_active Expired - Lifetime
- 1991-07-02 WO PCT/US1991/004778 patent/WO1992000567A1/en active IP Right Grant
- 1991-07-02 AU AU82853/91A patent/AU646068B2/en not_active Ceased
- 1991-07-02 JP JP51266691A patent/JP3197559B2/en not_active Expired - Fee Related
- 1991-07-02 DE DE69129008T patent/DE69129008T2/en not_active Expired - Fee Related
-
1994
- 1994-12-07 US US08/352,269 patent/US5692507A/en not_active Expired - Fee Related
Patent Citations (4)
| Publication number | Priority date | Publication date | Assignee | Title |
|---|---|---|---|---|
| US4426721A (en) * | 1980-10-07 | 1984-01-17 | Diagnostic Information, Inc. | X-ray intensifier detector system for x-ray electronic radiography |
| US4647975A (en) * | 1985-10-30 | 1987-03-03 | Polaroid Corporation | Exposure control system for an electronic imaging camera having increased dynamic range |
| US4833698A (en) * | 1986-02-24 | 1989-05-23 | Exxon Research And Engineering Company | Apparatus for three dimensional tomography utilizing an electro-optic x-ray detector |
| EP0247449A1 (en) * | 1986-05-19 | 1987-12-02 | Varian-Tem Limited | Improvements in or relating to a radiation therapy simulator |
Cited By (2)
| Publication number | Priority date | Publication date | Assignee | Title |
|---|---|---|---|---|
| GB2366501A (en) * | 2000-08-16 | 2002-03-06 | Elekta Ab | Radiotherapy simulation apparatus |
| GB2366501B (en) * | 2000-08-16 | 2002-07-17 | Elekta Ab | Radiotherapy simulation apparatus |
Also Published As
| Publication number | Publication date |
|---|---|
| JP3197559B2 (en) | 2001-08-13 |
| DE69129008D1 (en) | 1998-04-09 |
| JPH05502399A (en) | 1993-04-28 |
| EP0489904A4 (en) | 1993-05-05 |
| US5692507A (en) | 1997-12-02 |
| EP0489904A1 (en) | 1992-06-17 |
| AU8285391A (en) | 1992-01-23 |
| WO1992000567A1 (en) | 1992-01-09 |
| DE69129008T2 (en) | 1998-08-20 |
| AU646068B2 (en) | 1994-02-03 |
Similar Documents
| Publication | Publication Date | Title |
|---|---|---|
| EP0489904B1 (en) | Radiation therapy x-ray simulator | |
| EP0489906B1 (en) | Radiation therapy simulator machine | |
| EP0489154B1 (en) | Method for improving the dynamic range of an imaging system | |
| EP0489908B1 (en) | Method for increasing the accuracy of a radiation therapy apparatus | |
| JP3128634B2 (en) | Simultaneous transmission and emission focused tomography | |
| US5376795A (en) | Emission-transmission imaging system using single energy and dual energy transmission and radionuclide emission data | |
| US7310404B2 (en) | Radiation CT radiographing device, radiation CT radiographing system, and radiation CT radiographing method using the same | |
| JP2001521805A (en) | Filmless digital x-ray projection imaging system and method | |
| JPS62161348A (en) | X-ray photographing method and apparatus | |
| JPS63308548A (en) | Apparatus employing electrooptic type detector for microtomography system | |
| US6005908A (en) | X-ray computed tomography apparatus with radiation detector which reduces image unsharpness | |
| US6259766B1 (en) | Computer tomography device | |
| EP0988830A2 (en) | Methods and apparatus for indirect high voltage verification in an X-ray imaging system | |
| WO1992000566A1 (en) | Partial fan beam tomographic apparatus and data reconstruction method |
Legal Events
| Date | Code | Title | Description |
|---|---|---|---|
| PUAI | Public reference made under article 153(3) epc to a published international application that has entered the european phase |
Free format text: ORIGINAL CODE: 0009012 |
|
| 17P | Request for examination filed |
Effective date: 19920313 |
|
| AK | Designated contracting states |
Kind code of ref document: A1 Designated state(s): AT BE CH DE DK ES FR GB GR IT LI LU NL SE |
|
| RBV | Designated contracting states (corrected) |
Designated state(s): DE FR GB IT |
|
| A4 | Supplementary search report drawn up and despatched |
Effective date: 19921113 |
|
| AK | Designated contracting states |
Kind code of ref document: A4 Designated state(s): AT BE CH DE DK ES FR GB GR IT LI LU NL SE |
|
| 17Q | First examination report despatched |
Effective date: 19941216 |
|
| GRAG | Despatch of communication of intention to grant |
Free format text: ORIGINAL CODE: EPIDOS AGRA |
|
| GRAG | Despatch of communication of intention to grant |
Free format text: ORIGINAL CODE: EPIDOS AGRA |
|
| GRAH | Despatch of communication of intention to grant a patent |
Free format text: ORIGINAL CODE: EPIDOS IGRA |
|
| GRAH | Despatch of communication of intention to grant a patent |
Free format text: ORIGINAL CODE: EPIDOS IGRA |
|
| GRAA | (expected) grant |
Free format text: ORIGINAL CODE: 0009210 |
|
| AK | Designated contracting states |
Kind code of ref document: B1 Designated state(s): DE FR GB IT |
|
| REF | Corresponds to: |
Ref document number: 69129008 Country of ref document: DE Date of ref document: 19980409 |
|
| ITF | It: translation for a ep patent filed |
Owner name: FUMERO BREVETTI S.N.C. |
|
| ET | Fr: translation filed | ||
| PLBE | No opposition filed within time limit |
Free format text: ORIGINAL CODE: 0009261 |
|
| STAA | Information on the status of an ep patent application or granted ep patent |
Free format text: STATUS: NO OPPOSITION FILED WITHIN TIME LIMIT |
|
| 26N | No opposition filed | ||
| REG | Reference to a national code |
Ref country code: GB Ref legal event code: IF02 |
|
| PGFP | Annual fee paid to national office [announced via postgrant information from national office to epo] |
Ref country code: GB Payment date: 20030625 Year of fee payment: 13 |
|
| PGFP | Annual fee paid to national office [announced via postgrant information from national office to epo] |
Ref country code: FR Payment date: 20030718 Year of fee payment: 13 |
|
| REG | Reference to a national code |
Ref country code: GB Ref legal event code: 732E |
|
| REG | Reference to a national code |
Ref country code: FR Ref legal event code: TP |
|
| PG25 | Lapsed in a contracting state [announced via postgrant information from national office to epo] |
Ref country code: GB Free format text: LAPSE BECAUSE OF NON-PAYMENT OF DUE FEES Effective date: 20040702 |
|
| PGFP | Annual fee paid to national office [announced via postgrant information from national office to epo] |
Ref country code: DE Payment date: 20040831 Year of fee payment: 14 |
|
| GBPC | Gb: european patent ceased through non-payment of renewal fee |
Effective date: 20040702 |
|
| PG25 | Lapsed in a contracting state [announced via postgrant information from national office to epo] |
Ref country code: FR Free format text: LAPSE BECAUSE OF NON-PAYMENT OF DUE FEES Effective date: 20050331 |
|
| REG | Reference to a national code |
Ref country code: FR Ref legal event code: ST |
|
| PG25 | Lapsed in a contracting state [announced via postgrant information from national office to epo] |
Ref country code: IT Free format text: LAPSE BECAUSE OF NON-PAYMENT OF DUE FEES;WARNING: LAPSES OF ITALIAN PATENTS WITH EFFECTIVE DATE BEFORE 2007 MAY HAVE OCCURRED AT ANY TIME BEFORE 2007. THE CORRECT EFFECTIVE DATE MAY BE DIFFERENT FROM THE ONE RECORDED. Effective date: 20050702 |
|
| PG25 | Lapsed in a contracting state [announced via postgrant information from national office to epo] |
Ref country code: DE Free format text: LAPSE BECAUSE OF NON-PAYMENT OF DUE FEES Effective date: 20060201 |