NHL Draft Pick Probabilities
Jokke Nevalainen
2020-05-16
Whenever an NHL draft is approaching, the excitement level and hype around the players go through the roof. It’s an exciting time for sure but it seems like most people don’t have realistic expectations when it comes to the draft. To help with that, I decided to look at a 10-year span of draft classes to see how many NHL players have come out of those and what are the odds of finding an NHL player in each round of the draft.
I chose draft classes from the year 2000 to the year 2009. I wanted to take the most recent draft class possible but I couldn’t take a draft class that was too recent because those players wouldn’t have had a chance to make it in the NHL, so that is why I landed on that 10-year span. I copied the draft results from www.hockey-reference.com and started playing around with the results on Excel.
During this span of time, there were NHL drafts that had nine rounds with a maximum of 291 selections but there were also drafts with seven rounds and 210 selections. Vegas didn’t have a team back then, so there were 30 teams. Because of this, I only used the first 210 selections from each draft class and ignored the rest to have comparable results.
Please notice that I’m not a mathematician or an analyst. There are a lot of people who are way more qualified to do this type of an analysis. But I love charts and I love playing around with numbers on Excel, so that’s what I did here. My goal wasn’t to create some ground-breaking analytical breakthrough but instead provide results that are easy to understand and maybe even remember.
Without further ado, let’s go through the results.
NHL players per draft class
First of all, let’s look at how many NHL players have come out of each draft. I used three thresholds. The smallest one was 100 NHL games played because I don’t think you can truly say you’ve found an NHL player if they don’t play at least 100 games in the NHL. The other thresholds were 200 and 300 games played. These were just for fun more than anything else.
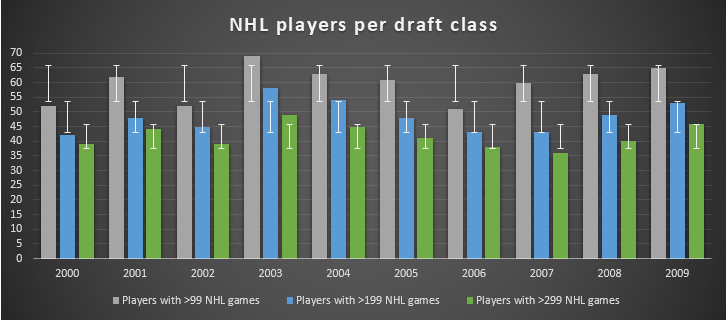
The 2003 draft class stands out as the best during this 10-year span which is no surprise because it is the one everyone uses as an example when discussing strong draft classes. The 2006 draft was arguably the worst, although there are a few draft classes that are up there amongst the worst.
There are a few individuals who could still work their way up from where they are right now but only a few, so even if we looked at these draft classes again in 10 years, there wouldn’t be much of a change here.
If you want to take something simple out of this to remember for the future, it’s that an average draft class produces about 60 NHL players (between 51 and 69), and about 40 of them (between 36 and 49) will go on to play a significant career in the NHL (at least 300 games played). Those numbers are likely lower than what most expected, and they don’t even take the quality of the player into consideration – a Hall of Fame player is worth the same as a fourth line grinder in this analysis.
NHL players per draft round
So from the total of 2,100 draft selections in my sample, 598 players played at least 100 games in the NHL. Next, I decided to see on which round those 598 players were drafted.
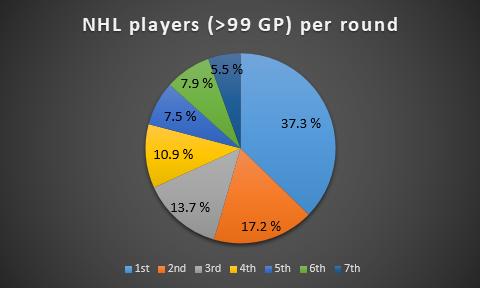
Nothing overly surprising here. Over two thirds of the NHL players were drafted in the first three round, with the first round dominating all others. All of that is to be expected based on the format of the draft. But it’s good to remember that all rounds of the draft have produced NHL players, and obviously some have even gone undrafted and still become NHL players. So even though the odds clearly favor those drafted early, it doesn’t close any doors.
Probabilities per draft round
Next, let’s see what’s the success rate on each round of the draft.
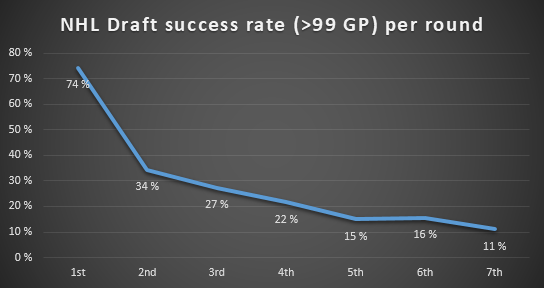
This is where things start to get interesting (although you could have guessed it from the previous chart already). 74 per cent of first round picks go on to become NHL players but for the second round, that number is only 34 per cent. That’s a massive drop-off between the top two rounds.
Let’s try another approach and look at each individual draft spot.

The results here are more of less the same. The individual success rate of each draft spot is shown in grey in the background, and a logarithmic trend line is shown in blue to get a better picture of the probabilities all the way from pick one to pick 210.
There is obviously a big drop-off from pick one to 31 but the drop-off between 31 and 61 is quite significant as well, especially compared to the drop-off from 61 to 91.
Focusing on the top two rounds
That drop-off from first to second round was so interesting that I decided to dig a little deeper into it.
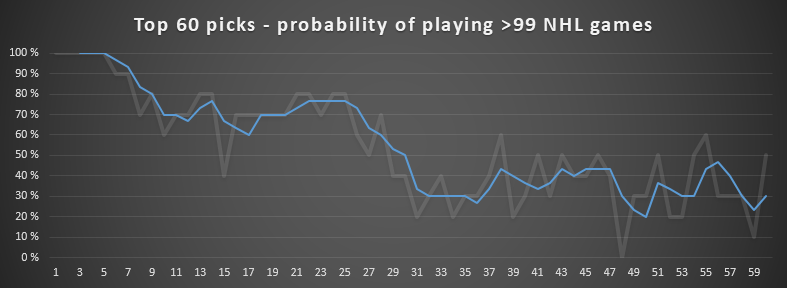
This chart focuses on the first two rounds. Similarly to the previous one, the success rate of each individual draft spot is shown in grey in the background. But this time, I decided to use a moving three-point average as the trend line (in blue). As you can see from here, the success rate drops massively from pick 25 to pick 31, and then it stays at a similar level for the entire second round. I’m not sure what’s the reason for that drop-off but it’s clear as day.
Another interesting thing I noticed while going through the data is that all top five picks during that span of 10 years made it to the NHL with at least 100 games played. This is not surprising because the top picks are scouted very heavily and teams will also give them every possible opportunity to succeed because they’ve spent such a valuable asset to get them. So even if they’re not good, they’ll probably get 100 NHL games just to make sure. Alexander Svitov (third overall by Tampa in 2001) trails the group with 179 NHL games.
Picks six and seven are pretty safe as well, with only Lars Johnsson (seventh overall by Boston in 2000) and Nikita Filatov (sixth overall by Columbus in 2008) not reaching the 100 games played threshold. But the odds start to decrease from there.
The 15th overall selection has been the unluckiest by far with only four out of 10 players selected in that spot reaching the 100 game threshold. The seven picks before and after the 15th overall selection have all resulted in at least six NHL players with most of them resulting in seven or eight. That’s an interesting anomaly, and I can’t really explain that one either.
Another interesting anomaly is pick number 48. Zero players have reached 100 NHL games. Only two out of ten have even played in the NHL, and they have a total of 29 NHL games combined. That pick is just cursed.
Simplified NHL Draft probabilities
If you want simplified, easy-to-remember probabilities for the NHL Draft – adjusted to current day when we have 31 teams in the NHL – you’re in luck because I created those based on the results of this analysis.
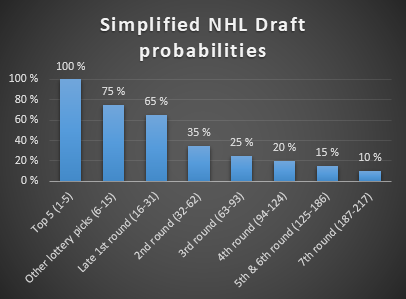
The drafts between 2000 and 2009 produced an average of 59.8 NHL players. Obviously that was with 30 teams and 210 picks but adding another seven picks to the end doesn’t really change that. These odds would produce 60 NHL players, so that’s right on the money.
Guesstimated probabilities for the 2020 NHL Draft
Based on all the information I’ve gathered about the 2020 NHL Draft and all the information I learned from this analysis, here’s my best guess for 2020 NHL Draft probabilities.
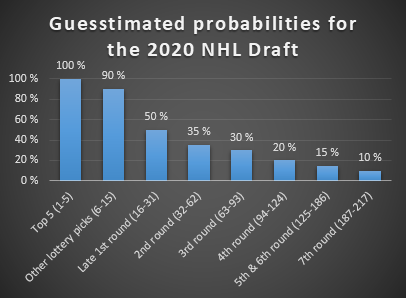
The strength of the 2020 NHL Draft is in the top 15, so I increased the odds in that range – but I’m still leaving room for one top 15 pick not to make it to the NHL. The weakness of this draft class is the second half of the first round, so I decreased odds in that range – instead of 10 NHL players from that 16-31 range, there would be just eight now.
But there’s a good amount of depth in this draft class, so I increased the third round odds so that there would be nine players coming out of that range instead of eight. Once again, these odds would result in 60 NHL players coming out of this draft class which is the average.
Final thoughts
Obviously it’s possible that NHL teams have gotten better at evaluating draft-eligible prospects over the past 10 years. But unfortunately, we don’t truly know that until 10 or 15 years from now.
It is also good to remember that each draft class in unique but it does seem like they stay relatively close to the average year after year. Even though the players at the top may vary greatly from one year to another, the draft class as a whole remains relatively similar.
Feel free to use all of this information in your quest to take over the world – or win in your fantasy hockey league, whichever seems more important. But please remember that this analysis focused purely on NHL games played. I wouldn’t recommend trading a second round pick for fourth and sixth round picks. Even though the odds of finding an NHL player are pretty much the same, you can probably find better quality in the second round. But trading a second round pick for two third round picks may not be so crazy.
*
And that’s all for now, thanks for reading. Remember to follow me on Twitter @JokkeNevalainen.
Main picture courtesy of NHL.com
LATEST PROFILE UPDATES
LATEST RADIO & DRAFTCASTS
Dobber’s DraftCast S2E8: Atlantic Division Prospects with a chance to make the roster
On this episode: Pat is joined by Ben to discuss prospects in the Atlantic Division who have a chance to make the roster to start, have cups of coffee, or may be up after the trade deadline. This talk is to help fantasy hockey GMs decide on prospects to add, watch or invest in for […]
Dobber’s DraftCast S2E7: Metro Division Prospects with a chance to make the roster
On this episode: Pat is joined by Ben to discuss prospects in the Metro Division who have a chance to make the roster to start, have cups of coffee, or may be up after the trade deadline. This talk is to help fantasy hockey GMs decide on prospects to add, watch or invest in for […]
Dobber’s DraftCast S2E6: Central Division Prospects with a chance to make the roster
On this episode: Pat is joined by Ben to discuss prospects in the Central Division who have a chance to make the roster to start, have cups of coffee, or may be up after the trade deadline. This talk is to help fantasy hockey GMs decide on prospects to add, watch or invest in for […]