Management Implications for Skates and Rays Based on Analysis of Life History Parameters
 Kwang-Ming Liu
 Ya-Wen Huang1
 - 1Institute of Marine Affairs and Resource Management, National Taiwan Ocean University, Keelung, Taiwan
- 2George Chen Shark Research Center, National Taiwan Ocean University, Keelung, Taiwan
- 3Center of Excellence for the Oceans, National Taiwan Ocean University, Keelung, Taiwan
- 4Marine Studies Section, Center for Environment and Water, Research Institute, King Fahd University of Petroleum and Minerals, Dhahran, Saudi Arabia
The life history (age and growth and reproduction) parameters of 35 species (41 stocks) of skates and rays were analyzed using multivariate analyses. Three groups were categorized by cluster analysis (CA) based on principal component scores. Empirical equation was developed for each group to describe the relationships between the predicted a finite rate of population increase (λ′) and the life history parameters: growth coefficient (k), asymptotic length (L∞), age at maturity (Tm), annual fecundity (f/Rc), ratio between size at birth (Lb), and L∞ (Lb/L∞), and ratio between size at maturity (Lm) and L∞ (Lm/L∞). Group 1 included species with slow growth rates (k < 0.011 year–1), early maturity (Lm/L∞ < 0.62), and extended longevity (Tmax > 25 years); Group 2 included species with intermediate growth rates (0.080 year–1 < k < 0.190 year–1), intermediate longevity (17 years < Tmax < 35 years), and late maturity (Lm/L∞ > 0.60); Group 3 included species with a fast growth rate (k > 0.160 year–1), short longevity (Tmax < 23 years), and large size at birth (Lb/L∞ > 0.18). The λ′ values estimated by these empirical equations showed good agreement with those calculated using conventional demographic analysis, suggesting that this approach can be applied in the implementation of management measures for data-limited skates and rays in a precautionary manner.
Introduction
Many batoids, similar to sharks, have the life history characteristics of slow growth, late maturity, and low numbers of offspring (Ebert and Sulikowski, 2009). Excluding manta rays and butterfly rays, most skates and rays inhabit coastal demersal waters and play an important role in the demersal ecosystem (Ebert and Bizzarro, 2007). These skates and rays are vulnerable to anthropogenic pressure and may decline or collapse after experiencing heavy fishing pressure (Hoff and Musick, 1990; Musick, 1999).
The global landings of skates and rays reported to the United Nations Food and Agriculture Organization (FAO) declined almost 20% from 2003 to 2012 (Davidson et al., 2016). Recent assessments of global oceanic rays suggested that several species have been overexploited or have even collapsed (Pacoureau et al., 2021). With the increase in skate and ray catches, it is necessary to develop management plans of these species to ensure sustainable use of these resources (Dulvy and Reynolds, 2002). However, the development of fishery management plans for skates and rays is difficult due to the lack of detailed biological information and species-specific catch data (Stevens et al., 2000) because most of them are of low economic value. The decline of large skates coupling with an increase in the abundance of small skates in the northeast Atlantic resulted in a structural change in the marine ecosystem (Dulvy et al., 2000). These results clearly indicated that species-specific stock status information is urgently needed to ensure the sustainable utilization of skate and ray stocks.
According to the International Union for Conservation of Nature (IUCN) red list criteria, 10% of chondrichthyes fall in the category threatened (including critical endangered, endangered, and vulnerable), of which 40% are sharks and 60% are skates and rays. The Convention on International Trade in Endangered Species of Wild Fauna and Flora (CITES) has placed the sawfishes on its Appendix I list (Anon., 2013) and the manta rays and the devil rays Mobula spp. (Anon., 2016) and the guitarfish Rhinobatidae and wedgefish Rhinidae (Anon., 2019) on its Appendix II list. The aforementioned measures highlighted the urgency of conservation and management of skates and rays.
Size and life history parameters of skates and rays vary in wide range. The maximum size ranges from 10-cm total length (TL) for the short-nose electric ray Narcine laticaudus (Froese and Pauly, 2015) to 910 cm disc width (DW) for the manta ray Mobula birostris (White et al., 2006). Growth coefficient (k) ranges from 0.04 year–1 for the big skate Beringraja binoculata (McFarlane and King, 2006) to 0.454 year–1 for the starry skate Raja asterias (Serena et al., 2005). The litter size varies remarkably among species even for those falling within the same reproductive mode (oviparity, viviparity, or aplacental viviparity). For example, the fecundity of oviparous stocks ranged from 8 for the roughtail skate Bathyraja trachura (Ebert, 2005) to 360 for the big skate (Ebert and Davis, 2007).
The catch, effort, and bycatch data for most skates and rays are lacking because they are usually discarded or treated as trash fish that have low commercial value. Consequently, conventional models commonly used in stock assessment for teleost fish, such as surplus production and stock-recruitment models, have seldom been used in examining the stock status of skates and rays despite multispecies skate and ray fisheries including three species of Bathyraja spp. and Raja flavirostris in Falkland Islands (Agnew et al., 2000). Instead, yield per recruit and spawning stock biomass per recruit models have been applied to the little skate Leucoraja erinacea (Waring, 1984) and the longnose skate Raja rhina (Gertseva, 2009), respectively. In addition, demographic models, which have been applied to sharks, have been successfully applied to describe the population dynamics of the little skate, the winter skate Leucoraja ocellata, the barndoor skate Dipturus laevis (Frisk et al., 2002), and five deep-water Bering Sea skates Bathyraja spp. (Barnett et al., 2013). However, detailed information on life history parameters including natural mortality, age at maturity, litter size, reproductive cycle, and longevity is needed in this approach. Therefore, these models are difficult to be applied to the species with limited life history information (King and McFarlane, 2003). Hence, it is urgent to develop an alternate way to estimate the finite rates of population increase for skates and rays based on life history parameters to ensure the sustainability of skate and ray stocks.
Multivariate analyses including principal component analysis (PCA), cluster analysis (CA), and regression analysis have been used in marine fish management by various authors (Winemiller and Rose, 1992; Jennings et al., 1999; Cortés, 2000; Frisk et al., 2001; King and McFarlane, 2003). Cortés (2000) identified three life history strategies of sharks based on five life history parameters of 34 species (40 stocks) by using PCA and CA. Liu et al. (2015) also categorized three groups using similar methods and developed empirical equation for each group based on six life history parameters of 38 species (62 stocks) of sharks to estimate their finite rate of population increase. However, none of aforementioned studies has provided an empirical equation to estimate the finite rate of population increase for skates and rays.
Hence, the present study aims to categorize the life history strategies of skates and rays based on their life history parameters using multivariate analysis, to develop empirical equations to estimate the finite rate of population increase, and to propose appropriate management measures for each group. For those skates and rays without detailed life history parameters, they can be classified into one group based on similar species identified in this study, and then provisional management actions can be taken in a precautionary way.
Materials and Methods
Intensive search of the existing literature including scientific journals, reports, and gray literature using keywords of skates, rays, age and growth, and reproduction was used to collect life history parameter data for skates and rays. Only stocks with both age and growth and reproduction information available were included in the analysis.
As conventional demographic analysis assumes that males are not the limiting factors regulating population growth, this study used data only from females. Where sex-specific parameters were not available, sex-combined parameters were used. In total, 12 life history parameters were selected. These included five age and growth parameters [i.e., asymptotic length (L∞), growth coefficient (k), age at zero length (t0), maximum age (Tmax), and maximum observed length (Lmax)] and seven reproduction parameters [i.e., age at maturity (Tm), reproductive strategy (R), size at maturity (Lm), size at birth (Lb), fecundity/litter size (f), gestation period (Gp), and reproductive cycle (Rc)]. Different studies define life history parameters in slightly different ways. To account for this inconsistency, we used the following definitions.
Reproduction Parameters
1. Reproductive strategy (R): oviparity (O), viviparity (V), and aplacental viviparity (OV).
2. Fecundity/litter size (f): the mean litter size of pregnant females, the mean of the maximum and minimum of litter sizes, or the mature eggs assuming all were fertilized.
3. Size at maturity (Lm or DWm): size (TL or DW) at first maturity, size at 50% maturity, mean size of mature specimens, or the estimated size at maturity by substituting the age at maturity into the growth equation. Several studies used different terminologies; however, based on their description, they were referring to size at 50% maturity.
4. Reproduction cycle (Rc): including gestation and resting periods, if only gestation information was available, Rc was estimated using the value from similar species.
5. Size at birth (Lb or DWb): size of the smallest free swimmer, the mean of the size range at birth, or the mean of the largest full term embryo and the smallest free swimmer.
Age and Growth Parameters
(1) Maximum observed size (Lmax): the maximum size of observed skates and rays.
(2) Maximum age (longevity) (Tmax): the maximum age was estimated from Ricker’s (1979) equation, which was 95% of L∞ as follow: Tmax = 2.77/k.
(3) Asymptotic length (L∞ or DW∞) and growth coefficient (k) from growth equations.
(4) Age at maturity (Tm): the age at 50% maturity, or the mean age of mature specimens or the mean of the maximum and minimum age at maturity if only the range of age at maturity was available.
Input Parameters
Large variations in Lb, Lm, and L∞ were found between different species (Supplementary Table 1), and this may affect the results of the analysis. To eliminate the size effect in the analysis, six life history input parameters, namely, the ratio between size at birth and asymptotic length (Lb/L∞), the ratio between size at maturity and asymptotic length (Lm/L∞), Tmax, Tm, k, and annual fecundity (f/Rc), were used in the analysis.
Habitat Information
To examine the life history strategy associated with the habitat of skates and rays, habitat information including the water depth of habitat (Dep), sea surface temperature (SST), and salinity (Sal) were collected from the literature for the blue stingray Dasyatis chrysonota in the South Africa (Cowley, 1997; Ebert and Cowley, 2008), the diamond stingray Hypanus dipterura in the western Mexico (Mariano-Melendéz, 1997; Smith, 2005; Smith et al., 2007), the western shovelnose stingaree in the western Australia (White et al., 2002), the masked stingaree Trygonoptera personata in the western Australia (White et al., 2002), lobed stingaree Urobatis lobatus in the lower western coast of Australia (White et al., 2001), yellownose skate Dipturus chilensis (Fuentealba and Leible, 1990; Licandeo et al., 2006), and sharpspine skate in the northeastern waters off Taiwan (Chang, 2006; Joung et al., 2011). The habitat information for other species was adopted from the Fish Base (Froese and Pauly, 2015). The habitat information was treated as category variable, as follows: SST, (1) 0–10°C, (2) 10–20°C, and (3) > 20°C; depth, (1) < 50, (2) 50–200, and (3) > 200 m; salinity, (1) 30–33, (2) 33–36, and (3) > 36 psu (Supplementary Table 1).
Demographic Analysis
Conventional demographic analysis requires an input of natural mortality (M) to calculate demographic parameters. Thus, Hoenig (1983) equation was used to estimate the mean M for each stock depending on the longevity, as follows: ln(M) = ln(Z) = 1.46 − 1.01 × ln(tmax) or M = −ln(0.01)/tmax (Cortés, 1998), where Z is total mortality. Natural mortality approaches Z when the fish stock is unfished or at light exploitation levels. Krebs (1985) formula was used to calculate demographic parameters, assuming a sex ratio of 1:1 for the embryos and the population was in equilibrium condition , and the parameters were calculated as follows: , , , λ=er, tx2 = ln(2)/r.
where R0 is the net reproductive value per generation, x is the age, tmax is the maximum age, mx is the fecundity of age x, lx is the survival rate until age x, G is the generation time, r is the intrinsic rate of population growth, λ is the finite rate of population increase, and tx2 is the theoretical population doubling or halving time.
Multivariate Analysis
Due to inconsistencies in measurement units, our PCA used correlation matrices, R, rather than variance–covariance matrices. All parameters were log-transformed and normalized, and the eigenvectors and eigenvalues were estimated. A nonparametric multiple dimensional scaling (NMDS) was used to draw the bi-plot. Life history parameters were reduced to several independent principal components, and the scores of principal components were then analyzed using the CA.
The CA with hierarchical Ward’s method was used to estimate the scores of the first to third principal components and to draw the tree plot. Species with similar parameter values were grouped together and named according to their shared life history traits. After grouping, the general linear model (GLM) was used to develop an empirical equation for each group to describe the relationship between λ′ and life history parameters. A variance inflation factor (VIF) (Wooldridge, 2009) was used to examine the multicollinearity of life history parameters in regression models. Multicollinearity exists among life history parameters when VIF ≥ 10, and the parameter is removed from the regression model. The best model was selected using the stepwise Akaike information criterion (AIC; Akaike, 1974) method (Venables and Ripley, 2002).
Correlation of Life History Strategy and Habitat
After life history strategy group was identified by using CA, the scores of the first two principal components were plotted, and the life history strategy associated with the habitat information (Dep, SST, and Sal) for each group was examined.
Results
In total, life history parameters of 35 species of skates and rays (41 stocks), comprising four orders (Myliobatiformes, Rajiformes, Rhinopristiformes, and Torpediniformes) and seven families, were collected (Supplementary Tables 1,2).
Life History Parameters
Age and Growth
The Lmax of 35 species (41 stocks) ranged from the minimum of 53.9 and 54.0-cm TL for the sharpspine skate and little skate (Waring, 1984; Joung et al., 2011) to the maximum of 235.0-cm TL for the blue skate Dipturus batis (Du buit, 1977) with a median of 103.4-cm TL. For age and growth parameters, the minimum L∞ was 52.7-cm TL for little skate (Waring, 1984), and the maximum L∞ was 293.5-cm TL for the big skate (McFarlane and King, 2006) with a median of 125.8-cm TL. The k value ranged from the minimum of 0.040 year–1 for the big skate (McFarlane and King, 2006) to the maximum of 0.454 year–1 for the starry skate (Serena et al., 2005), with a median of 0.112 year–1 (Supplementary Table 1).
Reproductive Parameters
Among the stocks collected for this study, 23 stocks are oviparity, four stocks are aplacental viviparity, and 14 stocks are viviparity. The fecundity of oviparous stocks ranged from 8 for the roughtail skate and the sandpaper skate Bathyraja interrupta (Ebert, 2005) to 360 for the big skate (Ebert and Davis, 2007) with a median of 40. For viviparous stocks, the fecundity ranged from 1 for the cownose ray Rhinoptera bonasus (Smith and Merriner, 1986), the western shovelnose stingaree, and the masked stingaree (White et al., 2002) to 5 for pelagic stingray (Hemida et al., 2003) with a median of 3. The fecundity of aplacental viviparous stocks ranged from 5 for the southern fiddle ray Trygonorrhina fasciata (Marshall et al., 2007) to 17 for the Pacific electric ray (Neer and Cailliet, 2001). Among those 18 stocks where their gestation periods have been documented, 15 stocks have 1-year gestation period, the Pacific electric ray has 2.5-year gestation period (Neer and Cailliet, 2001), and the diamond stingray and round stingray have 0.5-year gestation period (Babel, 1967; Hemida et al., 2003) (Supplementary Table 1). For those species without gestation period information, gestation period or Rc was estimated using the value from similar species or assumed to be 1 year.
The Ratios of Lb/L∞ and Lm/L∞
The Lb/L∞ ratios of the 35 species (41 stocks) ranged from 0.083 to 0.483, with a median value of 0.165. The maximum value of Lb/L∞ was 0.483 for the white-spotted stingaree (White and Potter, 2005), and the minimum value was 0.083 for big skate (McFarlane and King, 2006) with a median of 0.165. In total, 26 stocks (63.41%) ranged from 0.102 to 0.200, five stocks (12.20%) ranged from 0.083 to 0.093, and 10 stocks ranged from 0.211 to 0.483 (24.39%) (Supplementary Table 2).
The Lm/L∞ ratios ranged from 0.307 to 0.855, with a median value of 0.641. The maximum value of Lm/L∞ was 0.855 for the white-spotted stingaree in southwestern Australia (White and Potter, 2005), and the minimum value was 0.307 for the big skate (McFarlane and King, 2006). In total, 35 stocks (85.37%) ranged from 0.505 to 0.855, and six stocks (14.93%) ranged from 0.307 to 0.50 (Supplementary Table 2).
Maximum Age and Natural Mortality
The maximum ages tmax estimated from Ricker’s (1979) equation ranged from 7 years for the starry skate R. asterias (Serena et al., 2005) to 74 years for the big skate (McFarlane and King, 2006) with a median of 25 years (Table 1).
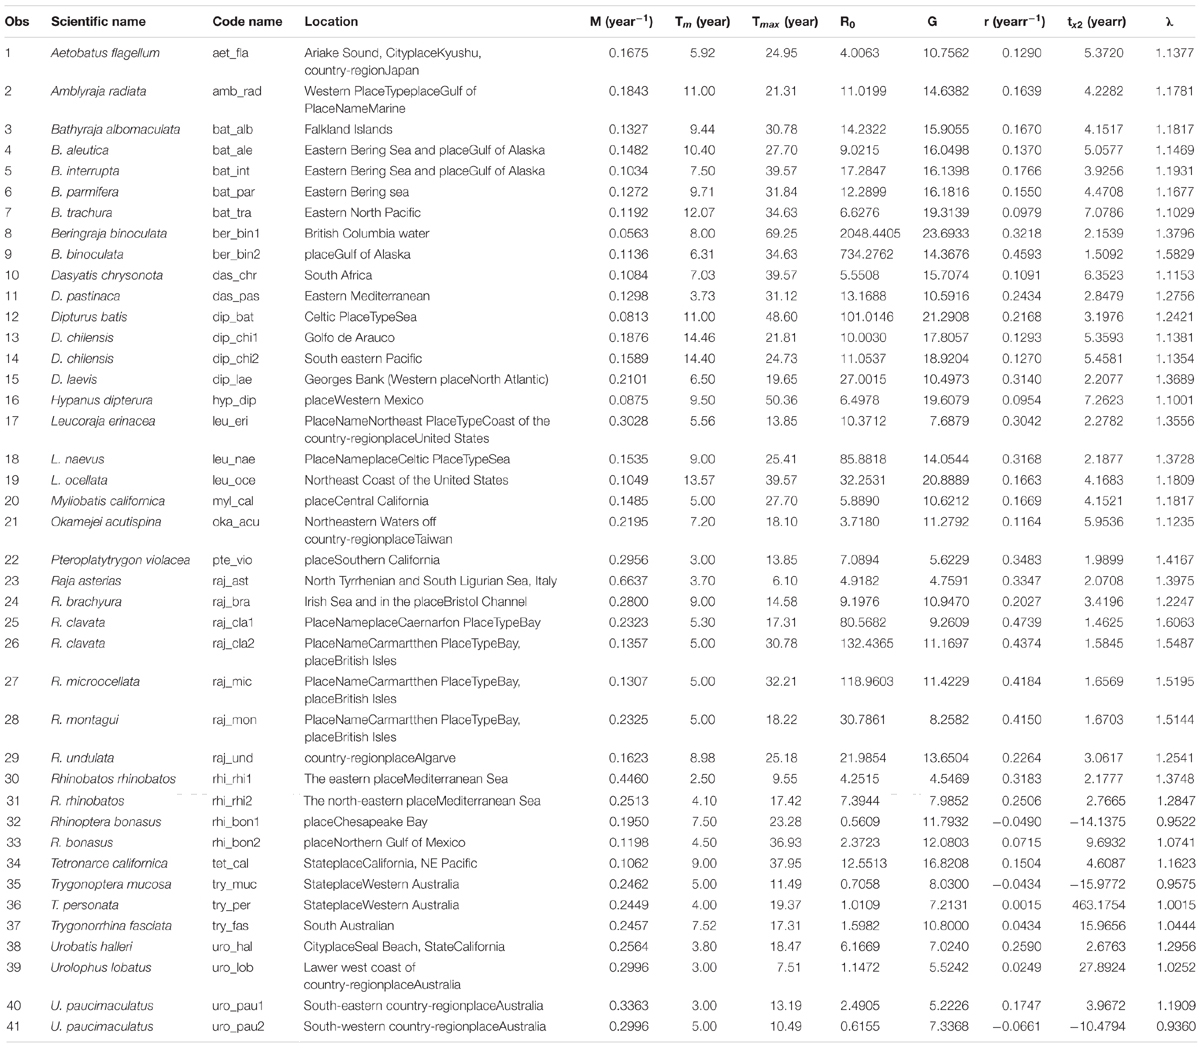
Table 1. Estimated demographic parameters based on conventional demographic approach for the 41 stocks (35 species) of skates and rays.
Finite Rate of Population Increase
The finite rate of population increase estimated from conventional demographic analysis ranged from 0.936 for the white-spotted skate to 1.606 for the thornback ray Raja clavata. Thirty-two of 41 stocks (78.1%) fell in the range 1.002–1.398, six stocks (14.6%) had values in the range 1.417–1.606, and three stocks (7.3%) had values lower than 1.0 (Table 1).
Multivariate Analyses
Correlation Between Life History Parameters
Significant negative relationships were found for the tmax and k (r = −0.973, p < 0.01, n = 41), suggesting that the larger the tmax, the slower the growth. Similar relationships were also found for annual fecundity (litter size) and Lb/L∞ (r = −0.818, p < 0.01) as well as tmat and k (r = −0.591, p < 0.01) (Table 2), suggesting that the more the annual fecundity, the less the value of Lb/L∞ and the earlier the fast growth species mature. Significant positive correlation was also found between tmax and tmat, suggesting that the species with longer longevity mature late.
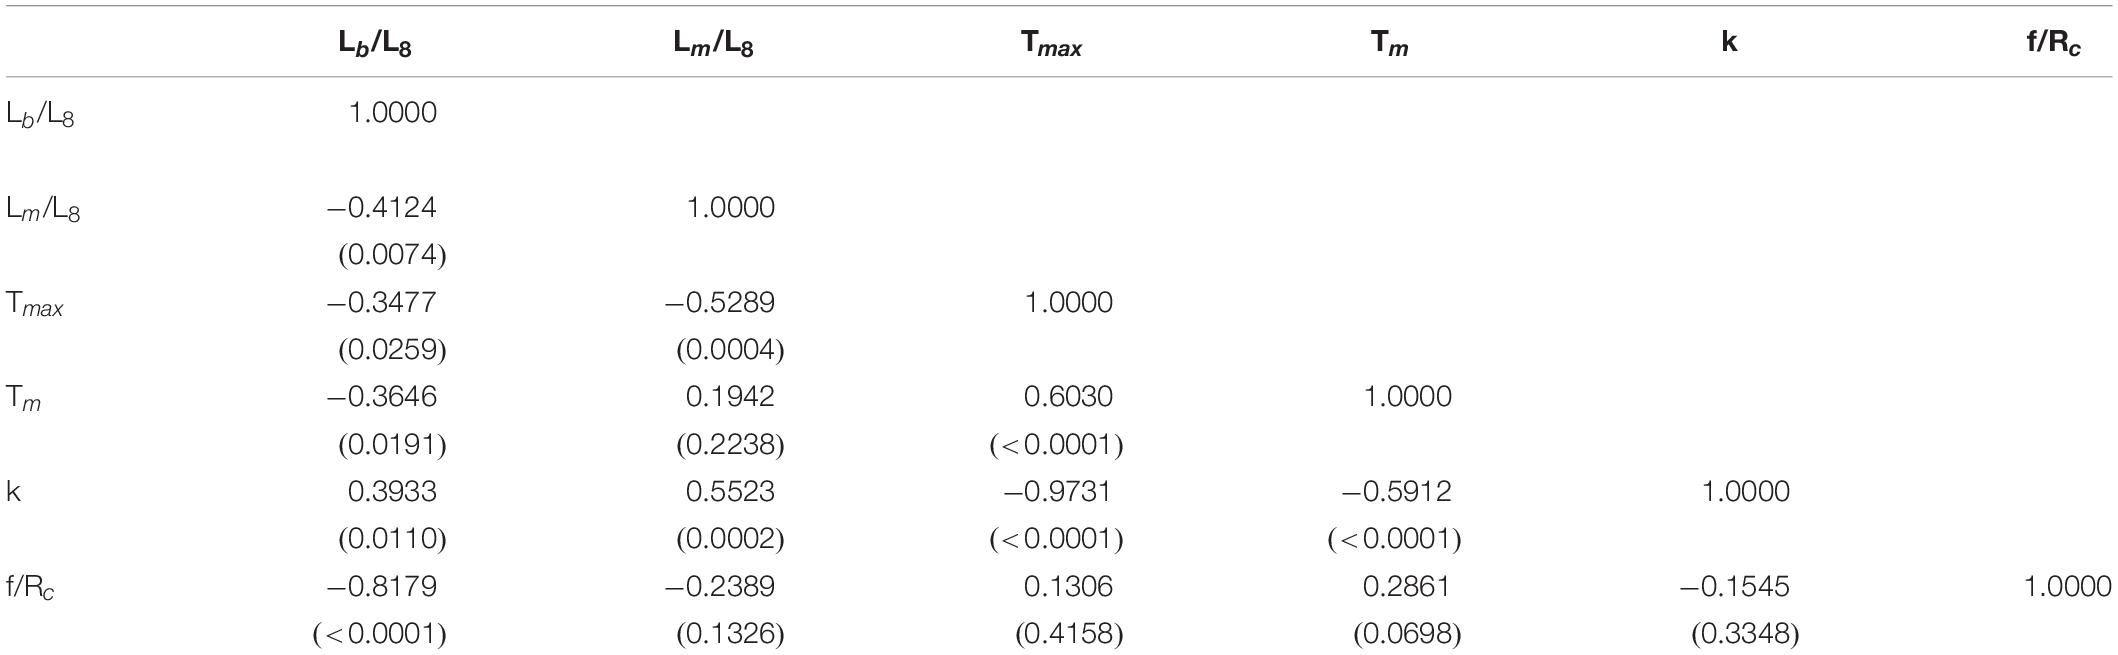
Table 2. Correlation between life history parameters of skates and rays used in this study (parentheses indicate p-value).
Principal Component Analysis
Results of PCA revealed that the top three principal components can explain 96.2% of the variations, of which 52.6, 23.7, and 19.9% of the variations can be explained the first, second, and third components (PC1, PC2, and PC3), respectively. The loadings of PC are the correlations of life history parameters and PC. The life history parameters in PC1 includes Lb/L∞ (r = 0.732), Lm/L∞(r = 0.589), k (r = 0.895), Tmax (r = −0.878), and Tm (r = −0.635); PC2 includes Lb/L∞ (r = 0.619), and f/Rc (r = −0.789); and PC3 includes Lm/L∞ (r = 0.796) and Tm (r = 0.738).
The scatter plot of scores of PC1 and PC2 showed that the positive scores to PC1 represent species with large k and small Tmax, such as the starry skate and little skate; the negative scores to PC1 represent species with slow growth and large Tmax, such as the big skate and blue skate. For PC2, the positive scores represent species with large Lb, and small litter size (fecundity) such as western shovelnose stingray and the masked stingaree; the negative scores represent species with small Lb, and large litter size (fecundity) such as thornback ray and thorny skate. The scatter plot of scores of PC1 and PC3 showed that the positive scores to PC3 represent late maturing species, such as the barndoor skate and white-spotted skate; the negative scores to PC3 represent early maturing species, such as the common stingray Dasyatis pastinaca and longheaded eagle ray Aetobatus flagellum.
Cluster Analysis and Empirical Equations
Three groups were identified by using the CA with hierarchical Ward’s method (Figure 1), and the box plots of six life history parameters by group are shown in Figure 2. The three groups categorized by the CA were clearly separated by PC1 and PC2 (Figure 3). As there was a high negative correlation between Tmax and k, and VIF indicated a multicollinearity for these two parameters, Tmax was excluded in empirical equation development.
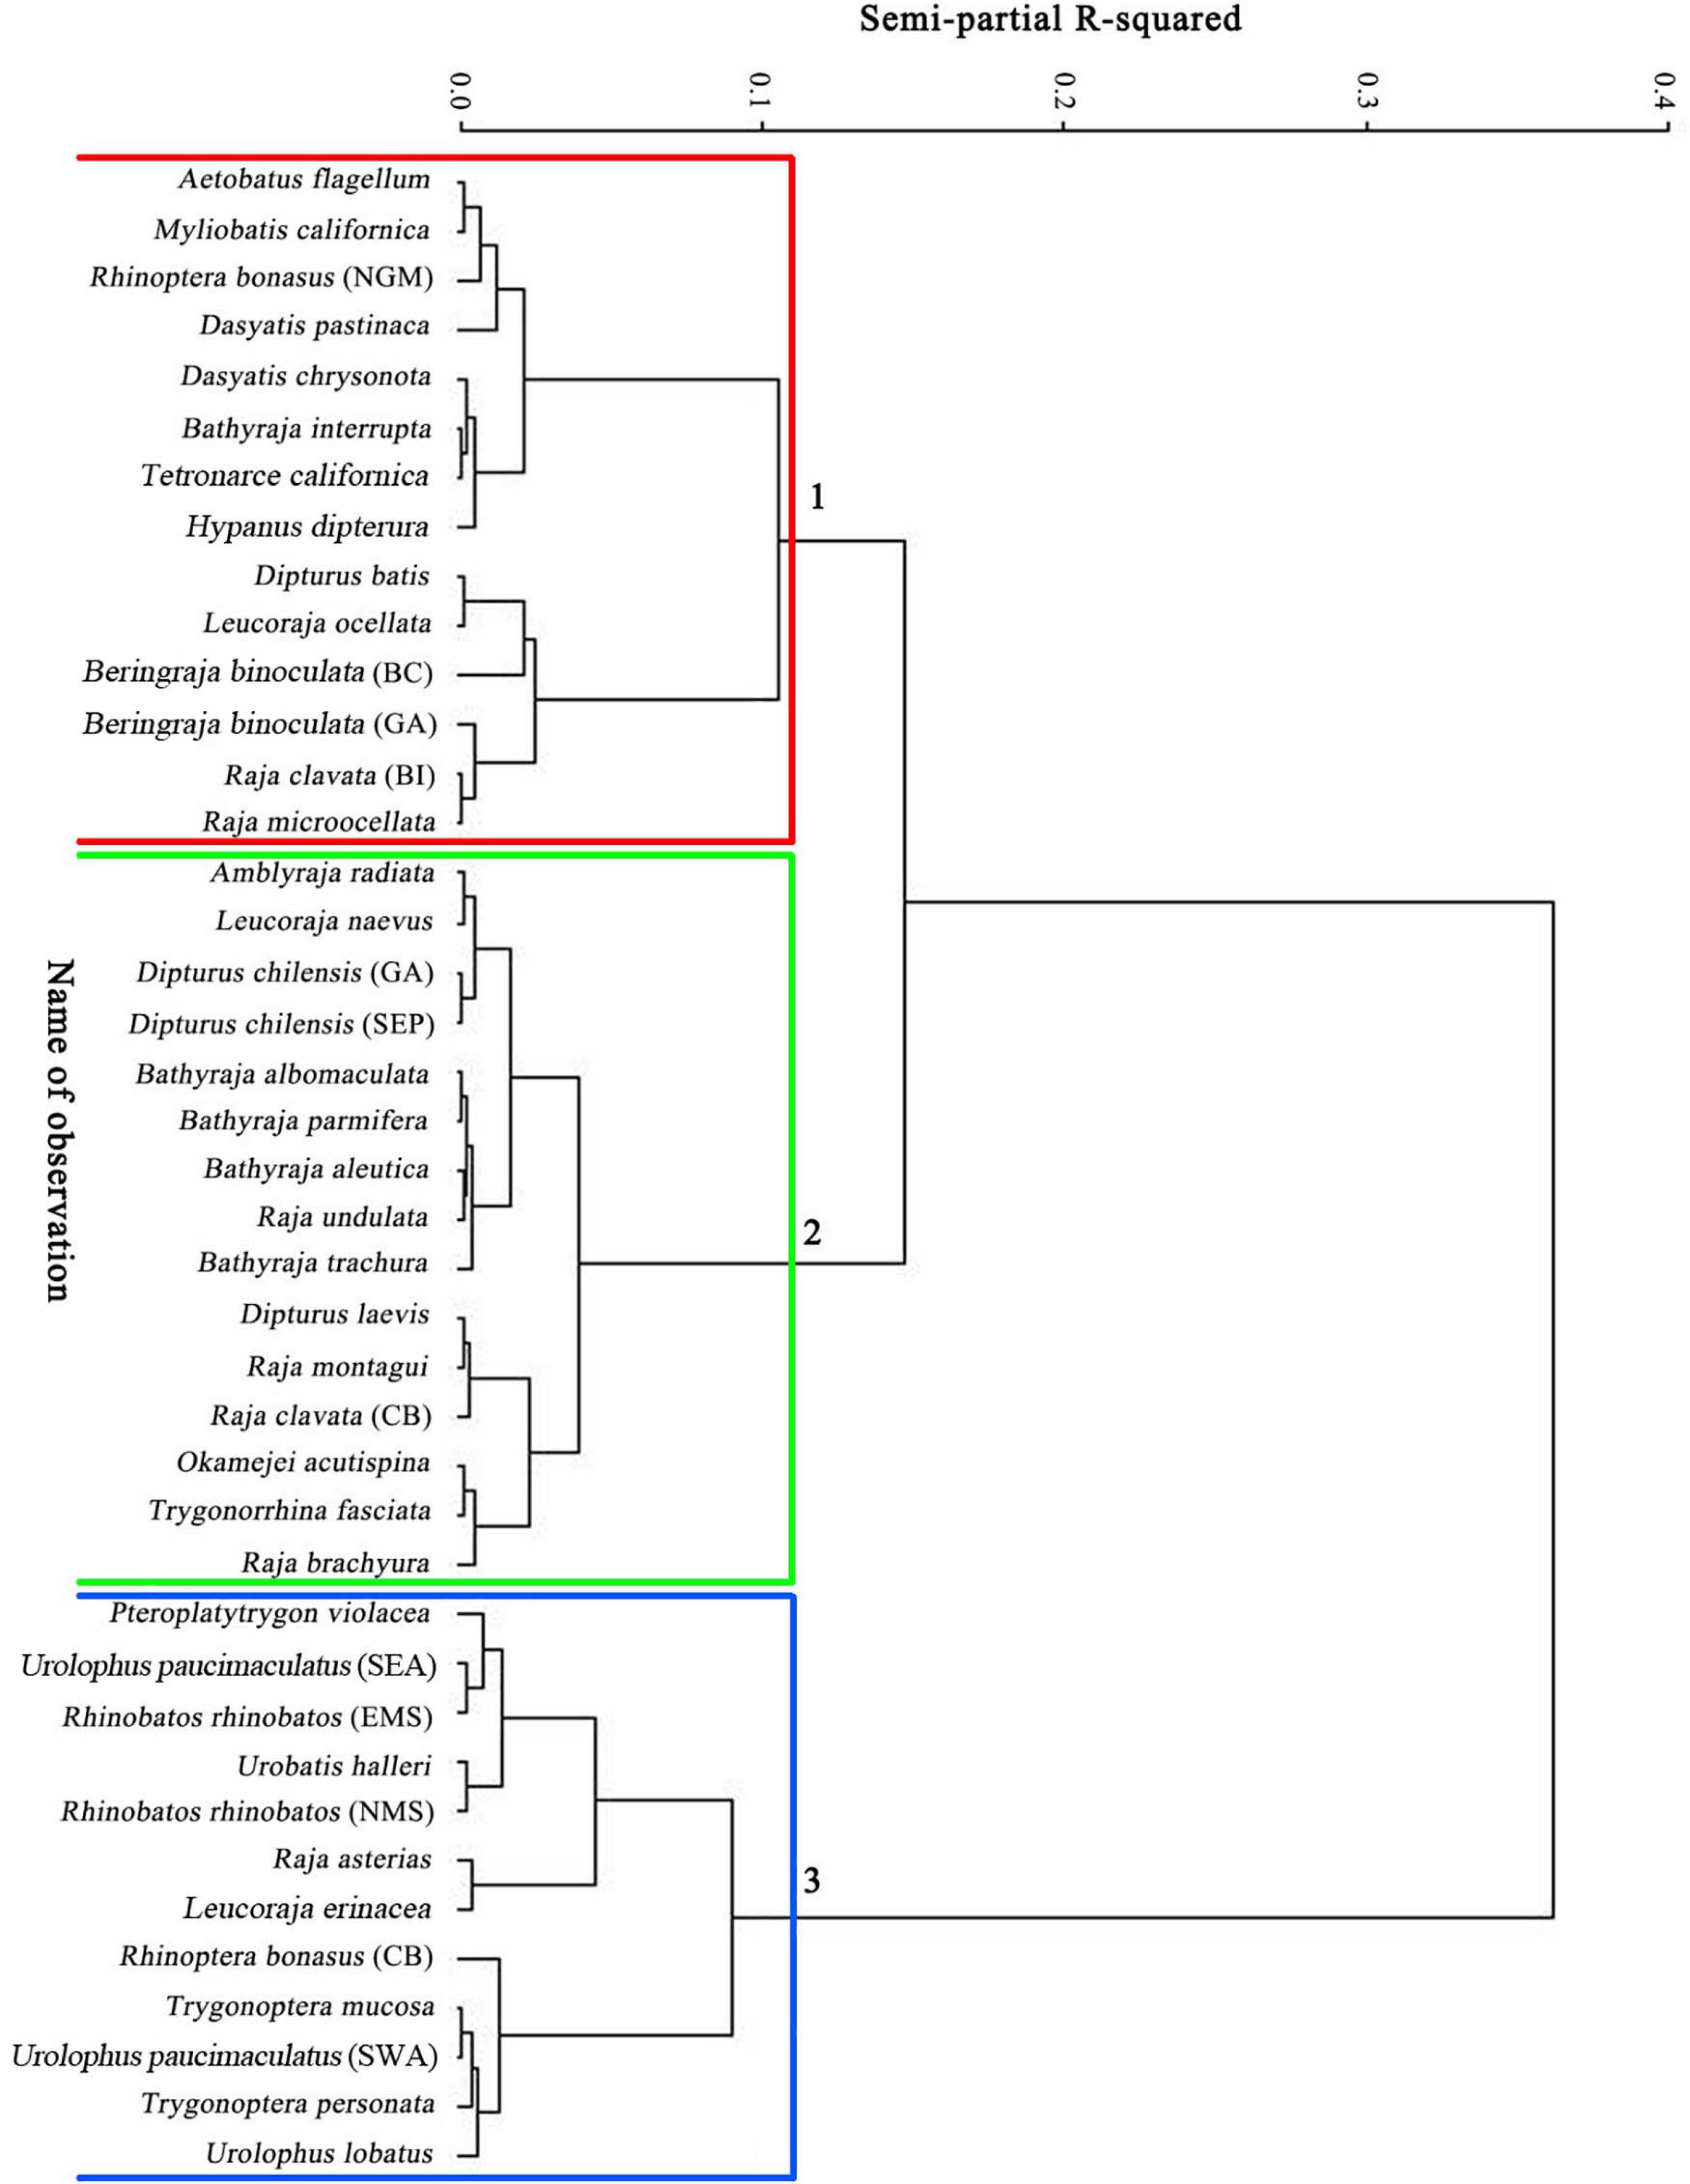
Figure 1. Dendrogram from a cluster analysis of six life history parameters of 41 stocks from 35 species of skates and rays. The grouping shows similarities in life history traits among species and stocks.
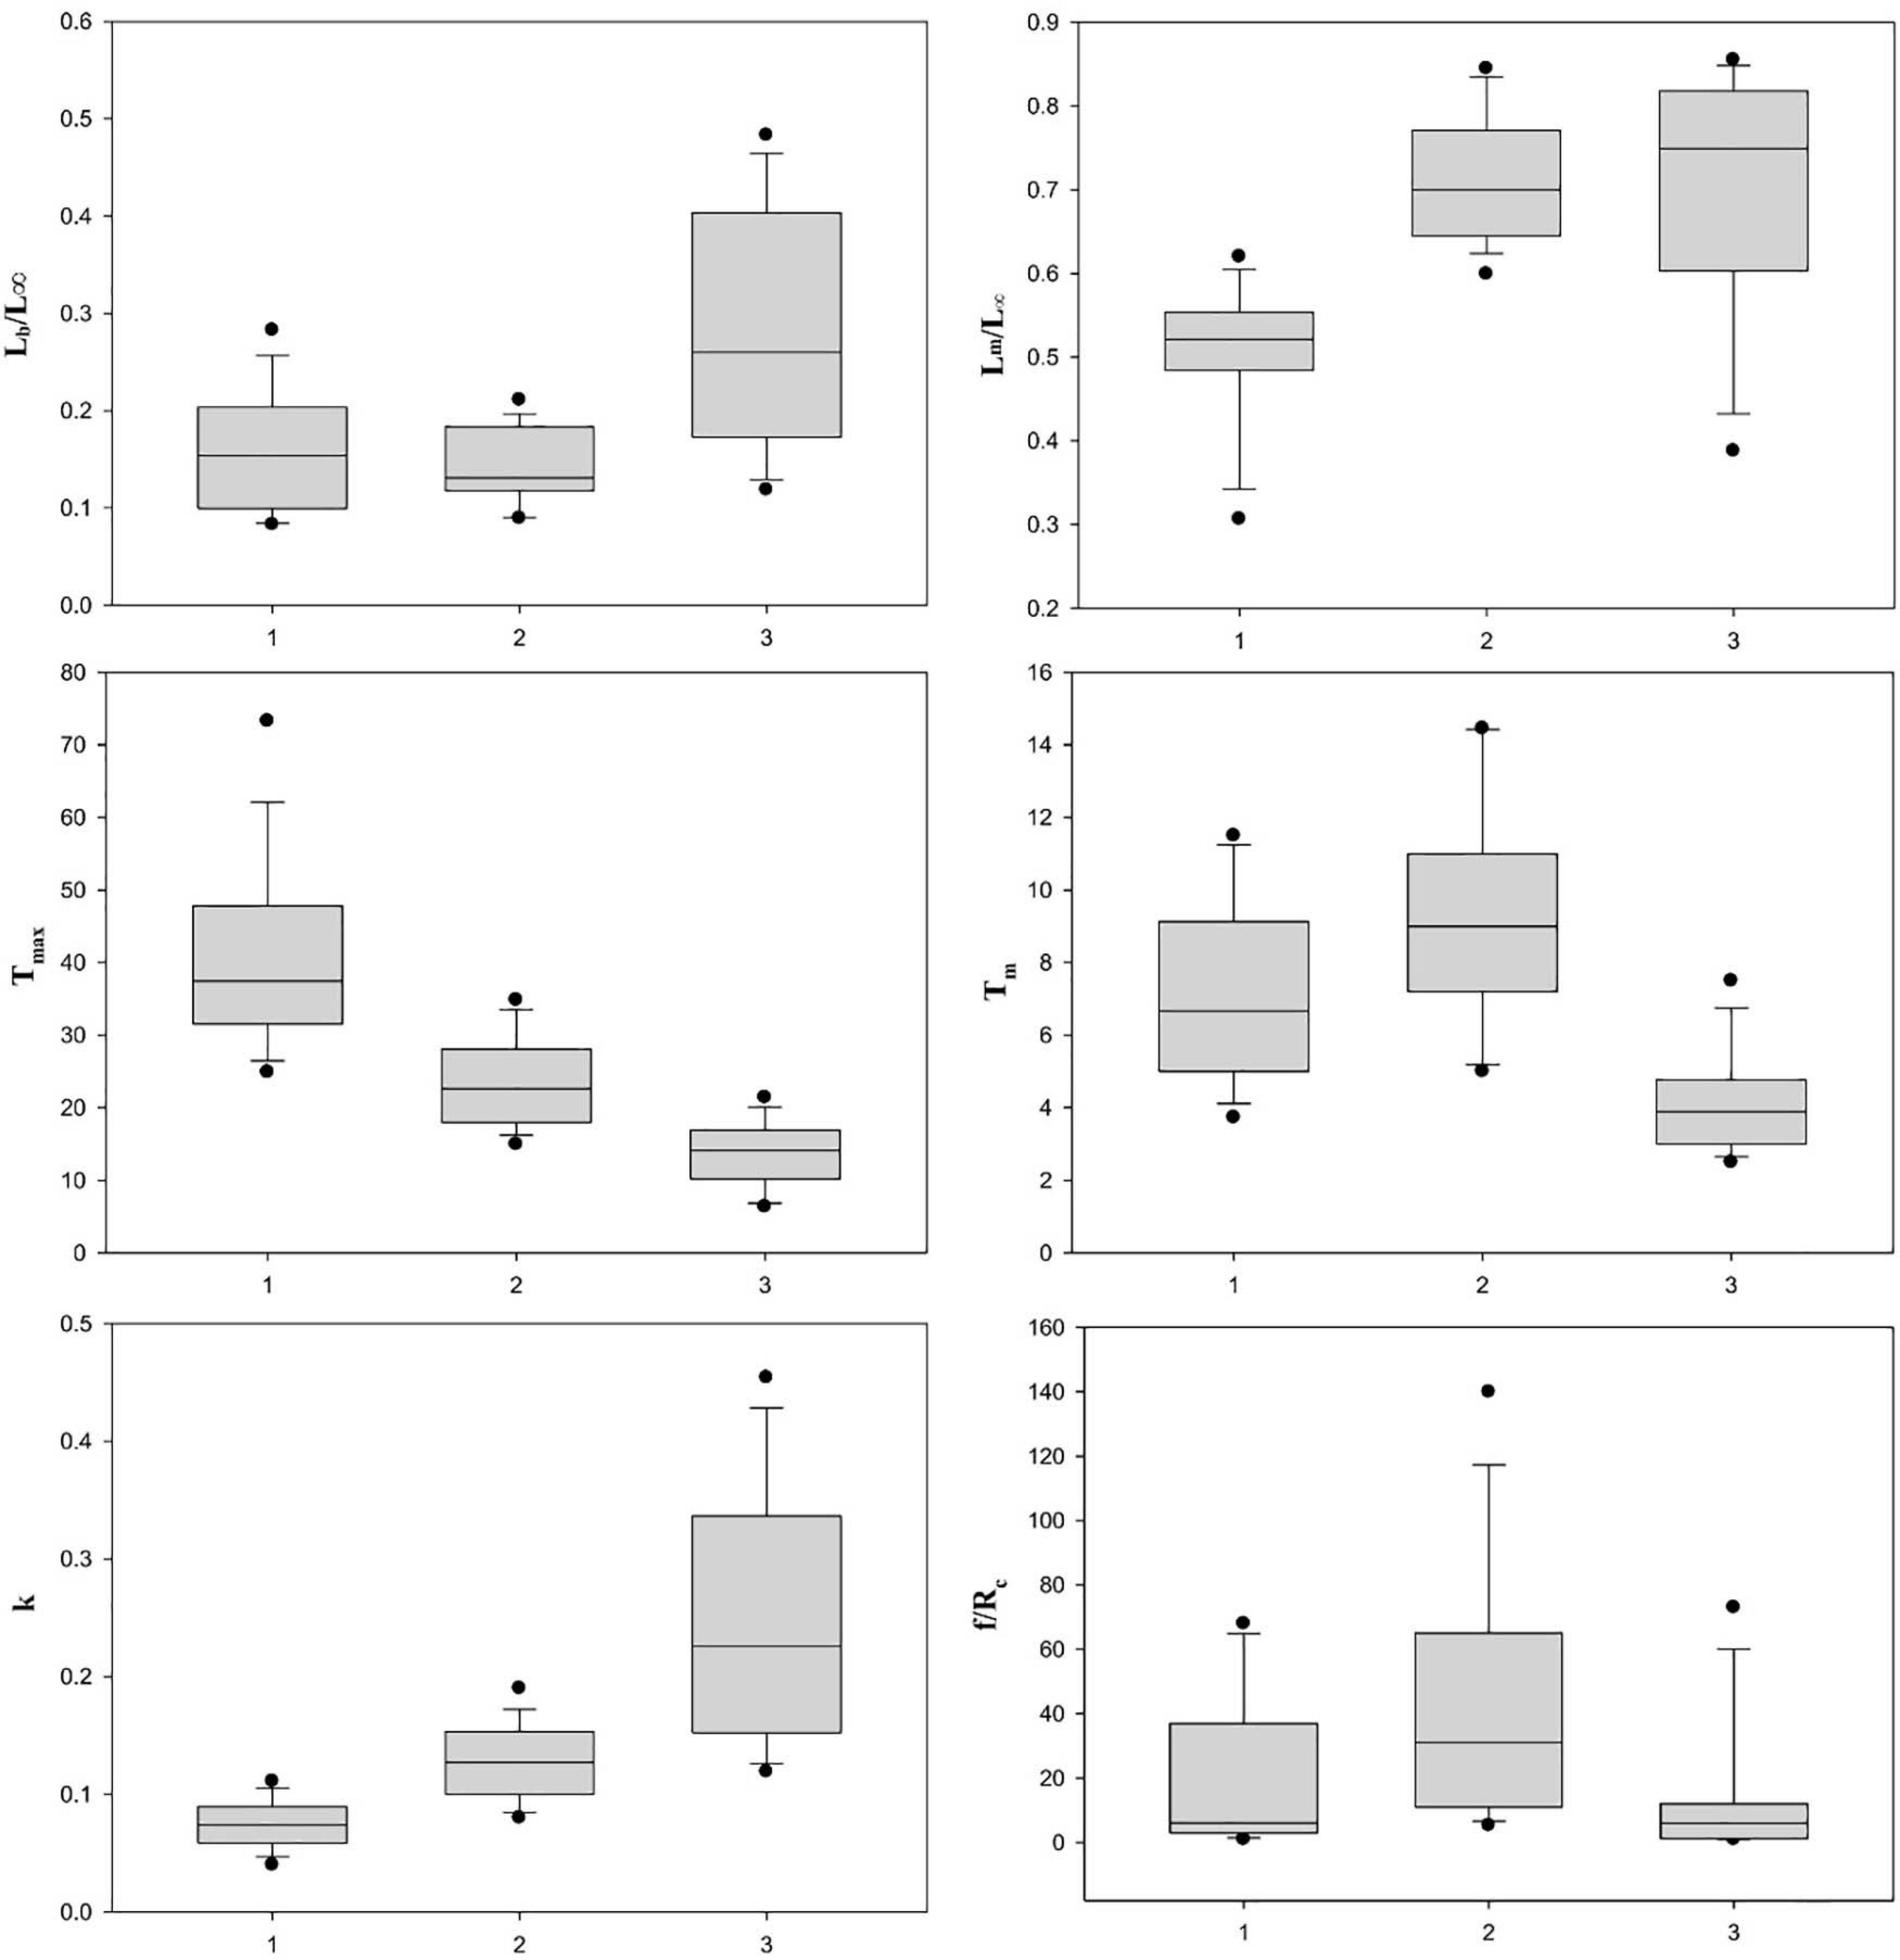
Figure 2. Box plot of six life history parameters by group.
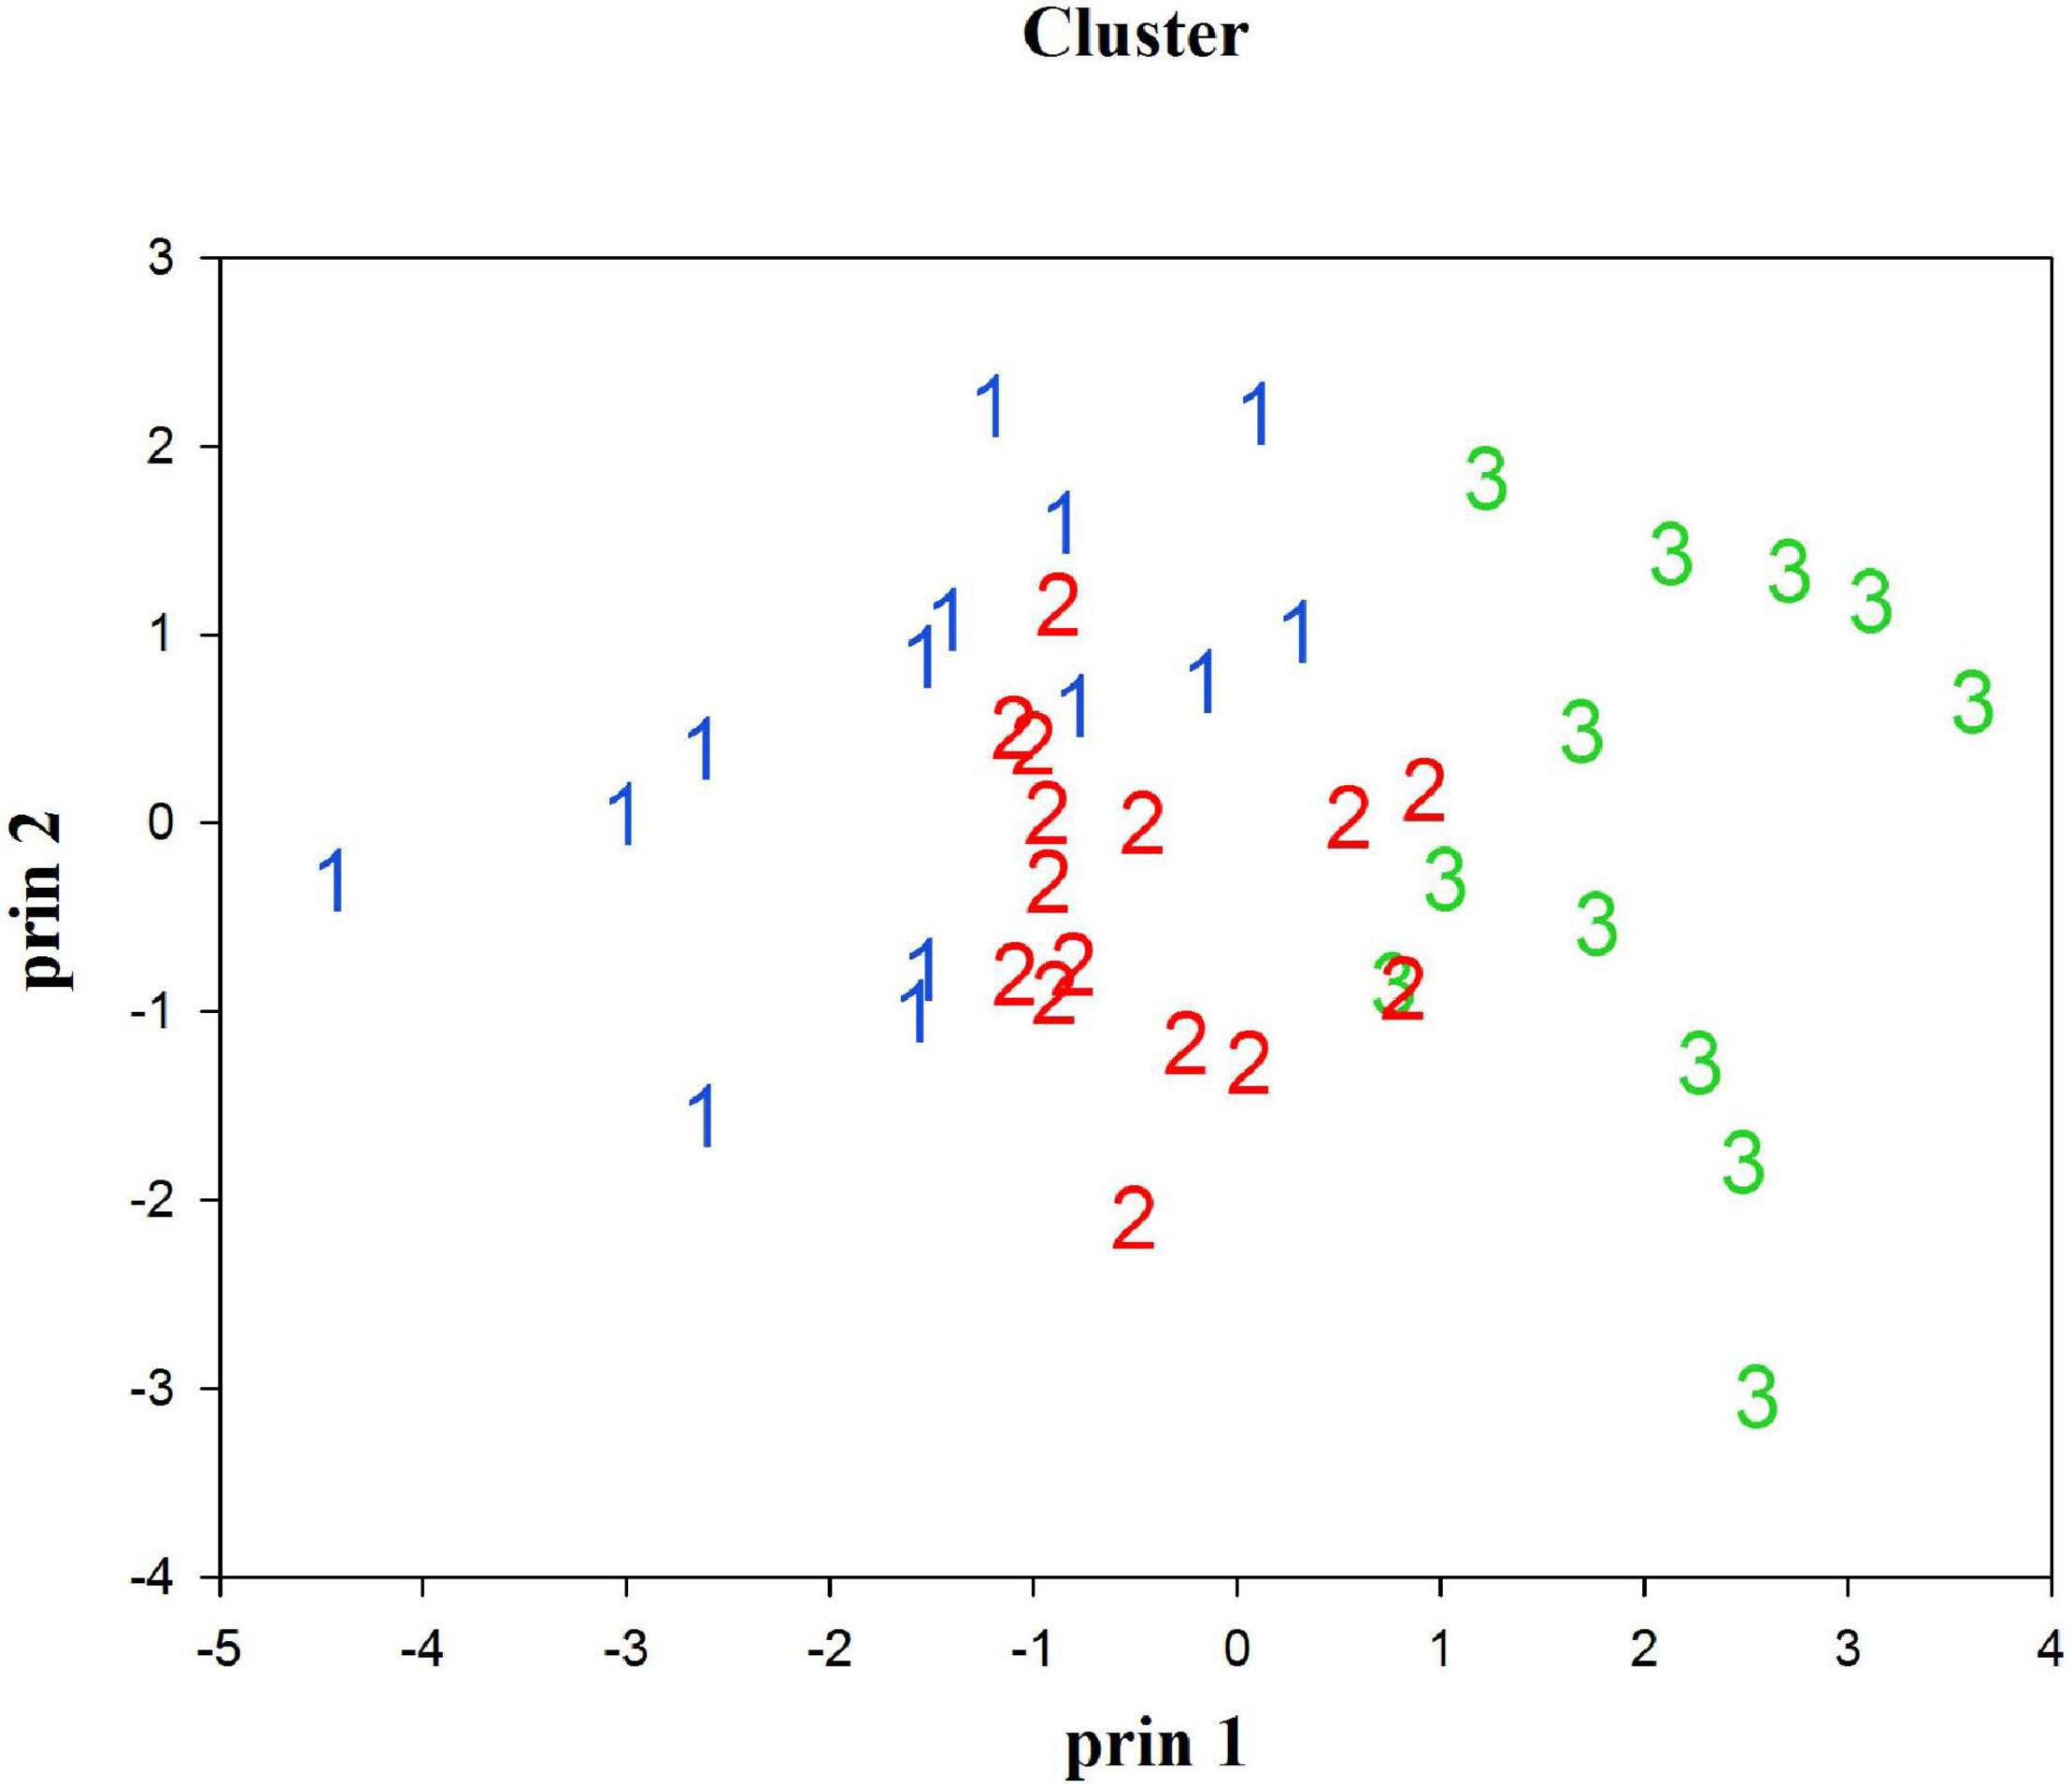
Figure 3. Plot of cluster grouping by principal 1 (PC 1) and principal 2 (PC 2).
Group 1
Fourteen stocks with slow growth rates (k < 0.11 year–1), early maturity (Lm/L∞ < 0.62), and extended longevity (Tmax > 25 years) fell into this group, e.g., the blue stingray D. chrysonota and the big skate. The maximum age ranged from 25 years for the blue stingray to 69 years for the big skate in British Columbia waters, with all stocks being in the range 25–50 years except the big skate. The empirical equation developed for estimating the finite rate of population increase was as follows: λ′ = 1.7127 + 0.3127×ln(Lm/L)−0.272×ln(Tm) + 0.108×ln(f/Rc)(n = 14,p < 0.05) (Table 3A).
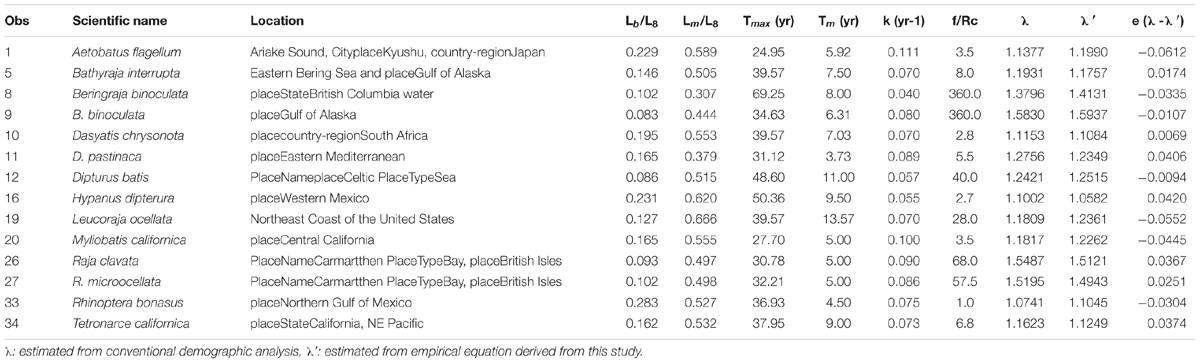
Table 3A. Life history parameters and estimated finite rate of population increase for the stocks of skates and rays in group 1.
Group 2
Fifteen stocks with intermediate growth rates (0.080 year–1 < k < 0.190 year–1), intermediate longevity (17 years < Tmax < 35 years), and late maturity (Lm/L∞ > 0.60) fell in this group, e.g., the barndoor skate and the sharpspine skate. The Tm, k, and f/Rc are the significant parameters. The value of Tm ranged from 3.7 years for the common stingray to 14.5 years for the yellownose skate. The value of k for 12 of 15 stocks (80%) fell in the range 0.10–0.19 year–1, with the remaining three stocks (20%) ranging from 0.08 to 0.09 year–1. The largest k value was for the blonde skate (k = 0.19 year–1), while the smallest was for the roughtail skate (k = 0.08 year–1). The f/Rc ranged from 5.3 for the southern fiddler ray T. fasciata to 140 for the thornback ray R. clavata (Figure 2). The empirical equation for estimating the finite rate of population increase is as follows: λ′ = 1.25230.4038×ln(Tm)0.2302×ln(k) + 0.1166×ln(f/Rc)(n = 15,p < 0.05) (Table 3B).

Table 3B. Life history parameters and estimated finite rate of population increase for the stocks of skates and rays in group 2.
Group 3
Twelve stocks with fast growth rate (k > 0.160 year–1), low longevity (Tmax < 23 years), and large size at birth (Lb/L∞ > 0.18), e.g., the pelagic stingray and the little skate, fell in this group. Lm/L∞ ranged from 0.39 for the pelagic stingray to 0.86 for the white-spotted stingaree Urolophus paucimaculatus, with nine of 12 stocks (75%) in the range 0.63–0.86. A second characteristic of this group was larger values of f/Rc and Lb/L∞ (Figure 3). The empirical equation for estimating the finite rate of population increase is as follows: λ′ = 0.9205 + 0.0603×ln(Lb/L)0.3744×ln(Lm/L) + 0.1234×ln(f/Rc) (n = 12, p < 0.05) (Table 3C).
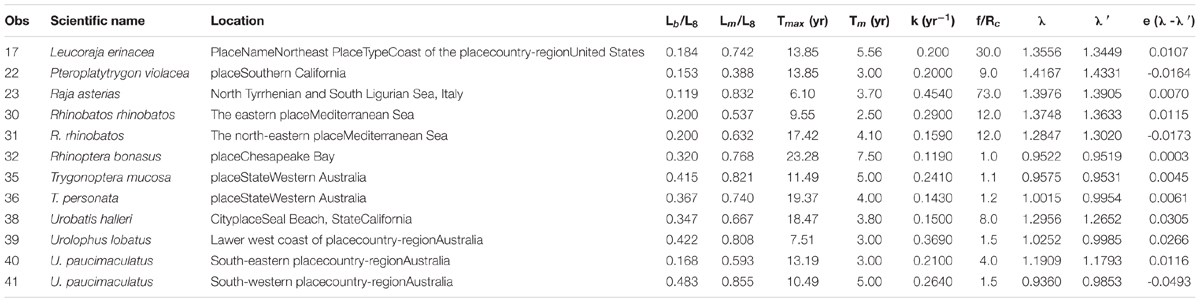
Table 3C. Life history parameters and estimated finite rate of population increase for the stocks of skates and rays in group 3.
The λ′ predicted from the aforementioned empirical equations ranged from 0.9873 to 1.5937 with medians of 1.1084–1.3057. The correlations between λ and λ′ are 0.98, 0.99, and 0.99 for the three groups, and the regression lines are close to the 45° lines (Figures 4A–C). No obvious trends were found for the residual plots of the three regression lines, suggesting that the empirical equations derived from this study can precisely predict the finite rate of population increase for skates and rays.
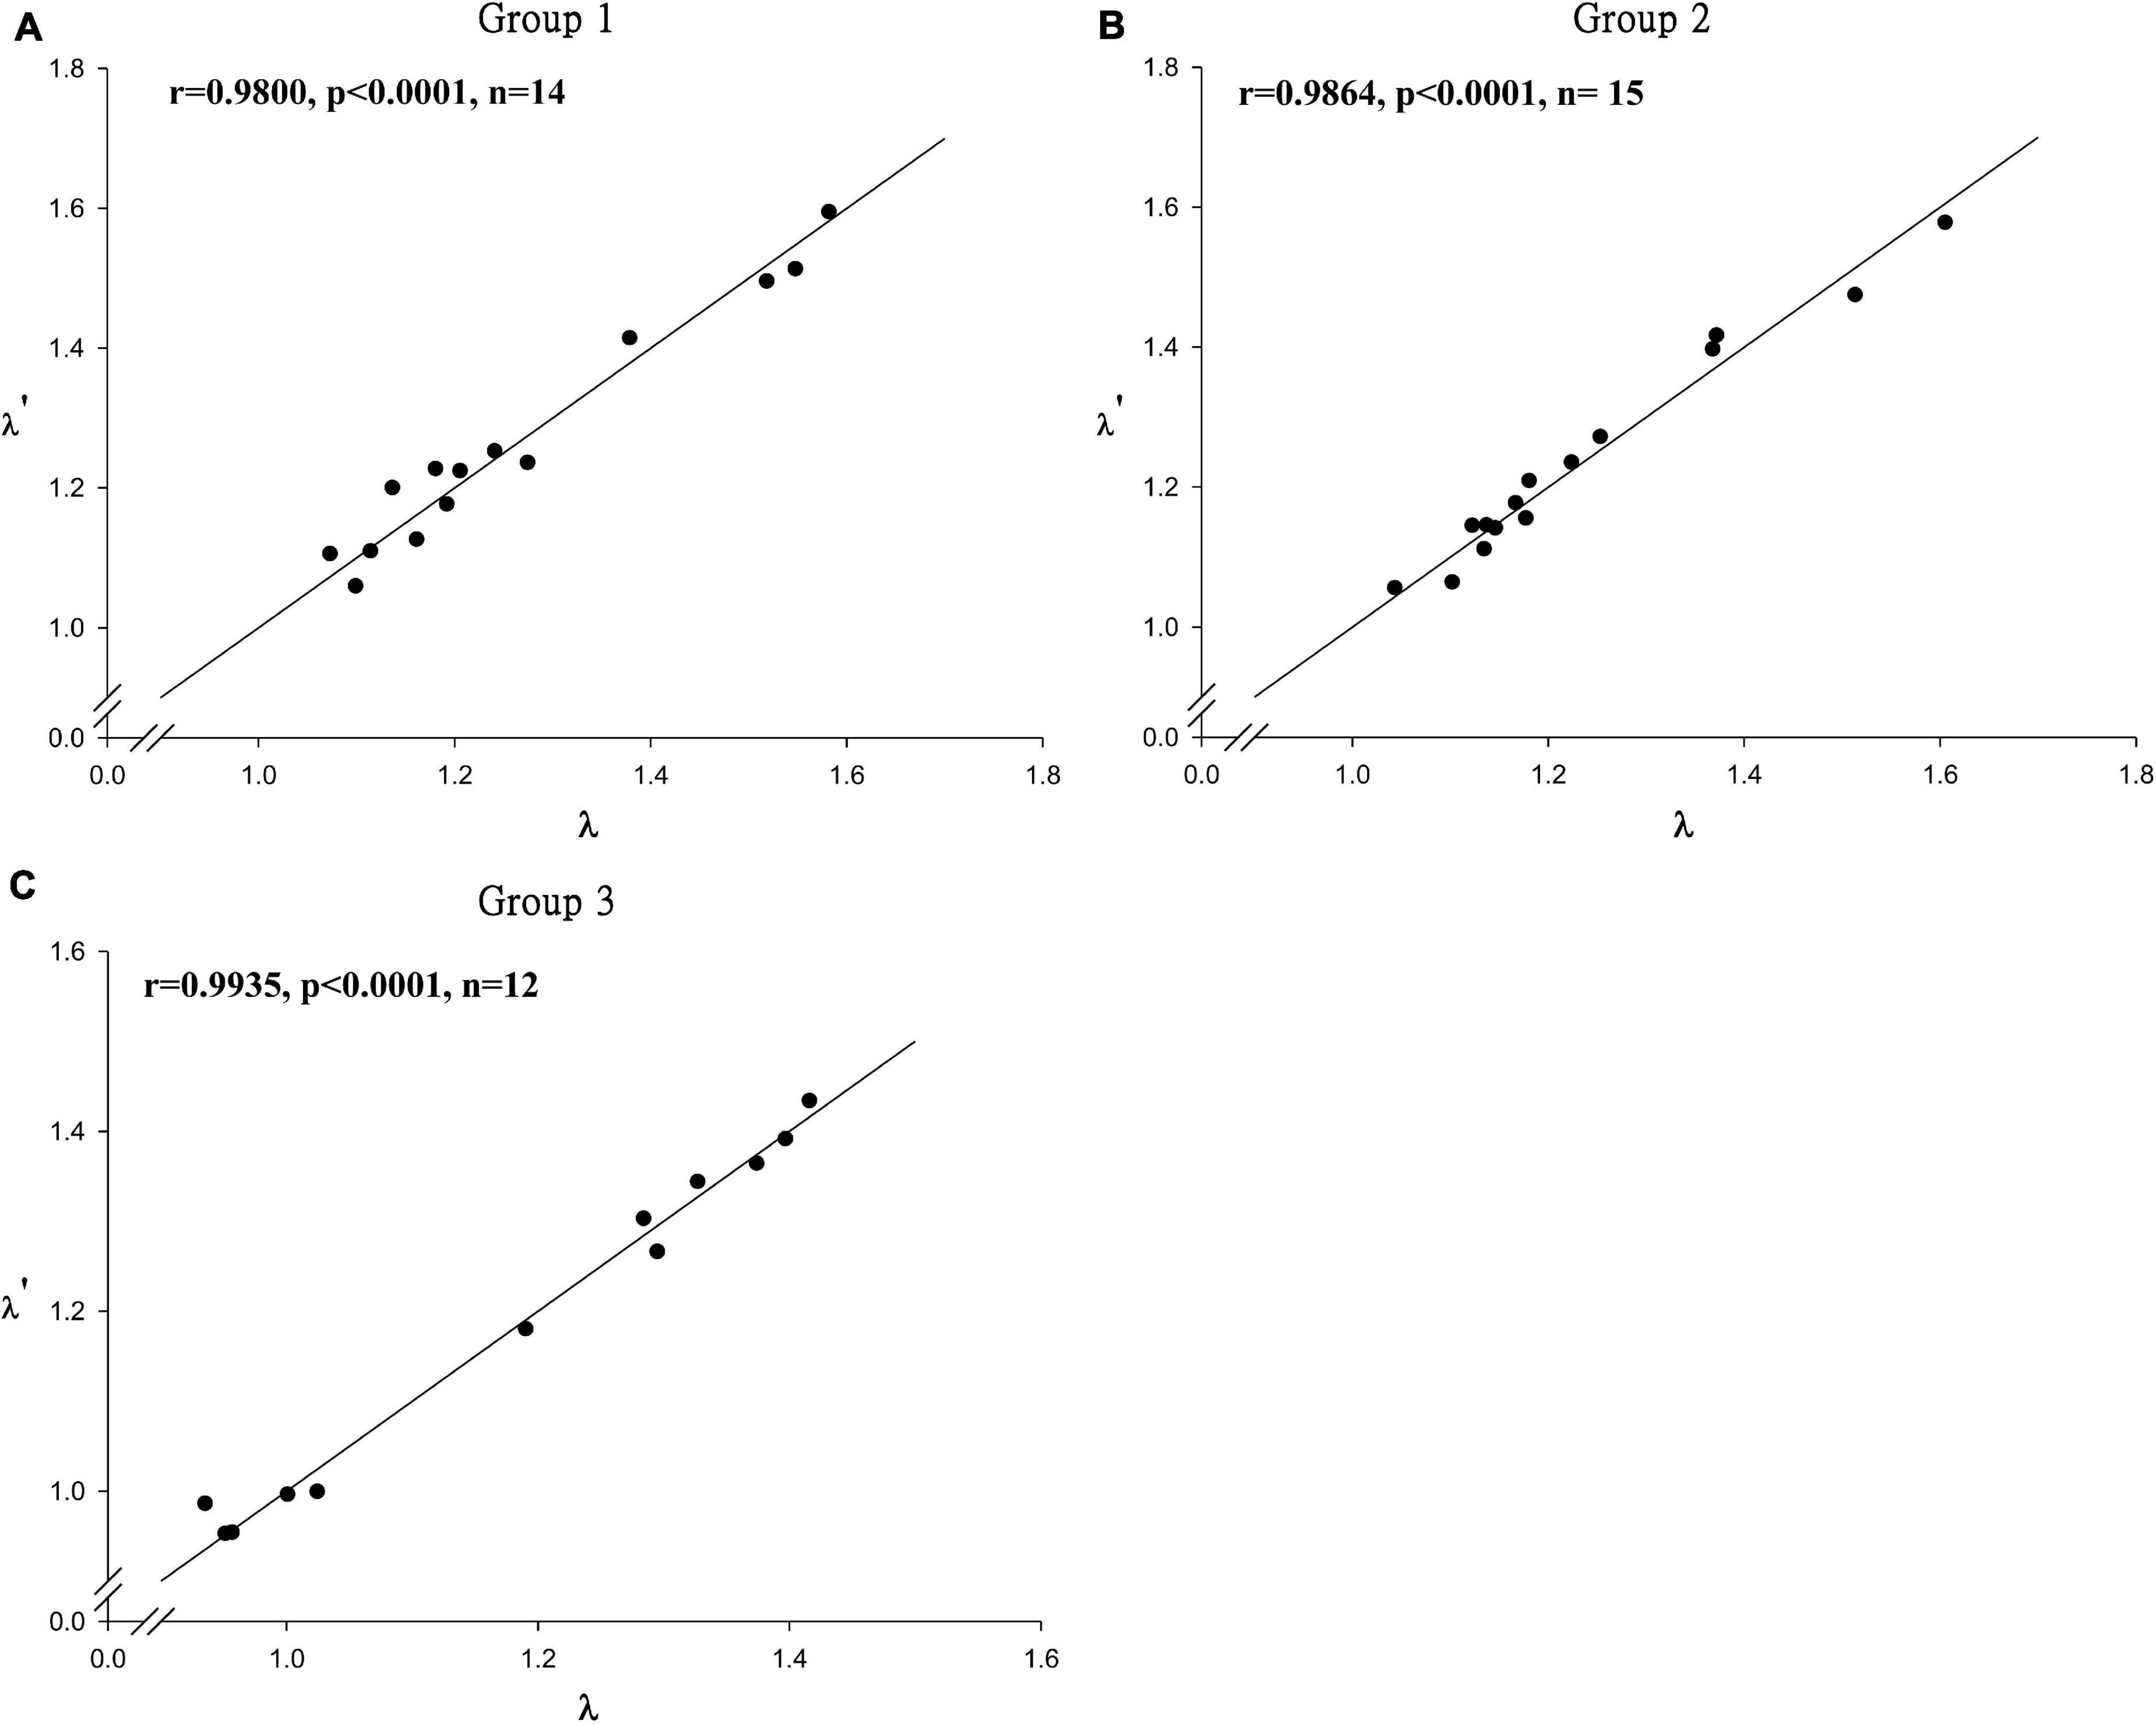
Figure 4. The relation between λ and λ′ for 41 stocks. Where λ′ represent the population growth rate estimated from conventional demographic approach for groups 1, 2, and 3 [(A–C) respectively].
Habitat Parameters and Grouping
The relationships between habitat parameters and groups related to PC1 and PC2 were as follows. The SST of the habitats of Group 1 and Group 2 species was lower than that of Group 3 species. The species that fall in Groups 1 and 2 are temperate raja in high latitude, but the species that fall in Group 3 are stingaree in tropic waters. The depth of habitat for Group 1 species ranged from 25 to 150 m; that for Group 2 species was deeper than 150 m; and that for Group 3 species was less than 50 m. The grouping had no significant correlation with salinity.
Discussion
The empirical equations based on life history parameters of 41 skate and ray stocks were developed to estimate population increase rates in this study. This approach can be applied to derive useful information in conservation and management for skates and rays particularly for those species with limited data. However, as the life history data used in this study were adopted from the literature, the inconsistence of data quality and design differences among studies may occur. To solve this problem, future work should consider using meta-analyses employing hierarchical models demonstrated by Thorson et al. (2015).
Although the length measurements in the literature for skates and rays were inconsistent, the DWs were not converted to TL because the DW–TL relations were only available for few species. As the values of Lb/L∞, Lm/L∞ and DWb/DW∞, DWm/DW∞ are highly correlated, and only these ratios were used in empirical equations, inconsistencies in length measurement among stocks are not likely to influence the estimate of λ′.
Skates and rays grow slowly compared with teleost fishes; however, the growth coefficients vary largely among species (Musick, 1999; Cailliet and Goldman, 2004). Cailliet and Goldman (2004) mentioned that k ranged at 0.20-0.50 year–1 for Rhinobatidae and Torpedinidae and Myliobatiformes and that k ranged at 0.05–0.50 year–1 for Rajiformes. The k values of 41 stocks used in this study ranged from 0.04 to 0.454 year–1, which fall in the aforementioned ranges. Given that the data used in this study covered a wide range of growth rates, we believe the results derived from this study are robust and can be applied to other skate and ray species.
Winemiller and Rose (1992) and King and McFarlane (2003) identified five groups of life history strategy for fish: opportunistic, periodic, equilibrium, median, and migratory species. Elasmobranchs fall in equilibrium species due to their characteristics of slow growth, late maturity, and prolonged longevity. Liu et al. (2015) identified three life history strategy groups for sharks based on their vital parameters. In this study, three groups were also identified for skates and rays. The species in Group 1 have the characteristics of slow growth and prolonged longevity, which are similar to the characteristics of equilibrium species for sharks, but they mature early. The species in Group 2 have the characteristics between those of opportunistic and equilibrium species for sharks but mature late, which are similar to those of periodical species. The species in Group 3 have the characteristics of fast-growing and short longevity, which are similar to opportunistic species for sharks but with larger Lb/L∞ values.
The λ values of seven species of skates and rays have been estimated using conventional demographic approach (Simpfendorfer, 2000; Neer and Cailliet, 2001; Frisk et al., 2002; Mollet and Cailliet, 2002; Quiroz and Wiff, 2005; Smith et al., 2008). Slight differences between λ from previous studies and λ′ derived from our empirical equations were found for yellownose skate, diamond stingray, winter skate, little skate, and Pacific electric ray, but the difference was larger for pelagic stingray (Table 4). The differences between λ or λ′ and those values of previous studies (Table 4) were due to the different settings of life history parameters such as tmax, tmat, M, or f/Rc. For example, the different settings of M, tmax, and f/Rc for pelagic stingray lead the different estimated values (1.174 and 1.433) for λ and λ′, respectively. Nevertheless, the values of λ and λ′ estimated in this study were close even using different approaches, suggesting that the empirical equations derived from this study are robust estimators of λ.
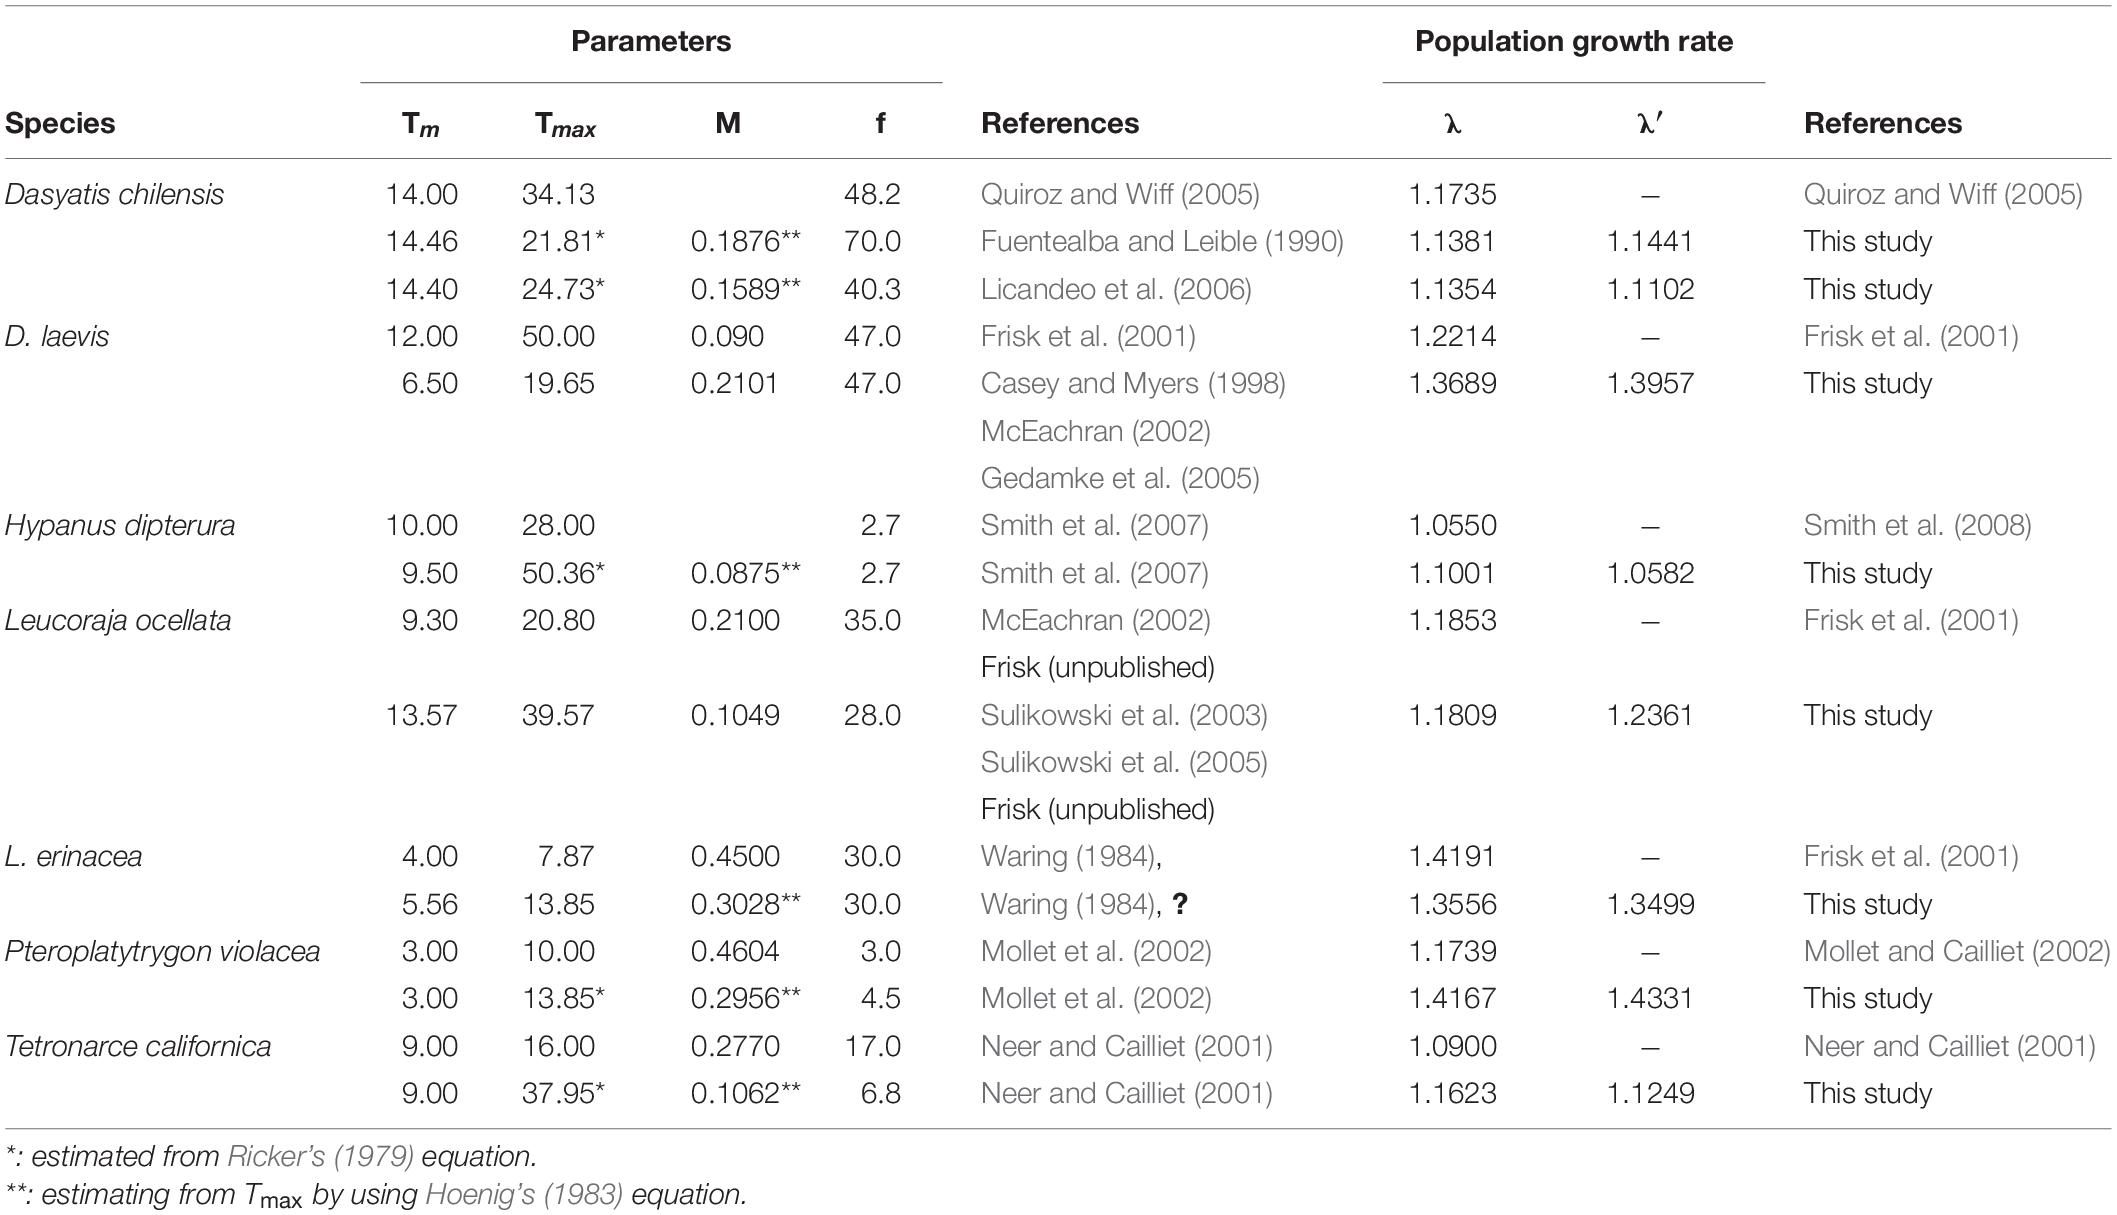
Table 4. Comparison of finite rate of population increase(λ)for 7 species of skates and rays from different studies.
Annual fecundity is important information for demographic analysis. Large variation in fecundity was documented between oviparous and viviparous elasmobranchs. For example, the mean annual fecundity was only 5.5 pups per litter for skates but was 58.9 egg capsules for rays (Musick and Ellis, 2005). Compared with the viviparous species, the oviparous species are more vulnerable to predations or environmental changes; thus, they take a strategy of producing more egg capsules (Cox and Koob, 1993; Lucifora and Garcia, 2004). Among the species analyzed in this study, Myliobatiformes (viviparous species) have the lowest litter size, while Rajiformes (oviparous species) produce the highest number of eggs. Although most skates have high fecundity, those of Bathyraja spp. and Okamejei sp. have relatively low fecundity. The low fecundity is likely due to the relative stable habitats in deeper waters for these species.
Annual fecundity information is very limited particularly for oviparous species. The reproductive cycle was assumed to be 1 year for those species without this information. The big skate can produce 360 egg capsules (three to four embryos per capsule) and 1,440 embryos per year at most, which is the highest productivity species of Elasmobranchs (Ebert and Davis, 2007). The results of CA did not change either embryo per capsule, which was assumed to be one or four for big skate in this analysis. Pardo et al. (2018) examined the effect of uncertainty on the estimating maximum intrinsic rate of population increase and recommended that distributions of litter sizes should be frequently measured and natural mortality estimation should be improved for data–poor elasmobranchs.
The ratio of Lb/L∞ of most elasmobranchs ranged from 0.150 to 0.350 (Joung, 1993). The ratios of the skates and rays used in this study fall in the range of 0.102–0.200 (n = 26, 63.4%), 0.150–0.350 (n = 20, 48.8%), and <0.150 (n = 17, 41.5%). Only four species (9.76%), i.e., western shovelnose stingaree, masked singaree, lobed stingaree, and white–spotted stingaree, have the Lb/L∞ > 0.350. The low Lb/L∞ values for skates and rays may be related to their large fecundity/litter size. Cortés (2000) and Liu et al. (2015) also documented that there is a negative correlation between Lb/L∞ and annual fecundity. As the annual fecundity of skates and rays was higher than that of sharks, smaller values of Lb/L∞ were expected.
The Lm/Lmax value falls in 0.5–0.9 for most elasmobranchs (Holden, 1974; Compagno, 1984; Pratt and Casey, 1990; Joung, 1993). Similar results were found in this study. Although Lm/L∞ ranged from 0.307 to 0.855, 35 out of 41 stocks fall in 0.5–0.9. Only six stocks have the Lm/L∞ smaller than 0.5, and five of them fall in Group 1 (early maturity).
The bias of tmax estimation may influence the estimation of λ. To avoid the underestimates of the maximum age by using the maximum observed age (Skomal and Natanson, 2003) due to lacking of oldest samples, empirical equations such as those from Taylor (1958); Fabens (1965), and Ricker (1979) were commonly applied to estimate the maximum age (Cailliet et al., 2006). In this study, Ricker’s (1979) equation was selected because the values estimated from the other two equations were much higher than the maximum observed age. Consequently, this method was used to estimate tmax for all species. Frisk et al. (2001) developed an empirical equation between tmax and age at maturity for elasmobranchs based on 35 species. However, the tmax values back estimated from this method were smaller than those from other methods for most species, suggesting that the approach may underestimate the maximum age of skates and rays. Thus, this method was not used in this study. Nevertheless, as tmax was not selected in our empirical equations in estimation of λ′, the estimation method of tmax could not affect the results derived from this study.
Hoenig (1983) equations have been commonly used in estimating M of elasmobranchs (Cortés, 1995; Sminkey and Musick, 1995; Au and Smith, 1997) including various skates and rays (Frisk et al., 2002, 2005; Davis et al., 2007). Although additional empirical equations such as Jensen (1996); Mollet and Cailliet (2002), and Hewitt and Hoenig (2005) have been proposed, the estimation of M for elasmobranchs is difficult, as these equations are dependent on life history parameters with uncertainty. The empirical equations derived from this study for estimation of λ are not dependent on M, thus reducing the uncertainty.
The high correlation between predicted λ′ and λ for Groups 1–3 and the randomly distributed residuals suggest that the empirical equations developed in this study can predict λ precisely. To validate the empirical equations derived from this study, one independent data set of Dipturus trachyderma with Lm/L∞ = 0.8366, f/Rc = 48.7, k = 0.081 year–1, Tmax = 35.6 years, and Tm = 17.4 years (Licandeo et al., 2007) was used. This species falls in Group 2 based on its life history parameters. The predicted values of λ′ (1.1305) from the empirical equation were close to the value of λ derived from conventional demographic method (1.1434), suggesting that the empirical equations derived from this study can predict λ of other skates and rays accurately.
There is closely relation between life history trait and marine habitats. García et al. (2008) proposed three major marine habitats (continental shelves, open sea, and deep sea). The continental shelves include pelagic and benthic waters that have high primary production and large environmental variations, while the open ocean habitat has low primary production and the deep sea habitat is dark and cold with almost no primary production and relies on the organisms falling down for meso-pelagic waters. Compared with pelagic environment, deep sea species grow slowly, mature late, and has prolonged longevity, and their resilience to overexploitation is low.
Rajiformes inhabit high latitude and deep waters, while Myliobatiformes inhabit low latitude and shallow waters (Ebert and Compagno, 2007). King and McFarlane (2003) concluded that opportunistic species stay in shallower waters. while equilibrium species inhabit deeper waters. Similar results were found in this study. The skates and rays in Group 1 or Group 2 identified in this study have habitats in higher latitude with low SST and low primary production, which cause the slow growth of these species. These are the characteristics of equilibrium species for Raja spp. in addition to longheaded eagle ray, blue stingray, diamond stingray, common stingray, bat eagle ray, Myliobatis californica, and cownose ray. The species in the Group 3 inhabit lower latitude with higher SST, shallow waters and have higher primary production. These species have fast-growing characteristics identified in opportunistic species such as starry skate, little skate, common guitarfish, and the species in Urolophidae.
The species in Group 1 have similar life history characteristics as equilibrium species of sharks but with early maturation. These species may be vulnerable or even encounter regional collapsed if catch control or fishing effort monitoring is not implemented such as in diamond stingray (Smith et al., 2008). The species in Group 2 have a general growth rate with late maturity characteristics. It is recommended to apply the management measure of periodical species such as reducing fishing pressure by modifying the fishing gears to these species. In addition, as the exploitation rate of elasmobranchs is related to the size of fish, the large-size species such as yellownose skate (Quiroz and Wiff, 2005) should be monitored with caution. The Lb/L∞ of the aforementioned two groups was smaller than that of Group 3. Thus, protection of young-of-year is recommended for the species in Groups 1 and 2, as small-size neonates generally mean high mortality. Barnett et al. (2013) applied age-structured demographic models to examine the effect of life history parameters change on population growth rates for five deep sea skate species, which fall in these groups, and they concluded that gear modifications or depth-specific effort controls may be an effective management measure. The species in Group 3 have higher Lb/L∞ but low fecundity, they are vulnerable to overexploitation, and the recovery time is long. Mollet and Cailliet (2002) proposed to protect adults to ensure the sustainability for stingray in this group. In addition to aforementioned management measures, Enever et al. (2009) mentioned that the survival rate of rays caught by trawl fishery was 55%. Therefore, it is suggested to release the skates and rays to reduce their mortality rate.
It might be too late to take management actions after the species-specific full stock assessment has been made. In this study, an alternate approach was provided to estimate the finite rate of population increase. The empirical equations developed for each group provide accurate predictions of λ by reducing the bias of estimation resulting from parameter uncertainties. The results derived from this study can be used in the implementation of management measures for data-limited skates and rays in a precautionary manner, as the single species stock assessment and management measure are difficult to apply to those skates and rays that were commonly by-caught in trawling fishery. Ecological risk assessment based on the λ′s estimated from our empirical equations can be an alternate approach to evaluate the risk of several species for precautionary purposes. Furthermore, for those skates or rays without detailed life history, parameters can be classified into one of three groups based on similar species identified in this study, and then provisional management actions as aforementioned can be taken until more detailed life history research can be conducted. This study considered only 35 of 574 batoid species (41 stocks) in the world (Ebert and Compagno, 2007). The life history parameters used in this study were mainly from skates (23 stocks), but those for manta rays, devil rays, and guitarfish were lacking. Therefore, the estimates derived from this study may not cover all life history traits of skates and rays. Future studies should focus on collecting updated life history parameters of more species particularly on those not covered by this study to improve the robustness of these empirical equations. These empirical equations should be updated regularly according to the availability of new information of life history parameters.
Data Availability Statement
The original contributions presented in the study are included in the article/Supplementary Material, further inquiries can be directed to the corresponding author.
Author Contributions
K-ML and Y-WH conceived and designed the experiments, performed the experiments, analyzed the data, and wrote the manuscript. H-HH contributed reagents, materials, and analysis tools. All authors contributed to the article and approved the submitted version.
Funding
This study was financially supported by the Ministry of Science and Technology, Taiwan, under Contract No. MOST 105-2313-B-019-005-MY3.
Conflict of Interest
The authors declare that the research was conducted in the absence of any commercial or financial relationships that could be construed as a potential conflict of interest.
Supplementary Material
The Supplementary Material for this article can be found online at: https://www.frontiersin.org/articles/10.3389/fmars.2021.664611/full#supplementary-material
References
Agnew, D., Nolan, C. P., Beddington, J. R., and Baranowski, R. (2000). Approaches to the assessment and management of multispecies skate and ray fishe ries using the Falkland islands fishery as an example. Can. J. Fish. Aquat. Sci. 57, 429–440. doi: 10.1139/f99-264
Akaike, H. (1974). A new look at the statistical model identification. IEEE Trans. Automat. Contr. 19, 716–723. doi: 10.1109/tac.1974.1100705
Anon, (2013). The CITES Appendices. Available online at: www.cites.org/eng/app/index.php (accessed January 18, 2021).
Anon (2016). The CITES Appendices. Available online at: www.cites.org/eng/app/index.php (accessed January 18, 2021).
Anon (2019). The CITES Appendices. Available online at: www.cites.org/eng/app/index.php (accessed January 18, 2021).
Au, D. W., and Smith, S. E. (1997). A demographic method with population density compensation for estimating productivity and yield per recruit of the leopard shark (Triakis semifasciata). Can. J. Fish. Aquat. Sci. 54, 415–420. doi: 10.1139/f96-288
Babel, J. S. (1967). Reproduction, life history, and ecology of the round stingray, Urolophus halleri cooper. State Calif. Resour. Agency Depart. Fish Game Fish. Bull. 137, 1–104.
Barnett, L. A. K., Winton, M. V., Ainsley, S. M., Cailliet, G. M., and Ebert, D. A. (2013). Comparative demography of skates: life-history correlates of productivity and implications for management. PLoS One 8:e65000. doi: 10.1371/journal.pone.0065000
Cailliet, G. M., and Goldman, K. J. (2004). “Age determination and validation in chondrichthyan fishes,” in Biology of Sharks and Their Relatives, eds J. C. Carrier, J. A. Musick, and M. R. Heithaus (New York, NY: CRC Press), 399–447. doi: 10.1201/9780203491317.pt3
Cailliet, G. M., Smith, W. D., Mollet, H. F., and Goldman, K. J. (2006). Age and growth studies of chondrichthyan fishes: the need for consistency in terminology, verification, validation, and growth function fitting. Environ. Biol. Fish. 77, 211–228. doi: 10.1007/s10641-006-9105-5
Casey, J. M., and Myers, R. A. (1998). Near extinction of a large, widely distributed fish. Science 281, 690–692. doi: 10.1126/science.281.5377.690
Chang, S. R. (2006). Reproductive Biology of Sharpspine Skate, Okameiei Acutispina in the Northeastern Taiwan Waters. Ph.D. thesis. Keelung: National Taiwan Ocean University, 122.
Compagno, L. J. V. (1984). FAO Species Catalogue. Sharks of the World. An Annotated and Illustrated Catalogue of Shark Species Known to Date. Parts 1 and 2. FAO Fishesries Synopsis No. 125, Vol. 4. Rome: FAO, 655.
Cortés, E. (1995). Demographic analysis of the atlantic sharpnose shark, Rhizoprionodon terraenovae, in the Gulf of Mexico. Fish. Bull. 93, 57–66.
Cortés, E. (1998). Demographic analysis as an aid in shark stock assessment and management. Fish. Res. 39, 199–208. doi: 10.1016/S0165-7836(98)00183-0
Cortés, E. (2000). Life-history patterns and correlations in sharks. Rev. Fish. Sci. 8, 299–344. doi: 10.1080/10408340308951115
Cowley, P. D. (1997). Age and growth of the blue stingray Dasyatis chrysonota chrysonota from the south-eastern cape coast of South Africa. South Afr. J. Mar. Sci. 18, 31–38. doi: 10.2989/025776197784161054
Cox, D. L., and Koob, T. J. (1993). Predation on elasmobranch eggs. Environ. Biol. Fish. 38, 117–125. doi: 10.1007/BF00842908
Davidson, L. N. K., Krawchuk, M. A., and Duley, N. K. (2016). Why have global shark and ray landings declined: improved management or overfishing? Fish Fish. 17, 438–458. doi: 10.1111/faf.12119
Davis, C. D., Cailliet, G. M., and Ebert, D. A. (2007). Age and growth of the roughtail skate Bathyraja trachura (Gilbert 1892) from the eastern North pacific. Environ. Biol. Fishes 80, 325–336. doi: 10.1007/s10641-007-9224-7
Du buit, M. H. (1977). Age et croissance de Raja batis et de Raja naevus en mer celtique. ICES J. Mar. Sci. 37, 261–265. doi: 10.1093/icesjms/37.3.261
Dulvy, N. K., and Reynolds, J. D. (2002). Predicting extinction vulnerability in skates. Conserv. Biol. 16, 440–450. doi: 10.1046/j.1523-1739.2002.00416.x
Dulvy, N. K., Reynolds, J. D., Metcalfe, J. D., and Glanville, J. (2000). Fisheries stability, local extinctions and shifts in community structure in skates. Conserv. Biol. 14, 283–293. doi: 10.1046/j.1523-1739.2000.98540.x
Ebert, D. A. (2005). Reproductive biology of skates, Bathyraja (Ishiyama), along the eastern Bering Sea continental slope. J. Fish. Biol. 66, 618–649. doi: 10.1111/j.0022-1112.2005.00628.x
Ebert, D. A., and Bizzarro, J. J. (2007). Standardized diet compositions and trophic levels of skates (Chondrichthyes: Rajiformes: Rajoidei). Environ. Biol. Fish. 80, 221–237. doi: 10.1007/978-1-4020-9703-4_8
Ebert, D. A., and Compagno, L. J. V. (2007). Biodiversity and systematics of skates (Chondrichthyes: Rajiformes: Rajoidei). Environ. Biol. Fish. 80, 111–124. doi: 10.1007/978-1-4020-9703-4_2
Ebert, D. A., and Cowley, P. D. (2008). Reproduction and embryonic development of the blue stingray, Dasyatis chrysonota, in southern African waters. J. Mar. Biol. Assoc. U.K. 89, 809–815. doi: 10.1017/S0025315408002907
Ebert, D. A., and Davis, C. D. (2007). Descriptions of skate egg cases (Chondrichthyes: Rajiformes: Rajoidei) from the eastern North Pacific. Zootaxa 1393, 1–18. doi: 10.11646/zootaxa.1393.1.1
Ebert, D. A., and Sulikowski, J. (2009). “Biology of skates,” in Developments in Environmental Biology of Fishes, ed. D. L. G. Noakes (Heidelberg: Springer-Verlag), 244.
Enever, R., Catchpole, T. L., Ellis, J. R., and Grant, A. (2009). The survival of skates (Rajidae) caught by demersal trawlers fishing in UK waters. Fish. Res. 97, 72–76. doi: 10.1016/j.fishres.2009.01.001
Fabens, A. J. (1965). Properties and fitting of the von Bertalanffy growth curve. Growth 29, 265–289.
Frisk, M. G., Miller, T. J., and Dulvy, N. K. (2005). Life histories and vulnerability to exploitation of elasmobranchs: inferences from elasticity, perturbation and phylogenetic analyses. J. Northwest Atl. Fish. Sci. 35, 27–45. doi: 10.2960/j.v35.m514
Frisk, M. G., Miller, T. J., and Fogarty, M. J. (2001). Estimation and analysis of biological parameters in elasmobranch fishes: a comparative life history study. Can. J. Fish. Aquat. Sci. 58, 969–981. doi: 10.1139/f01-051
Frisk, M. G., Miller, T. J., and Fogarty, M. J. (2002). The population dynamics of little skate Leuco Leucoraja erinacea, winter skate Leucoraja ocellata, and barndoor skate Dipturus laevis: predicting exploitation limits using matrix analyses. ICES J. Mar. Sci. 59, 576–586. doi: 10.1006/jmsc.2002.1177
Frisk, M. G., and Miller, T. J. (2006). Age, growth, and latitudinal patterns of two rajidae species in the northwestern Atlantic: little skate (Leucoraja erinaceae and winter skate (Leucoraja ocellata). Can. J. Fish. Aquat. Sci. 63, 1078–1091. doi: 10.1139/F06-005
Froese, R., and Pauly, D. (2015). Fish Base. World Wide Web Electronic Publication. Available online at: www.fishbase.org (accessed January 18, 2021).
Fuentealba, M., and Leible, M. (1990). “Perspectivas de la pesquerı’a de la raya volantı’n Raja (Dipturus) flavirostris: Estudio de edad, crecimiento y algunos aspectos reproductivos,” in Perspectivas de la Actividad Pesquera en Chile, ed. M. A. Barbieri (Valparaiso: Escuela de Ciencias del Mar, Universidad Cato’ lica de Valparaı’so), 227–236.
García, V. B., Lucifora, L. O., and Myers, R. A. (2008). The importance of habitat and life history to extinction risk in sharks, skates, rays and chimaeras. Proc. R. Soc. B Biol. Sci. 275, 83–89. doi: 10.1098/rspb.2007.1295
Gedamke, T., DuPaul, W. D., and Musick, J. A. (2005). Observations on the life history of the barndoor skate, Dipturus laevis, on Georges Bank (Western North Atlantic). J. Northwest Atl. Fish. Sci. 35, 67–78. doi: 10.2960/J.v35.m512
Gertseva, V. V. (2009). The population dynamics of the longnose skate, Raja rhina, in the northeast Pacific Ocean. Fish. Res. 95, 146–153. doi: 10.1016/j.fishres.2008.08.006
Hemida, F., Seridji, R., Enajjar, S., Bradai, M. N., Collier, E., Guélorget, O., et al. (2003). New observations on the reproductive biology of the pelagic stingray, Dasyatis violacea Bonaparte, 1832 (Chondrichthyes: Dasyatidae) from the mediterranean sea. Acta. Adriatica. 44, 193–204.
Hewitt, D. A., and Hoenig, J. M. (2005). Comparison of two approaches for estimating natural mortality based on longevity. Fish. Bull. 103, 433–437.
Hoenig, J. M. (1983). Empirical use of longevity data to estimate mortality rates. Fish. Bull. 82, 898–903.
Hoff, T. B., and Musick, J. (1990). “Western north atlantic shark-fishery management problems and information requirement,” in Elasmobranchs as Living Resources: Advances in the Biology, Ecology, Systematics, and the Status of Fisheries, eds H. L. Pratt, S. H. Gruber, and T. Taniuchi (Washington, DC: NOAA), 455–472.
Holden, M. J. (1974). “Problems in the rational exploitation of elasmobranch populations and some suggested solutions,” in Sea Fisheries Research, ed. F. R. Jones-Harden (London: Paul Elek), 117–137.
Jennings, S., Greenstreet, S. P. R., and Reynolds, J. D. (1999). Structural change in an exploited fish community: a consequence of differential fishing effects on species with contrasting life histories. J. Anim. Ecol. 68, 617–627. doi: 10.1046/j.1365-2656.1999.00312.x
Jensen, A. L. (1996). Beverton and holt life history invariants result from optimal trade-off of reproduction and survival. Can. J. Fish Aquat. Sci. 53, 820–822. doi: 10.1139/f95-233
Joung, S. J. (1993). Biology of the Sandbar Shark, Carcharhinus Plumbeus, in Northeastern Waters of Taiwan. Ph. D. Dissertation. Keelung: National Taiwan Ocean University, 162.
Joung, S. J., Lee, P. H., Liu, K. M., and Liao, Y. Y. (2011). Estimates of life history parameters of the sharpspine skate, Okamejei acutispina in northeastern Taiwan waters. Fish. Res. 108, 258–267. doi: 10.1016/j.fishres.2010.12.013
King, J. R., and McFarlane, G. A. (2003). Marine fish life history strategies: applications to fishery management. Fish. Manag. Ecol. 10, 249–264. doi: 10.1046/j.1365-2400.2003.00359.x
Krebs, C. J. (1985). Ecology: The Experimental Analysis of Distribution and Abundance. New York, NY: Harper and Row.
Licandeo, R., Cerna, F., and Céspedes, R. (2007). Age, growth, and reproduction of the roughskin skate, Dipturus trachyderma, from the southeastern Pacific. ICES J. Mar. Sci. 64, 141–148. doi: 10.1093/icesjms/fsl012
Licandeo, R. R., Lamilla, J. G., Rubilar, P. G., and Vega, R. A. (2006). Age, growth, and sexual maturity of the yellownose skate (Dipturus chilensis) off the southeastern pacific. J. Fish. Biol. 68, 488–506. doi: 10.1111/j.0022-1112.2006.00936.x
Liu, K. M., Chin, C. P., Chen, C. H., and Chang, J. H. (2015). Estimating finite rate of population increase for sharks based on vital parameters. PloS One 10:e0143008. doi: 10.1371/journal.pone.0143008
Lucifora, L. O., and Garcia, V. B. (2004). Gastropod predation on egg cases of skates (Chondrichthyes, Rajidae) in the southwestern atlantic: quantification and life history implications. Mar. Biol. 145, 917–922. doi: 10.1007/s00227-004-1377-8
Mariano-Melendéz, E. (1997). Biología Reproductiva de la Raya Lodera Dasyatis Brevis (Garman, 1880), en Bahía Almejas, B.C.S., México. Ph.D. thesis. México: Universidad Autóma de Baja California Sur, La Paz, B.C.S.
Marshall, L. J., White, W. T., and Potter, I. C. (2007). Reproductive biology and diet of the southern fiddler ray, Trygonorrhina fasciata (Batoidea Rhinobatidae) an important trawl bycatch species. Mar. Freshwater Res. 58, 104–115. doi: 10.1071/MF05165
McEachran, J. D. (2002). “Skates. family rajidae,” in Bigelow and Schroeder’s Fishes of the Gulf of Maine, eds B. B. Collette and G. Klein-MacPhee (Washington, DC: Smithsonian Institution Press), 60–75.
McFarlane, G. A., and King, J. R. (2006). Age and growth of big skate (Beringraja binoculata) and longnose skate (Raja rhina) in British Columbia waters. Fish. Res. 78, 169–178. doi: 10.1016/j.fishres.2006.01.009
Mollet, H. F., and Cailliet, G. M. (2002). Comparative population demography of elasmobranches using life history tables, Leslie matrices and stage-based matrix models. Mar. Freshw. Res. 53, 503–516. doi: 10.1071/MF01083
Mollet, H. F., Ezcurra, J. M., and O’Sullivan, J. B. (2002). Captive biology of the pelagic stingray, Dasyatis violacea (Bonaparte, 1832). Mar. Freshw. Res. 53, 531–541. doi: 10.1071/MF01074
Musick, J. (1999). “Ecology and conservation of long-lived marine animals,” in Life in the Slow Lane: Ecology and Conservation of Long-lived Marine Animals. American Fisheries Society Symposium 23, ed. J. A. Musick (Bethesda, MD: American Fisheries Society), 1–10.
Musick, J. A., and Ellis, J. K. (2005). “Reproductive evolution of chondrichthyans,” in Reproductive Biology and Phylogeny of Chondrichthyes: Sharks, Batoids, and Chimaeras, ed. W. C. Hamlett (Enfield, NH: Science Publishers), 45–79.
Neer, J. A., and Cailliet, G. M. (2001). Aspects of the life history of the pacific electric ray, Torpedo californica (Ayers). Copeia 2001, 842–847. doi: 10.1643/0045-8511
Pacoureau, N., Rigby, C. L., Kyne, P. M., Sherley, R. B., Winker, H., Carlson, J. K., et al. (2021). Half a century of decline in oceanic pelagic sharks and rays. Nature 589, 567–571. doi: 10.1038/s41586-020-03173-9
Pardo, S. A., Cooper, A. B., Reynolds, J. D., and Dulvy, N. K. (2018). Quantifying the known unknowns: estimating maximum intrinsic rate of population increase in the face of uncertainty. ICES J. Mar. Sci. 75, 953–963. doi: 10.1093/icesjms/fsx220
Pratt, H. L. Jr., and Casey, J. G. (1990). “Shark reproductive strategies as a limiting factor in directed fisheries, with a review of holden’s method of estimating growth-parameters,” in Elasmobranchs as living resources. NOAA Tech. Rep. NMFS 90. eds L.H. Pratt, S. Gruber, and Y. Taniuchi (Washington, DC: U.S. Department of Commerce), 98–129.
Quiroz, J. C., and Wiff, R. (2005). “Demographic analysis and exploitation vulnerability of beaked skate (Dipturus chilensis) off the Chilean austral zone,” in Proceedings of the ICES CM 2005/N:19. (Aberdeen: ICES CM)
Ricker, D. A. (1979). “Growth rates and models,” in Fish Physiology, eds W. S. Hoar, D. J. Randall, and J. R. Brett (London: Academic Press, London), 677–743. doi: 10.1016/s1546-5098(08)60034-5
Serena, F., Barone, M., Mancusi, C., and Abella, A. J. (2005). “Reproductive biology, growth and feeding habits of Raja asterias Delaroche, 1809, from the north Tyrrhenian and south Ligurian Sea (Italy), with some notes on trends in landings,” in Proceedings of the Theme Session on Elasmobranch Fisheries Science CM2005/N:20 ICES Annual Science Conference 20–24 September 2005, (Copenhagen: International Council for the Exploration of the Sea)
Simpfendorfer, C. A. (2000). Predicting population recovery rates for endangered western Atlantic sawfishes using demographic analysis. Environ. Biol. Fish. 58, 371–377. doi: 10.1023/A:1007675111597
Skomal, G. B., and Natanson, L. J. (2003). Age and growth of the blue shark (Prionace glauca) in the North Atlantic Ocean. Fish. Bull. 101, 627–639.
Sminkey, T. R., and Musick, J. A. (1995). Age and growth of the sandbar shark, Carcharhinus plumbeus, before and after population depletion. Fish. Bull. 94, 871–883. doi: 10.2307/1447035
Smith, J. W., and Merriner, J. V. (1986). Observations on the reproductive biology of the cownose ray, Rhinoptera bonasus, in Chesapeake Bay. Fish. Bull. 84, 871–877.
Smith, W. D. (2005). Life History Aspects and Population Dynamics of a Commercially Exploited Stingray, Hypanus Dipterura. Ph.D. thesis. California, CA: Moss Landing Marine Laboratories.
Smith, W. D., Cailliet, G. M., and Cortés, E. (2008). Demography and elasticity of the diamond stingray, Hypanus dipterura: parameter uncertainty. Mar. Freshw. Res. 59, 575–586. doi: 10.1071/MF07020
Smith, W. D., Cailliet, G. M., and Melendez, E. M. (2007). Maturity and growth characteristics of a commercially exploited stingray, Hypanus dipterura. Mar. Freshw. Res. 58, 54–66. doi: 10.1071/MF06083
Stevens, J. D., Bonfil, R., Dulvy, N. K., and Walker, P. A. (2000). The effects of fishing on sharks, rays, and chimaeras (chondrichthyans), and the implications for marine ecosystems. ICES J. Mar. Sci. 57, 476–494. doi: 10.1006/jmsc.2000.0724
Sulikowski, J. A., Morin, M. D., Suk, S. H., and Howell, W. H. (2003). Age and growth estimate of the winter skate (Leuoraja ocellata) in the western Gulf of Maine. Fish. Bull. 101, 405–413.
Sulikowski, J. A., Tsang, P. C. W., and Howell, W. H. (2005). Age and size at sexual maturity for the winter skate, Leucoraja ocellata, in the western Gulf of Maine based on morphological, histological and steroid hormone analyses. Environ. Biol. Fish. 72, 429–441. doi: 10.1007/s10641-004-2866-9
Taylor, C. C. (1958). Cod growth and temperature. ICES J. Mar. Sci. 23, 366–370. doi: 10.1093/icesjms/23.3.366
Thorson, J. T., Cope, J. M., Kleisner, K. M., Samhouri, J. F., Shelton, A. O., and Ward, E. J. (2015). Giants’ shoulders 15 years later: lessons, challenges and guidelines in fisheries meta−analysis. Fish Fish. 16, 342–361. doi: 10.1111/faf.12061
Venables, W. N., and Ripley, B. D. (2002). Modern Applied Statistics With S, 4th Edn. New York, NY: Springer.
Waring, G. T. (1984). Age, growth and mortality of the little skate off the northeast coast of the United States. Trans. Am. Fish. Soc. 113, 314–321. doi: 10.1577/1548-86591984113<314:AGAMOT<2.0.CO;2
White, W. T., Hall, M. E., and Potter, I. C. (2001). Relationship between reproductive biology and age composition and growth in Urolophus lobatus (Batoidea: Urolophidae). Mar. Biol. 138, 135–147. doi: 10.1007/s002270000436
White, W. T., Hall, N. G., and Potter, I. C. (2002). Reproductive biology and growth during pre- and postnatal life of Trygonoptera mucosa and Trygonoptera personata (Batoidea: Urolophidae). Mar. Biol. 140, 699–712. doi: 10.1007/s00227-001-0756-7
White, W. T., Last, P. R., Stevens, J. D., and Yearsley, G. K. (2006). Economically Important Sharks and Rays of Indonesia. Canberra: Australian Centre for International Agricultural Research.
White, W. T., and Potter, I. C. (2005). Reproductive biology, size and age compositions and growth of the batoid Urolophus paucimaculatus, including comparisons with other species of the Urolophidae. Mar. Freshw. Res. 56, 101–110. doi: 10.1071/MF04225
Winemiller, K. O., and Rose, K. A. (1992). Patterns of life-history diversification in North American fishes: implications for population regulation. Can. J. Fish. Aquat. Sci. 49, 2196–2218. doi: 10.1139/f92-242
Keywords: elasmobranchs, finite rate of population increase, demographic analysis, multivariate analysis, principal component analysis, cluster analysis
Citation: Liu K-M, Huang Y-W and Hsu H-H (2021) Management Implications for Skates and Rays Based on Analysis of Life History Parameters. Front. Mar. Sci. 8:664611. doi: 10.3389/fmars.2021.664611
Received: 12 February 2021; Accepted: 28 May 2021;
Published: 06 July 2021.
Edited by:
Nuno Queiroz, Centro de Investigacao em Biodiversidade e Recursos Geneticos (CIBIO-InBIO), PortugalReviewed by:
Brett M. Taylor, University of Guam Marine Laboratory, United StatesKelsey James, Southwest Fisheries Science Center (NOAA), United States
Copyright © 2021 Liu, Huang and Hsu. This is an open-access article distributed under the terms of the Creative Commons Attribution License (CC BY). The use, distribution or reproduction in other forums is permitted, provided the original author(s) and the copyright owner(s) are credited and that the original publication in this journal is cited, in accordance with accepted academic practice. No use, distribution or reproduction is permitted which does not comply with these terms.
*Correspondence: Kwang-Ming Liu, kmliu@mail.ntou.edu.tw