US9538930B2 - Linear multi-domain electrocardiogram - Google Patents
Linear multi-domain electrocardiogram Download PDFInfo
- Publication number
- US9538930B2 US9538930B2 US14/749,697 US201514749697A US9538930B2 US 9538930 B2 US9538930 B2 US 9538930B2 US 201514749697 A US201514749697 A US 201514749697A US 9538930 B2 US9538930 B2 US 9538930B2
- Authority
- US
- United States
- Prior art keywords
- ecg
- waveform
- different
- waveforms
- domain
- Prior art date
- Legal status (The legal status is an assumption and is not a legal conclusion. Google has not performed a legal analysis and makes no representation as to the accuracy of the status listed.)
- Active
Links
Images


Classifications
-
- A—HUMAN NECESSITIES
- A61—MEDICAL OR VETERINARY SCIENCE; HYGIENE
- A61B—DIAGNOSIS; SURGERY; IDENTIFICATION
- A61B5/00—Measuring for diagnostic purposes; Identification of persons
- A61B5/24—Detecting, measuring or recording bioelectric or biomagnetic signals of the body or parts thereof
- A61B5/316—Modalities, i.e. specific diagnostic methods
-
- A61B5/04014—
-
- A—HUMAN NECESSITIES
- A61—MEDICAL OR VETERINARY SCIENCE; HYGIENE
- A61B—DIAGNOSIS; SURGERY; IDENTIFICATION
- A61B5/00—Measuring for diagnostic purposes; Identification of persons
- A61B5/02—Detecting, measuring or recording pulse, heart rate, blood pressure or blood flow; Combined pulse/heart-rate/blood pressure determination; Evaluating a cardiovascular condition not otherwise provided for, e.g. using combinations of techniques provided for in this group with electrocardiography or electroauscultation; Heart catheters for measuring blood pressure
- A61B5/024—Detecting, measuring or recording pulse rate or heart rate
- A61B5/0245—Detecting, measuring or recording pulse rate or heart rate by using sensing means generating electric signals, i.e. ECG signals
-
- A61B5/04017—
-
- A61B5/044—
-
- A—HUMAN NECESSITIES
- A61—MEDICAL OR VETERINARY SCIENCE; HYGIENE
- A61B—DIAGNOSIS; SURGERY; IDENTIFICATION
- A61B5/00—Measuring for diagnostic purposes; Identification of persons
- A61B5/24—Detecting, measuring or recording bioelectric or biomagnetic signals of the body or parts thereof
- A61B5/316—Modalities, i.e. specific diagnostic methods
- A61B5/318—Heart-related electrical modalities, e.g. electrocardiography [ECG]
- A61B5/339—Displays specially adapted therefor
-
- A—HUMAN NECESSITIES
- A61—MEDICAL OR VETERINARY SCIENCE; HYGIENE
- A61B—DIAGNOSIS; SURGERY; IDENTIFICATION
- A61B5/00—Measuring for diagnostic purposes; Identification of persons
- A61B5/68—Arrangements of detecting, measuring or recording means, e.g. sensors, in relation to patient
- A61B5/6801—Arrangements of detecting, measuring or recording means, e.g. sensors, in relation to patient specially adapted to be attached to or worn on the body surface
- A61B5/6813—Specially adapted to be attached to a specific body part
- A61B5/6823—Trunk, e.g., chest, back, abdomen, hip
Landscapes
- Health & Medical Sciences (AREA)
- Life Sciences & Earth Sciences (AREA)
- Engineering & Computer Science (AREA)
- Molecular Biology (AREA)
- Heart & Thoracic Surgery (AREA)
- Physics & Mathematics (AREA)
- Veterinary Medicine (AREA)
- Biophysics (AREA)
- Pathology (AREA)
- Biomedical Technology (AREA)
- Public Health (AREA)
- Medical Informatics (AREA)
- General Health & Medical Sciences (AREA)
- Surgery (AREA)
- Animal Behavior & Ethology (AREA)
- Cardiology (AREA)
- Signal Processing (AREA)
- Physiology (AREA)
- Measurement And Recording Of Electrical Phenomena And Electrical Characteristics Of The Living Body (AREA)
Abstract
Systems and methods are provided to detect a multi-domain ECG waveform. Electrical impulses are detected between at least one pair of electrodes of two or more electrodes placed proximate to a beating heart and are converted to an ECG waveform for each heartbeat of the beating heart. The ECG waveform for at least one heartbeat is received from the detector, the ECG waveform is converted to a frequency domain waveform, the frequency domain waveform is separated into two or more different frequency domain waveforms using two or more different bandpass filters, and the two or more different frequency domain waveforms are converted into two or more different time domain waveforms. The two or more different time domain waveforms are displayed in the same time domain plot as a multi-domain ECG waveform for the at least one heartbeat.
Description
This application is a continuation in part of U.S. patent application Ser. No. 14/662,996, filed Mar. 19, 2015, which is a continuation of PCT Application No. PCT/US15/20828, filed Mar. 16, 2015, which claims the benefit of U.S. Provisional Patent Application Ser. No. 62/008,435, filed Jun. 5, 2014, and this application claims the benefit of U.S. Provisional Patent Application Ser. No. 62/017,185, filed Jun. 25, 2014, the content of all of which is incorporated by reference herein in their entireties.
Electrical signals produced by a human heart were observed through electrodes attached to a patient's skin as early as 1879. Between 1897 and 1911 various methods were used to detect these electrical signals and record a heartbeat in real-time. In 1924, Willem Einthoven was awarded the Nobel Prize in medicine for identifying the various waveforms of a heartbeat and assigning the letters P, Q, R, S, T, U, and J to these waveforms. Since the early 1900s the equipment used for electrocardiography (ECG or EKG) has changed. However, the basic waveforms detected and analyzed have not changed.
An ECG device detects electrical impulses or changes in the electrical potential between two electrodes attached to the skin of a patient as the heart muscle contracts or beats. Electrically, the contraction of the heart is caused by depolarization and repolarization of various parts of the heart muscle. Initially, or at rest, the muscle cells of the heart have a negative charge. In order to cause them to contract, they receive an influx of positive ions Na+ and Ca++. This influx of positive ions is called depolarization. The return of negative ions to bring the heart back to a resting state is called repolarization. Depolarization and repolarization of the heart affects different parts of the heart over time giving rise to the P, Q, R, S, T, U, and J waveforms.
The point in FIG. 2 at which the QRS complex ends and ST segment 260 begins is called J point 255. A J waveform (not shown) can sometimes appear as an elevated J point at J point 255 or as a secondary R waveform. A J waveform is usually characteristic of a specific disease. The J waveform is also referred to as the Osborn wave, camel-hump sign, late delta wave, hathook junction, hypothermic wave, prominent J wave, K wave, H wave or current of injury.
Not shown in FIG. 2 is the U waveform. The U waveform sometimes appears after the T waveform. The U waveform is thought to represent repolarization of the interventricular septum, the papillary muscles, or the Purkinje fibers.
As shown in FIGS. 3 through 6 , as a heart beats, electrical signals flow through all the different muscle tissues of the heart. As shown in FIG. 2 , for the last 100 years conventional ECG devices have been able to detect some of these signals in the form of the P, Q, R, S, T, U, and J waveforms. These waveforms have aided in the diagnosis and treatment of many heart problems. Unfortunately, however, the P, Q, R, S, T, U, and J waveforms do not provide a complete picture of the operation of all the different muscle tissues of the heart. As a result, improved systems and methods are needed to detect and analyze more information from the electrical signals that flow through all the different muscle tissues of the heart as it is beating. This additional information can be used to diagnose and treat many more heart problems.
Before one or more embodiments of the invention are described in detail, one skilled in the art will appreciate that the invention is not limited in its application to the details of construction, the arrangements of components, and the arrangement of steps set forth in the following detailed description. The invention is capable of other embodiments and of being practiced or being carried out in various ways. Also, it is to be understood that the phraseology and terminology used herein is for the purpose of description and should not be regarded as limiting.
A computer system 100 can perform the present teachings. Consistent with certain implementations of the present teachings, results are provided by computer system 100 in response to processor 104 executing one or more sequences of one or more instructions contained in memory 106. Such instructions may be read into memory 106 from another computer-readable medium, such as storage device 110. Execution of the sequences of instructions contained in memory 106 causes processor 104 to perform the process described herein. Alternatively hard-wired circuitry may be used in place of or in combination with software instructions to implement the present teachings. Thus implementations of the present teachings are not limited to any specific combination of hardware circuitry and software.
In various embodiments, computer system 100 can be connected to one or more other computer systems, like computer system 100, across a network to form a networked system. The network can include a private network or a public network such as the Internet. In the networked system, one or more computer systems can store and serve the data to other computer systems. The one or more computer systems that store and serve the data can be referred to as servers or the cloud, in a cloud computing scenario. The other computer systems that send and receive data to and from the servers or the cloud can be referred to as client or cloud devices, for example.
The term “computer-readable medium” as used herein refers to any media that participates in providing instructions to processor 104 for execution. Such a medium may take many forms, including but not limited to, non-volatile media, volatile media, and transmission media. Non-volatile media includes, for example, optical or magnetic disks, such as storage device 110. Volatile media includes dynamic memory, such as memory 106. Transmission media includes coaxial cables, copper wire, and fiber optics, including the wires that comprise bus 102.
Common forms of computer-readable media or computer program products include, for example, a floppy disk, a flexible disk, hard disk, magnetic tape, or any other magnetic medium, a CD-ROM, digital video disc (DVD), a Blu-ray Disc, any other optical medium, a thumb drive, a memory card, a RAM, PROM, and EPROM, a FLASH-EPROM, any other memory chip or cartridge, or any other tangible medium from which a computer can read.
Various forms of computer readable media may be involved in carrying one or more sequences of one or more instructions to processor 104 for execution. For example, the instructions may initially be carried on the magnetic disk of a remote computer. The remote computer can load the instructions into its dynamic memory and send the instructions over a telephone line using a modem. A modem local to computer system 100 can receive the data on the telephone line and use an infra-red transmitter to convert the data to an infra-red signal. An infra-red detector coupled to bus 102 can receive the data carried in the infra-red signal and place the data on bus 102. Bus 102 carries the data to memory 106, from which processor 104 retrieves and executes the instructions. The instructions received by memory 106 may optionally be stored on storage device 110 either before or after execution by processor 104.
In accordance with various embodiments, instructions configured to be executed by a processor to perform a method are stored on a computer-readable medium. The computer-readable medium can be a device that stores digital information. For example, a computer-readable medium includes a compact disc read-only memory (CD-ROM) as is known in the art for storing software. The computer-readable medium is accessed by a processor suitable for executing instructions configured to be executed.
The following descriptions of various implementations of the present teachings have been presented for purposes of illustration and description. It is not exhaustive and does not limit the present teachings to the precise form disclosed. Modifications and variations are possible in light of the above teachings or may be acquired from practicing of the present teachings. Additionally, the described implementation includes software but the present teachings may be implemented as a combination of hardware and software or in hardware alone. The present teachings may be implemented with both object-oriented and non-object-oriented programming systems.
Subwaveform Detection of the P, Q, R, S, T, U, and J Waveforms
As described above, electrical signals flow through all the different muscle tissues of the heart. For the last 100 years conventional ECG devices have been able to detect some of these signals in the form of the P, Q, R, S, T, U, and J waveforms. These waveforms have aided in the diagnosis and treatment of many heart problems.
Unfortunately, however, the P, Q, R, S, T, U, and J waveforms do not provide a complete picture of the operation of all the different muscle tissues of the heart. As a result, improved systems and methods are needed to detect and analyze more information from the electrical signals that flow through all the different muscle tissues of the heart as it is beating. This additional information can be used to diagnose and treat many more heart problems.
In various embodiments, additional information is obtained from the electrical signals produced by a heart through signal processing. More specifically, signal processing is added to an ECG device in order to detect more information from the electrical signals that flow through all the different muscle tissues of the heart as it is beating.
A voltage signal is detected between two electrodes 710 by detector 720. Detector 720 also typically amplifies the voltage signal. Detector 720 can also convert the voltage signal to a digital voltage signal using an analog to digital converter (A/D).
A voltage signal is detected between two electrodes 810 by detector 820. Detector 820 also amplifies the voltage signal. Detector 820 also converts the voltage signal to a digital voltage signal using an analog to digital converter (A/D).
In various embodiments, an ECG device using signal processing to detect one or more subwaveforms within the P, Q, R, S, T, U, and J waveforms and/or within the intervals between the P, Q, R, S, T, U, and J waveforms is herein referred to as a saah ECG device. The voltage difference signals produced by a saah ECG device are referred to as saah ECG waveforms. The term “saah” is an acronym for some of the anatomically distinct portions of muscle tissue that produce subwaveforms. Specifically, saah stands for sinoatrial node (SAN), atria (right atrium (RA) and left atrium (LA)), atrioventricular node (AVN), and bundle of His (HIS). However, a saah ECG waveform is not limited to including subwaveforms representing the SAN, the atria, the AVN, and the HIS. A saah ECG waveform can include any subwaveform the P, Q, R, S, T, U, and J waveforms and/or within the intervals between the P, Q, R, S, T, U, and J waveforms.
In various embodiments, the subwaveforms of a saah ECG waveform are detected using signal processing. Electrodes 810 of the saah ECG of FIG. 8 , for example, receive electrical impulses from anatomically distinct portions of muscle tissue or cells. The electrical impulses of anatomically distinct portions of muscle tissue of the heart have distinct frequencies. Through animal and human experimentation, the distinct frequency, frequency range, or frequency band of the anatomically distinct portions of muscle tissue of the heart are found. These distinct frequency bands of anatomically distinct portions of muscle tissue of the heart provide predetermined data or information for signal processing. In other words, the band pass frequency filtering of the signal processing is determined from the experimental data collected. A saah ECG device then employs one or more frequency band pass filters to detect the one or more subwaveforms.
The signal processing can be performed directly on the time domain signal received from a detector or the time domain signal received from a detector can be converted to the frequency domain for algorithmic processing. In FIG. 10 , block 1030 converts the PR interval time domain signal to a PR interval frequency domain signal. The time domain signal is converted into a frequency domain signal using a Fourier transform, for example.
As described above, through animal and/or human experimentation, the frequency bands associated with depolarization of the SAN, atria, AVN, HIS, and BB of the heart are determined. Based on these frequency bands, band pass filters are created. Blocks 1041-1045 represent the band pass filters created to filter the PR interval frequency domain signal for frequency bands of the SAN, atria, AVN, HIS, and BB of the heart, respectively.
In block 1050, the frequency domain subwaveforms detected from the band pass filtering the frequency bands of the SAN, atria, AVN, HIS, and BB of the heart are summed. In block 1060, the filtered and summed frequency domain signal of the PR interval is converted back to a time domain signal. The frequency domain signal is converted into a time domain signal using a Fourier transform, for example.
The PR interval filtered and summed time domain signal 1070 includes five time domain subwaveforms 910-950. Subwaveforms 910-950 represent depolarization of the SAN, atria, AVN, HIS, and BB of the heart, respectively. Time domain signal 1070 can be used to replace PR interval 1020 in ECG waveform 200, for example. As a result, a saah ECG waveform is produced.
In block 1130, the detected and amplified heart signals are processed using a signal processor. The signal processor detects the conventional P, Q, R, S, T, U, and J waveforms and sends them to the display of block 1160. The signal processor also detects or calculates subwaveforms within the conventional P, Q, R, S, T, U, and J waveforms and/or within intervals between the conventional P, Q, R, S, T, U, and J waveforms. The signal processor sends the subwaveforms to block 1140 for further processing. The processor of block 1140 produces the saah ECG waveform that includes the subwaveforms and sends the saah ECG waveform to the display of block 1160. The processor of block 1140 calculates additional information or new data from the saah ECG waveform. This new data can include, but is not limited to, timing information about the subwaveforms, timing information about the intervals between the subwaveforms, and timing information about the subwaveforms and their relation to the conventional P, Q, R, S, T, U, and J waveforms. In block 1150, this new data is sent to the display of block 1160.
The display of block 1160 displays a continuous loop of the conventional ECG waveform, the saah ECG waveform, and the new data from the subwaveforms. The display of block 1160 can display this information on an electronic display or print it on paper. The display of block 1160 can also record this information. The display of block 1160 can record this information on any type of memory device.
In block 1330, the sampled heart signals are processed using a signal processor. The signal processor produces four different types of information from the sampled heart signals. As shown in block 1340, the signal processor produces conventional ECG waveforms including the conventional P, Q, R, S, T, U, and J waveforms and sends them to display 1380. As shown in block 1350, the signal processor produces saah ECG waveforms. These saah ECG waveforms include subwaveforms of the conventional P, Q, R, S, T, U, and J waveforms and the intervals between them. Note that the arrow between blocks 1330 and 1350 show information following in both directions. This shows that information from the saah ECG waveforms is further analyzed by the signal processor.
As shown in block 1360, the signal processor further analyzes the saah ECG waveforms to produce saah ECG data. This saah ECG data is sent to display 1380. Additionally, as shown in block 1370, the signal processor further analyzes the saah to obtain endocardium and epicardium data. This data is compared to recorded normal and abnormal data. The signal processor then produces automatic pattern recognition diagnosis (APD) information, and this information is sent to display 1380. APD information is, for example, patterns and/or colors that allows a user to easily and quickly determine that normal or abnormal endocardium and/or epicardium data was found.
In various embodiments, the additional information provided by a saah ECG device can be used to diagnose heart problems that cannot be diagnosed using conventional ECG devices or cannot easily be diagnosed using conventional ECG devices. The additional information provided by a saah ECG device can also be used in the treatment of heart problems or the assessment of these treatments.
Plot 1500 shows before saah ECG waveform 1510, before conventional ECG waveform 1520, after saah ECG waveform 1530, and after conventional ECG waveform 1540. Waveforms 1510, 1520, 1530, and 1540 are produced for example using a saah ECG device. A saah ECG device also produces conventional ECG waveforms for comparison with the saah ECH waveforms. Waveforms 1510, 1520, 1530, and 1540 are produced using a V4 electrode, for example. A V4 electrode is placed in the fifth intercostal space (between ribs 5 and 6) in the mid-clavicular line, for example.
As described above, saah ECG waveforms show subwaveforms of the conventional P, Q, R, S, T, U, and J waveforms and the intervals between them. These subwaveforms provide more information on the function of specific and anatomically distinct portions of the muscle tissue of the heart.
For example, arrows 1503 and 1506 point to areas of two beats of before saah ECG waveform 1510 where the subwaveform showing the depolarization of the bundle branches (BB) is missing. Arrows 1501, 1502, 1504, and 1505 point to areas of four beats where the subwaveform showing the depolarization of the BB appears as half of the normal subwaveform. As a result, in two of the six beats of before ECG waveform 1510 the subwaveform representing the BB is missing, and in four of the six beats of before saah ECG waveform 1510 the subwaveform representing the BB is abnormal. A normal subwaveform representing the BB has a shape, for example, like subwaveform 950 of FIG. 9 .
This information from before saah ECG waveform 1510 of FIG. 15 regarding the BB can be used to diagnose the specific abnormal pathway present in this case of WPW syndrome. Further this information can be used to determine the treatment. In contrast, none of this information can be obtained from before conventional ECG waveform 1520.
In addition to providing a saah ECG waveform, a saah ECG device can provide additional data regarding the subwaveforms found. For example, plot 1500 includes subwaveform timing information for the PR interval of each heartbeat. This timing information is provided as timing diagrams 1551-1556 for the six heartbeats. Each timing diagram provides a numeral value for the period of the PR interval and a horizontal stacked bar graph depicting how four time intervals containing one or more subwaveforms are distributed with PR interval time period. The horizontal stacked bar graphs can include different colors, patterns, or shades, for example.
The first interval of each horizontal stacked bar graph is the interval that includes the subwaveform representing the depolarization of the sinoatrial node (SAN). The second interval is the interval that includes the subwaveforms representing the depolarization of the atria (right atrium (RA) and left atrium (LA)) and the atrioventricular node (AVN). The third interval is the interval that includes the subwaveform representing the depolarization of the bundle of His (HIS) of the beating heart. The fourth interval is the interval that includes the subwaveform representing the depolarization of the bundle branches (BB).
A comparison of the horizontal stacked bar graphs of timing diagrams 1551-1556 shows that the periods of the four intervals vary widely over the six heartbeats. This is also an indication of the underlying disease. This timing information is not available in before conventional ECG waveform 1520.
RFA was performed on the patient presenting before saah ECG waveform 1510 and before conventional ECG waveform 1520. A muscular conduction bridge connecting the right atrium and the right ventricle (bundle of Kent) and a connections between the A-V bundle and the interventricular septum (Mahaim's connections) were ablated, for example.
After treatment with RFA, the patient's return to a normal heartbeat can be confirmed with after saah ECG waveform 1530. For example, arrows 1531-1536 of the six heartbeats shown in after saah ECG waveform 1530 point to areas that show that the subwaveform of the BB has returned in all six heartbeats after treatment. In contrast, after conventional ECG waveform 1540 cannot provide this information.
In addition, a comparison of the horizontal stacked bar graphs of timing diagrams 1571-1576 for after saah ECG waveform 1530 shows that the periods of the four intervals of the PR interval do not vary widely over the six heartbeats. This is also an indication of the effectiveness of the RFA treatment. This timing information is not available in after conventional ECG waveform 1540.
System for Detecting ECG Subwaveforms
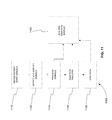
In various embodiments, an electrocardiography (ECG) system for detecting one or more subwaveforms within the P, Q, R, S, T, U, and J waveforms or in an interval between the P, Q, R, S, T, U, and J waveforms is provided. Returning to FIG. 8 , the ECG system includes two or more electrodes 810, a detector 820, a signal processor 830, and a display device 840.
Two or more electrodes 810 are placed proximate to a beating heart that receive electrical impulses from the beating heart. Two or more electrodes 810 are shown in FIG. 8 as noninvasive electrodes that are attached to the skin of a patient. In various embodiments, two or more electrodes 810 can be invasive electrodes placed directly on or within heart tissue.
In various embodiments, the detected one or more subwaveforms include at least one subwaveform representing depolarization of the sinoatrial node (SAN), the atria (right atrium (RA) and left atrium (LA)), the atrioventricular node (AVN), the bundle of His (HIS), or the bundle branches (BB) of the beating heart.
In various embodiments, the display device 840 further displays the ECG waveform for comparison with the processed ECG waveform.
In various embodiments, signal processor 830 further calculates timing information about the one or more subwaveforms, timing information about the intervals between the one or more subwaveforms, and timing information about the one or more subwaveforms and their relation to the P, Q, R, S, T, U, and J waveforms of the ECG waveform for each heartbeat. Display device 840 further receives this timing information from signal processor 830. Display device 840 displays the timing information about the one or more subwaveforms, the timing information about the intervals between the one or more subwaveforms, and the timing information about the one or more subwaveforms and their relation to the P, Q, R, S, T, U, and J waveforms of the ECG waveform for each heartbeat.
In various embodiments the ECG system further includes a memory device (not shown). The memory device receives the ECG waveform and the processed ECG waveform from the signal processor.
In various embodiments, the memory device further includes normal processed ECG waveform data. Normal processed ECG waveform data is stored on the memory device using signal processor 830 or a general purpose processor (not shown). Signal processor 830 further compares the processed ECG waveform to the normal processed ECG waveform data and calculates a status condition based on the comparison. The status conditions are, for example, normal, suspicious, or abnormal.
In various embodiments, the ECG system includes a second display device (not shown) surrounding a rotating button (not shown). Signal processor 830 further sends a colored pattern to the second display device based on the status condition. The second display device provides automatic pattern recognition diagnosis (APD).
Method for Detecting ECG Subwaveforms
In step 1610 of method 1600, electrical impulses are detected between at least one pair of electrodes of two or more electrodes placed proximate to a beating heart using a detector. The electrical impulses are converted to an ECG waveform for each heartbeat of the beating heart using the detector.
In step 1620, the ECG waveform for each heartbeat is received from the detector using a signal processor. One or more subwaveforms within P, Q, R, S, T, U, and J waveforms of the ECG waveform for each heartbeat or in an interval between the P, Q, R, S, T, U, and J waveforms that represent the depolarization or repolarization of an anatomically distinct portion of muscle tissue of the beating heart are detected using the signal processor. A processed ECG waveform that includes the one or more subwaveforms for each heartbeat is produced using the signal processor.
In step 1630, the processed ECG waveform is received from the signal processor and the processed ECG waveform is displayed using a display device.
Computer Program Product for Detecting ECG Subwaveforms
In various embodiments, computer program products include a tangible computer-readable storage medium whose contents include a program with instructions being executed on a processor so as to perform a method for detecting subwaveforms within the P, Q, R, S, T, U, and J waveforms of an ECG waveform of a heartbeat or in an interval between the P, Q, R, S, T, U, and J waveforms. This method is performed by a system that includes one or more distinct software modules.
Multi-Domain ECG
The heart muscle, like other muscles, is activated by biologically generated electrical signals. Electrocardiography (ECG or EKG) has long been used to measure and record these electrical signals. Essentially, in ECG the electrical activity of the heart is measured from a number of different points on the body and plotted over time. As a result, ECG traces out each cardiac cycle or heartbeat as a voltage versus time waveform.
A human heart has two functional systems. The first system, referred to as a self-conduction system, is part of the atrium (including left and right atria). In a traditional ECG, the self-conduction system is represented by the P wave or PR interval. The excitation, rhythm and conduction of every beat is completed by the collaboration of all parts of the heart, which is an axis system, including: sinoatrial node (SAN)-atrial-atrioventricular node (AVN)-Bundle of His-Bundle Branches (left and right). The Bundle of His is a collection of heart muscle cells specialized for electrical conduction that transmits the electrical impulses from the AVN to the point of the apex of the fascicular branches. Complex arrhythmias disease typically occurs in these different areas. However, ECG is only half of a sine wave.
The second system, referred to as a cardiac work system, is a pump system (one for each complete contraction and relaxation of the heart), which is done by the heart muscles. The main part of the second system is the left ventricle. In the traditional ECG, it is represented by the T wave or QT interval. There are about 10 million ventricular myocardial cells, without nerves or tracts.
Features or waves of each heartbeat waveform have been known for more than a century to correspond to electrical signals activating various parts of the heart. For example, the P wave is known to result from an electrical signal directed from the SAN to the AV node activating the atrium of the heart, to the Bundle of His to the left and right Bundle Branches, and the T wave is known to result from a recovery electrical signal (ventricular depolarization and repolarization) sent to the ventricles of the heart after they have contracted. As a result, physicians are able to diagnose specific heart problems by analyzing the shapes and time of these waves.
It is thought that an ECG heartbeat waveform includes much more information about the anatomy of the heart that is not being used (scanning and displaying). In particular, it is thought that at least some of the waves in an ECG heartbeat waveform include subwaveforms that provide more detailed information about parts of the heart, as described above. Consequently, there is a need for systems and methods for processing biological electrical signals, such as signals read by ECG, in order to provide additional information about anatomical structures.
Also, electrocardiogram information itself contains a lot of information that has not been discovered so far, leaving numerous puzzles in a clinical application.
In various embodiments, new waveforms are created from a conventional ECG waveform. New indexes and new parameters are obtained from the new waveforms, so that it is possible to have breakthrough in electrocardiogram diagnostics.
In various embodiments, heart signals are divided into different frequency bands, and then convolved or combined in one diagram. For example, 16 different frequency bands can be used. This procedure is based on the study of ergonomics and analysis procedures for frequently used information in cybernetics and nonlinear theory. The procedure makes use of the theory and analysis index of an “electrocardiogram multi-phase signal,” and by using a new method of frequency division and dimension division, according to the display method of P, Q, R, S, T, U, and J waveforms P-QRS-T in a conventional ECG waveform. Heart diseases are also related to and/or complicated by different other diseases. Therefore, different numbers of frequency ranges are required to be displayed as a diagnostic requirement, because the frequency shifts of various diseases are different. In the multi-domain frequency division method, 8, 9, 10, 11, 12, 13, 14, 15, or 16 roots of multi-domain linear waveforms are displayed, and total of 12 leads are individually displayed. If each lead is divided into 16 waveforms, there are totally 192 ECG waveforms, providing much more information. In various embodiments, multi-domain ECG (mdECG) can be used as a very valuable and new diagnostic technique for combined heart diseases. This technique can be applied in electrocardiograph, monitor, echocardiography, and invasive electrophysiological instrument.
Since the invention of ECG, the linear waveform shaped like a rope has been used. Its frequency response range is 0-150 Hz and all subwaveforms are convolved or combined together. However, heart signals are formed by combining different ultra-low frequency, low frequency, intermediate frequency, high frequency, and ultra-high frequency signals. Because in ECG all frequencies are convolved together, many fine, weak, and very valuable signals are usually submerged or overlapped by the high frequency; especially at ventricle (ECG at T-wave, ECG ‘T’ wave duration) and atrium (ECG at P-wave, ECG ‘P’ wave duration), and numerous signals accumulate within a very small time axis range, causing problems and confusion in accuracy of ECG diagnosis rate. As a result, the detection rate of ECG for acute myocardial infarction (AMI), acute coronary syndrome (ACS), coronary artery disease (CAD), myocardial infarction (MI), heart failure (HF) etc., with the highest incidence of cardiovascular disease is only 17%-25%. Based on a large number of literatures and research reports, for the CAD/MI/ACS patient, ECG begins to change only after ischemia reaches 70%, and only about half of the electrocardiograms show abnormality. There are 7 billion people in the world, and the percentage of people who die of cardiovascular diseases or complicated cardiovascular diseases is about 42.86% (3/7). Electrocardiogram is the most fundamental clinical assessment instrument, and it is simple, fast and economical. Therefore, it is important to improve the clinical ECG diagnosis rate, which is possible only by improving the waveform display rate of ECG.
In various embodiments, systems and methods improve the waveform display rate of ECG and clinical diagnosis rate using a 16 linear multi-domain electrocardiogram. Because the heart signals are separated according to different frequency bands with frequency bands being recombined, many high frequency signal, ultra-high frequency signal, low frequency signal, and ultra-low frequency signal are displayed with the heart raw signals at different frequency band according to the heart transduction pathway and electrophysiological rule, without the electrocardiogram being altered, i.e., at X-transverse axis and Y-vertical axis of P-QRS-T. Because the frequency bands of ECG are combined signals, mdECG separates the signals, i.e., separates them into independent waveforms consisting of different frequency bands. In this way, those frequency bands with the one linear waveform invisible and obscure in traditional ECG can be displayed clearly with different frequency bands one by one, assisting the doctor in reading, analyzing, judging and basic clinical assessment.
The signal processing can be performed directly on the time domain signal received from a detector or the time domain signal received from a detector can be converted to the frequency domain for algorithmic processing. In FIG. 18 , block 1830 converts sampled ECG waveform 1820 to a frequency domain signal. The time domain signal is converted into a frequency domain signal using a Fourier transform, for example.
As described above, through animal and/or human experimentation, the frequency bands associated with different muscles of the heart can be determined. The frequency bands used here can be based on those bands determined experimentally, for example. Alternatively, the 16 frequency bands can be found by dividing the total frequency bands 16 ways. The different band can have the same bandwidth or can have different bandwidths.
In block 1840, 16 different band pass filters filter sampled ECG waveform 1820's frequency domain signal into 16 different frequency domain signal. These 16 different 16 different frequency domain signals are then convert back to the time domain. The result of block 1840 is 16 different time domain signals.
In block 1850, the 16 different time domain signals are combined or plotted together in the time domain as one multi-domain ECG waveform 1860. In FIG. 1800 , a conventional ECG signal from one electrode is processed into a multi-domain ECG waveform that includes 16 different time domain signals. In various embodiments, a conventional ECG signal from one electrode, however, can be processed into a multi-domain ECG waveform that includes any number of different time domain signals.
In various embodiments, a multi-domain ECG waveform is generated for each electrode.
Converting a conventional ECG waveform into a multi-domain ECG waveform that includes many different time domain signals can provide important clinical information.
System for Detecting a Multi-Domain ECG Waveform
In various embodiments, an electrocardiography (ECG) system is provided for detecting a multi-domain ECG waveform that includes two or more different time domain signals that each represent a different frequency domain signal. Returning to FIG. 8 , the ECG system includes two or more electrodes 810, a detector 820, a signal processor 830, and a display device 840.
Two or more electrodes 810 are placed proximate to a beating heart that receive electrical impulses from the beating heart. Two or more electrodes 810 are shown in FIG. 8 as noninvasive electrodes that are attached to the skin of a patient. In various embodiments, two or more electrodes 810 can be invasive electrodes placed directly on the surface of the heart or within heart tissue.
In various embodiments, display device 840 further displays the ECG waveform for at least one heartbeat of the beating heart. Display device 840 further aligns the display of the multi-domain ECG waveform and the display of ECG waveform in the time domain.
In various embodiments, display device 840 displays each time domain waveform of the two or more different time domain waveforms in a different color. In various alternative embodiments, display device 840 displays each time domain waveform of the two or more different time domain waveforms in a different pattern of dashes.
Method for Detecting a Multi-Domain ECG Waveform
In step 2410 of method 2400, electrical impulses are detected between at least one pair of electrodes of two or more electrodes placed proximate to a beating heart using a detector. The electrical impulses are converted to an ECG waveform for each heartbeat of the beating heart using the detector.
In step 2420, the ECG waveform for at least one heartbeat is received from the detector, the ECG waveform is converted to a frequency domain waveform, the frequency domain waveform is separated into two or more different frequency domain waveforms using two or more different bandpass filters, and the two or more different frequency domain waveforms are converted into two or more different time domain waveforms using a signal processor.
In step 2430, the two or more different time domain waveforms are displayed in the same time domain plot as a multi-domain ECG waveform for the at least one heartbeat of the beating heart using a display device.
The foregoing disclosure of the preferred embodiments of the present invention has been presented for purposes of illustration and description. It is not intended to be exhaustive or to limit the invention to the precise forms disclosed. Many variations and modifications of the embodiments described herein will be apparent to one of ordinary skill in the art in light of the above disclosure. The scope of the invention is to be defined only by the claims appended hereto, and by their equivalents.
Further, in describing representative embodiments of the present invention, the specification may have presented the method and/or process of the present invention as a particular sequence of steps. However, to the extent that the method or process does not rely on the particular order of steps set forth herein, the method or process should not be limited to the particular sequence of steps described. As one of ordinary skill in the art would appreciate, other sequences of steps may be possible. Therefore, the particular order of the steps set forth in the specification should not be construed as limitations on the claims. In addition, the claims directed to the method and/or process of the present invention should not be limited to the performance of their steps in the order written, and one skilled in the art can readily appreciate that the sequences may be varied and still remain within the spirit and scope of the present invention.
Claims (20)
1. A noninvasive electrocardiography (ECG) system for detecting a multi-domain ECG waveform that includes two or more different time domain signals that each represent a different frequency domain signal, comprising:
two or more electrodes adapted to be located near a beating heart of a patient and attached to the skin of the patient that receive electrical impulses from the beating heart;
a detector that detects the electrical impulses from at least one pair of electrodes of the two or more electrodes and converts the electrical impulses to an ECG waveform for each heartbeat of the beating heart;
a signal processor that receives the ECG waveform for at least one heartbeat from the detector, converts the ECG waveform to a frequency domain waveform, separates the frequency domain waveform into two or more different frequency domain waveforms using two or more different bandpass filters, and converts the two or more different frequency domain waveforms into two or more different time domain waveforms; and
a display device that displays the two or more different time domain waveforms in the same time domain plot as a multi-domain ECG waveform for the at least one heartbeat of the beating heart.
2. The ECG system of claim 1 , wherein the signal processor separates the frequency domain waveform into two or more different frequency domain waveforms by dividing the frequency band of the ECG waveform into two or more different frequency bands and filtering the two or more different frequency bands using the two or more different bandpass filters.
3. The ECG system of claim 2 , wherein each of the two or more different frequency bands has the same bandwidth.
4. The ECG system of claim 2 , wherein each of the two or more different frequency bands can have different bandwidths.
5. The ECG system of claim 2 , wherein the two or more different frequency bands are contiguous across the frequency band of the ECG waveform.
6. The ECG system of claim 2 , wherein the two or more different frequency bands are not contiguous across the frequency band of the ECG waveform.
7. The ECG system of claim 1 , wherein the display device further displays the ECG waveform for at least one heartbeat of the beating heart.
8. The ECG system of claim 7 , wherein the display device further aligns the display of the multi-domain ECG waveform and the display of ECG waveform in the time domain.
9. The ECG system of claim 1 , wherein the two or more different frequency domain waveforms comprise 16 different frequency domain waveforms, and the two or more different time domain waveforms comprise 16 different time domain waveforms.
10. The ECG system of claim 1 , wherein the display device displays each time domain waveform of the two or more different time domain waveforms in a different color.
11. The ECG system of claim 1 , wherein the display device displays each time domain waveform of the two or more different time domain waveforms in a different pattern of dashes.
12. An invasive electrocardiography (ECG) system for detecting a multi-domain ECG waveform that includes two or more different time domain signals that each represent a different frequency domain signal, comprising:
two or more electrodes adapted to be placed directly on a surface of a beating heart of a patient that receive electrical impulses from the beating heart;
a detector that detects the electrical impulses from at least one pair of electrodes of the two or more electrodes and converts the electrical impulses to an ECG waveform for each heartbeat of the beating heart;
a signal processor that receives the ECG waveform for at least one heartbeat from the detector, converts the ECG waveform to a frequency domain waveform, separates the frequency domain waveform into two or more different frequency domain waveforms using two or more different bandpass filters, and converts the two or more different frequency domain waveforms into two or more different time domain waveforms; and
a display device that displays the two or more different time domain waveforms in the same time domain plot as a multi-domain ECG waveform for the at least one heartbeat of the beating heart.
13. The ECG system of claim 12 , wherein the signal processor separates the frequency domain waveform into two or more different frequency domain waveforms by dividing the frequency band of the ECG waveform into two or more different frequency bands.
14. The ECG system of claim 13 , wherein each of the two or more different frequency bands has the same bandwidth.
15. The ECG system of claim 13 , wherein each of the two or more different frequency bands can have different bandwidths.
16. The ECG system of claim 13 , wherein the two or more different frequency bands are contiguous across the frequency band of the ECG waveform.
17. The ECG system of claim 13 , wherein the two or more different frequency bands are not contiguous across the frequency band of the ECG waveform.
18. The ECG system of claim 12 , wherein the display device further displays the ECG waveform for at least one heartbeat of the beating heart.
19. The ECG system of claim 18 , wherein the display device further aligns the display of the multi-domain ECG waveform and the display of ECG waveform in the time domain.
20. The ECG system of claim 12 , wherein the two or more different frequency domain waveforms comprise 16 different frequency domain waveforms, and the two or more different time domain waveforms comprise 16 different time domain waveforms.
Priority Applications (11)
| Application Number | Priority Date | Filing Date | Title |
|---|---|---|---|
| US14/749,697 US9538930B2 (en) | 2014-06-05 | 2015-06-25 | Linear multi-domain electrocardiogram |
| US15/393,135 US9999364B2 (en) | 2014-06-05 | 2016-12-28 | Systems and methods for providing cardiac electrophysiological markers |
| US15/712,469 US10117635B2 (en) | 2014-06-05 | 2017-09-22 | Electronic acoustic stethoscope with ECG |
| US15/904,543 US10085663B2 (en) | 2014-06-05 | 2018-02-26 | Automated ECG analysis and diagnosis system |
| US15/961,952 US10092201B2 (en) | 2014-06-05 | 2018-04-25 | Accurate ECG I-point and J-point detection and measurement |
| US15/998,487 US10631750B2 (en) | 2014-06-05 | 2018-08-16 | Using aiECG to automatically track, navigate and measure ECG waveform data and parameters data |
| US16/114,025 US10646130B2 (en) | 2014-06-05 | 2018-08-27 | Method for recognizing point quantification standard elevation or depression near the equipotential line of each heartbeat |
| US16/157,178 US10729351B1 (en) | 2014-06-05 | 2018-10-11 | Artificial intelligence (AI) electrocardiogram (ECG) |
| US16/561,304 US11134882B1 (en) | 2014-06-05 | 2019-09-05 | Classification of ST waves and ST segment type |
| US16/595,395 US11191473B1 (en) | 2014-06-05 | 2019-10-07 | Generation of vital sign monitoring |
| US17/394,494 US11896381B1 (en) | 2014-06-05 | 2021-08-05 | Classification of ST waves and ST segment type |
Applications Claiming Priority (5)
| Application Number | Priority Date | Filing Date | Title |
|---|---|---|---|
| US201462008435P | 2014-06-05 | 2014-06-05 | |
| US201462017185P | 2014-06-25 | 2014-06-25 | |
| PCT/US2015/020828 WO2015187229A1 (en) | 2014-06-05 | 2015-03-16 | Systems and methods for detecting ecg subwaveforms |
| US14/662,996 US9339204B2 (en) | 2014-06-05 | 2015-03-19 | Systems and methods for detecting ECG subwaveforms |
| US14/749,697 US9538930B2 (en) | 2014-06-05 | 2015-06-25 | Linear multi-domain electrocardiogram |
Related Parent Applications (1)
| Application Number | Title | Priority Date | Filing Date |
|---|---|---|---|
| US14/662,996 Continuation-In-Part US9339204B2 (en) | 2014-06-05 | 2015-03-19 | Systems and methods for detecting ECG subwaveforms |
Related Child Applications (1)
| Application Number | Title | Priority Date | Filing Date |
|---|---|---|---|
| US15/393,135 Continuation-In-Part US9999364B2 (en) | 2014-06-05 | 2016-12-28 | Systems and methods for providing cardiac electrophysiological markers |
Publications (2)
| Publication Number | Publication Date |
|---|---|
| US20150351651A1 US20150351651A1 (en) | 2015-12-10 |
| US9538930B2 true US9538930B2 (en) | 2017-01-10 |
Family
ID=54768606
Family Applications (1)
| Application Number | Title | Priority Date | Filing Date |
|---|---|---|---|
| US14/749,697 Active US9538930B2 (en) | 2014-06-05 | 2015-06-25 | Linear multi-domain electrocardiogram |
Country Status (1)
| Country | Link |
|---|---|
| US (1) | US9538930B2 (en) |
Families Citing this family (2)
| Publication number | Priority date | Publication date | Assignee | Title |
|---|---|---|---|---|
| KR102446329B1 (en) * | 2016-12-01 | 2022-09-22 | 삼성전자주식회사 | Device For Providing Health Management Service and Method Thereof |
| US11762445B2 (en) * | 2017-01-09 | 2023-09-19 | Inmusic Brands, Inc. | Systems and methods for generating a graphical representation of audio signal data during time compression or expansion |
Citations (39)
| Publication number | Priority date | Publication date | Assignee | Title |
|---|---|---|---|---|
| US4157711A (en) * | 1977-04-01 | 1979-06-12 | Ramot University Authority For Applied Research & Industrial Development Ltd. | Electrocardiograph apparatus capable of discerning the H-wave in the P-Q interval |
| US4680708A (en) * | 1984-03-20 | 1987-07-14 | Washington University | Method and apparatus for analyzing electrocardiographic signals |
| US4751931A (en) * | 1986-09-22 | 1988-06-21 | Allegheny-Singer Research Institute | Method and apparatus for determining his-purkinje activity |
| US6397100B2 (en) * | 1999-03-29 | 2002-05-28 | Medtronic, Inc. | Axis shift analysis of electrocardiogram signal parameters especially applicable for multivector analysis by implantable medical devices, and use of same |
| US20020068875A1 (en) * | 1995-12-11 | 2002-06-06 | Intermedics, Inc. | Implantable medical device responsive to heart rate variability analysis |
| US20020138014A1 (en) * | 2001-01-17 | 2002-09-26 | Baura Gail D. | Method and apparatus for hemodynamic assessment including fiducial point detection |
| US20030120165A1 (en) * | 2001-12-20 | 2003-06-26 | Anders Bjorling | Method and apparatus for detection of premature atrial contraction |
| US20030139678A1 (en) * | 1999-06-10 | 2003-07-24 | Harbinger Medical, Inc. | Method of noninvasively determining a patient's susceptibility to arrhythmia |
| US20040260169A1 (en) * | 2001-09-21 | 2004-12-23 | Karsten Sternnickel | Nonlinear noise reduction for magnetocardiograms using wavelet transforms |
| US20050105717A1 (en) * | 2001-06-29 | 2005-05-19 | Lawrie Craig T. | Telephony interface apparatus |
| US6931273B2 (en) * | 2000-04-11 | 2005-08-16 | University Of California San Francisco | Database of body surface ECG P wave integral maps for localization of left-sided atrial arrhythmias |
| US20060036183A1 (en) * | 2002-03-26 | 2006-02-16 | Vivometrics Inc. | Method and system for extracting cardiac parameters from plethysmographic signals |
| US20060247698A1 (en) * | 2005-04-28 | 2006-11-02 | Burnes John E | Multi-site PESP with fusion pacing |
| US20060264768A1 (en) * | 2005-05-13 | 2006-11-23 | Cardiocore Lab, Inc. | Method and apparatus for sequenced extraction from electrocardiogramic waveforms |
| US20070032733A1 (en) * | 2004-01-16 | 2007-02-08 | David Burton | Method and apparatus for ECG-derived sleep disordered breathing monitoring, detection and classification |
| US20070276270A1 (en) * | 2006-05-24 | 2007-11-29 | Bao Tran | Mesh network stroke monitoring appliance |
| US20070273504A1 (en) * | 2006-05-16 | 2007-11-29 | Bao Tran | Mesh network monitoring appliance |
| US20080001735A1 (en) * | 2006-06-30 | 2008-01-03 | Bao Tran | Mesh network personal emergency response appliance |
| US20080004904A1 (en) * | 2006-06-30 | 2008-01-03 | Tran Bao Q | Systems and methods for providing interoperability among healthcare devices |
| US20080027341A1 (en) * | 2002-03-26 | 2008-01-31 | Marvin Sackner | Method and system for extracting cardiac parameters from plethysmographic signals |
| US20080109041A1 (en) * | 2006-11-08 | 2008-05-08 | De Voir Christopher S | Wavelet based feature extraction and dimension reduction for the classification of human cardiac electrogram depolarization waveforms |
| US7787951B1 (en) * | 2003-12-24 | 2010-08-31 | Pacesetter, Inc. | System and method for determining optimal stimulation sites based on ECG information |
| US7894885B2 (en) * | 2007-05-02 | 2011-02-22 | Biosense Webster, Inc. | Coherent signal rejection in ECG |
| US20110077538A1 (en) * | 2009-09-11 | 2011-03-31 | Agency For Science, Technology And Research | Electrocardiogram signal processing system |
| US20110201951A1 (en) * | 2010-02-12 | 2011-08-18 | Siemens Medical Solutions Usa, Inc. | System for cardiac arrhythmia detection and characterization |
| US20110245702A1 (en) * | 2001-12-07 | 2011-10-06 | The University Of Sussex | Electrodynamic sensors and applications thereof |
| US20120004564A1 (en) * | 2005-02-07 | 2012-01-05 | Cardiosync, Inc. | Devices and method for accelerometer-based characterization of cardiac synchrony and dyssynchrony |
| US20120123232A1 (en) * | 2008-12-16 | 2012-05-17 | Kayvan Najarian | Method and apparatus for determining heart rate variability using wavelet transformation |
| US20120157865A1 (en) * | 2010-12-20 | 2012-06-21 | Yosef Stein | Adaptive ecg wandering correction |
| US20120157822A1 (en) * | 2009-06-24 | 2012-06-21 | Cortius Holding B.V. | Inverse Imaging of Electrical Activity of a Heart Muscle |
| USRE43569E1 (en) * | 2002-12-09 | 2012-08-07 | ECG-Tech Corp. | Three dimensional vector cardiograph and method for detecting and monitoring ischemic events |
| US8306265B2 (en) * | 2009-01-12 | 2012-11-06 | Eastman Kodak Company | Detection of animate or inanimate objects |
| US20120283587A1 (en) * | 2011-05-03 | 2012-11-08 | Medtronic, Inc. | Assessing intra-cardiac activation patterns and electrical dyssynchrony |
| US20130158421A1 (en) * | 2011-12-20 | 2013-06-20 | National Taiwan University | System and method for evaluating cardiovascular performance in real time and characterized by conversion of surface potential into multi-channels |
| US20130172691A1 (en) * | 2006-05-16 | 2013-07-04 | Bao Tran | Health monitoring appliance |
| US20140257058A1 (en) * | 2011-10-19 | 2014-09-11 | Scanadu Incorporated | Automated personal medical diagnostic system, method, and arrangement |
| US20140275928A1 (en) * | 2013-03-15 | 2014-09-18 | Peerbridge Health, Inc. | System and method for monitoring and diagnosing patient condition based on wireless sensor monitoring data |
| US20140357995A1 (en) * | 2013-06-04 | 2014-12-04 | Intelomed, Inc. | Hemodynamic risk severity based upon detection and quantification of cardiac dysrhythmia behavior using a pulse volume waveform |
| US20150351653A1 (en) * | 2014-06-05 | 2015-12-10 | Chen Guangren | Systems and Methods for Detecting ECG Subwaveforms |
-
2015
- 2015-06-25 US US14/749,697 patent/US9538930B2/en active Active
Patent Citations (49)
| Publication number | Priority date | Publication date | Assignee | Title |
|---|---|---|---|---|
| US4157711A (en) * | 1977-04-01 | 1979-06-12 | Ramot University Authority For Applied Research & Industrial Development Ltd. | Electrocardiograph apparatus capable of discerning the H-wave in the P-Q interval |
| US4680708A (en) * | 1984-03-20 | 1987-07-14 | Washington University | Method and apparatus for analyzing electrocardiographic signals |
| US4751931A (en) * | 1986-09-22 | 1988-06-21 | Allegheny-Singer Research Institute | Method and apparatus for determining his-purkinje activity |
| US20020068875A1 (en) * | 1995-12-11 | 2002-06-06 | Intermedics, Inc. | Implantable medical device responsive to heart rate variability analysis |
| US6397100B2 (en) * | 1999-03-29 | 2002-05-28 | Medtronic, Inc. | Axis shift analysis of electrocardiogram signal parameters especially applicable for multivector analysis by implantable medical devices, and use of same |
| US20030139678A1 (en) * | 1999-06-10 | 2003-07-24 | Harbinger Medical, Inc. | Method of noninvasively determining a patient's susceptibility to arrhythmia |
| US6931273B2 (en) * | 2000-04-11 | 2005-08-16 | University Of California San Francisco | Database of body surface ECG P wave integral maps for localization of left-sided atrial arrhythmias |
| US20020138014A1 (en) * | 2001-01-17 | 2002-09-26 | Baura Gail D. | Method and apparatus for hemodynamic assessment including fiducial point detection |
| US20050105717A1 (en) * | 2001-06-29 | 2005-05-19 | Lawrie Craig T. | Telephony interface apparatus |
| US20040260169A1 (en) * | 2001-09-21 | 2004-12-23 | Karsten Sternnickel | Nonlinear noise reduction for magnetocardiograms using wavelet transforms |
| US20110245702A1 (en) * | 2001-12-07 | 2011-10-06 | The University Of Sussex | Electrodynamic sensors and applications thereof |
| US20030120165A1 (en) * | 2001-12-20 | 2003-06-26 | Anders Bjorling | Method and apparatus for detection of premature atrial contraction |
| US20080027341A1 (en) * | 2002-03-26 | 2008-01-31 | Marvin Sackner | Method and system for extracting cardiac parameters from plethysmographic signals |
| US20060036183A1 (en) * | 2002-03-26 | 2006-02-16 | Vivometrics Inc. | Method and system for extracting cardiac parameters from plethysmographic signals |
| USRE43569E1 (en) * | 2002-12-09 | 2012-08-07 | ECG-Tech Corp. | Three dimensional vector cardiograph and method for detecting and monitoring ischemic events |
| US7787951B1 (en) * | 2003-12-24 | 2010-08-31 | Pacesetter, Inc. | System and method for determining optimal stimulation sites based on ECG information |
| US20070032733A1 (en) * | 2004-01-16 | 2007-02-08 | David Burton | Method and apparatus for ECG-derived sleep disordered breathing monitoring, detection and classification |
| US20120004564A1 (en) * | 2005-02-07 | 2012-01-05 | Cardiosync, Inc. | Devices and method for accelerometer-based characterization of cardiac synchrony and dyssynchrony |
| US20060247698A1 (en) * | 2005-04-28 | 2006-11-02 | Burnes John E | Multi-site PESP with fusion pacing |
| US20060264768A1 (en) * | 2005-05-13 | 2006-11-23 | Cardiocore Lab, Inc. | Method and apparatus for sequenced extraction from electrocardiogramic waveforms |
| US20120092157A1 (en) * | 2005-10-16 | 2012-04-19 | Bao Tran | Personal emergency response (per) system |
| US20070273504A1 (en) * | 2006-05-16 | 2007-11-29 | Bao Tran | Mesh network monitoring appliance |
| US20090227876A1 (en) * | 2006-05-16 | 2009-09-10 | Bao Tran | Mesh network monitoring appliance |
| US20130172691A1 (en) * | 2006-05-16 | 2013-07-04 | Bao Tran | Health monitoring appliance |
| US20120095352A1 (en) * | 2006-05-16 | 2012-04-19 | Bao Tran | Health monitoring appliance |
| US20130231574A1 (en) * | 2006-05-24 | 2013-09-05 | Bao Tran | Fitness monitoring |
| US20090318779A1 (en) * | 2006-05-24 | 2009-12-24 | Bao Tran | Mesh network stroke monitoring appliance |
| US20120330109A1 (en) * | 2006-05-24 | 2012-12-27 | Bao Tran | Health monitoring appliance |
| US20070276270A1 (en) * | 2006-05-24 | 2007-11-29 | Bao Tran | Mesh network stroke monitoring appliance |
| US20110115624A1 (en) * | 2006-06-30 | 2011-05-19 | Bao Tran | Mesh network personal emergency response appliance |
| US20080001735A1 (en) * | 2006-06-30 | 2008-01-03 | Bao Tran | Mesh network personal emergency response appliance |
| US20110181422A1 (en) * | 2006-06-30 | 2011-07-28 | Bao Tran | Personal emergency response (per) system |
| US20080004904A1 (en) * | 2006-06-30 | 2008-01-03 | Tran Bao Q | Systems and methods for providing interoperability among healthcare devices |
| US20130009783A1 (en) * | 2006-06-30 | 2013-01-10 | Bao Tran | Personal emergency response (per) system |
| US20080109041A1 (en) * | 2006-11-08 | 2008-05-08 | De Voir Christopher S | Wavelet based feature extraction and dimension reduction for the classification of human cardiac electrogram depolarization waveforms |
| US7894885B2 (en) * | 2007-05-02 | 2011-02-22 | Biosense Webster, Inc. | Coherent signal rejection in ECG |
| US20120123232A1 (en) * | 2008-12-16 | 2012-05-17 | Kayvan Najarian | Method and apparatus for determining heart rate variability using wavelet transformation |
| US8306265B2 (en) * | 2009-01-12 | 2012-11-06 | Eastman Kodak Company | Detection of animate or inanimate objects |
| US20120157822A1 (en) * | 2009-06-24 | 2012-06-21 | Cortius Holding B.V. | Inverse Imaging of Electrical Activity of a Heart Muscle |
| US20110077538A1 (en) * | 2009-09-11 | 2011-03-31 | Agency For Science, Technology And Research | Electrocardiogram signal processing system |
| US20110201951A1 (en) * | 2010-02-12 | 2011-08-18 | Siemens Medical Solutions Usa, Inc. | System for cardiac arrhythmia detection and characterization |
| US20120157865A1 (en) * | 2010-12-20 | 2012-06-21 | Yosef Stein | Adaptive ecg wandering correction |
| US20120283587A1 (en) * | 2011-05-03 | 2012-11-08 | Medtronic, Inc. | Assessing intra-cardiac activation patterns and electrical dyssynchrony |
| US20120284003A1 (en) * | 2011-05-03 | 2012-11-08 | Medtronic, Inc. | Assessing intra-cardiac activation patterns |
| US20140257058A1 (en) * | 2011-10-19 | 2014-09-11 | Scanadu Incorporated | Automated personal medical diagnostic system, method, and arrangement |
| US20130158421A1 (en) * | 2011-12-20 | 2013-06-20 | National Taiwan University | System and method for evaluating cardiovascular performance in real time and characterized by conversion of surface potential into multi-channels |
| US20140275928A1 (en) * | 2013-03-15 | 2014-09-18 | Peerbridge Health, Inc. | System and method for monitoring and diagnosing patient condition based on wireless sensor monitoring data |
| US20140357995A1 (en) * | 2013-06-04 | 2014-12-04 | Intelomed, Inc. | Hemodynamic risk severity based upon detection and quantification of cardiac dysrhythmia behavior using a pulse volume waveform |
| US20150351653A1 (en) * | 2014-06-05 | 2015-12-10 | Chen Guangren | Systems and Methods for Detecting ECG Subwaveforms |
Also Published As
| Publication number | Publication date |
|---|---|
| US20150351651A1 (en) | 2015-12-10 |
Similar Documents
| Publication | Publication Date | Title |
|---|---|---|
| US8923958B2 (en) | System and method for evaluating an electrophysiological signal | |
| JP5801866B2 (en) | Method and apparatus for assessing cardiac function | |
| US10085663B2 (en) | Automated ECG analysis and diagnosis system | |
| US9955891B2 (en) | Systems and methods for detecting ECG subwaveforms | |
| US10631750B2 (en) | Using aiECG to automatically track, navigate and measure ECG waveform data and parameters data | |
| US10646130B2 (en) | Method for recognizing point quantification standard elevation or depression near the equipotential line of each heartbeat | |
| US10729351B1 (en) | Artificial intelligence (AI) electrocardiogram (ECG) | |
| US9538930B2 (en) | Linear multi-domain electrocardiogram | |
| Setiawidayat et al. | Determining the ECG 1 cycle wave using Discrete data | |
| US10092201B2 (en) | Accurate ECG I-point and J-point detection and measurement | |
| US9999364B2 (en) | Systems and methods for providing cardiac electrophysiological markers | |
| Jindal et al. | MATLAB based GUI for ECG arrhythmia detection using Pan-Tompkin algorithm | |
| Prasad et al. | Analysis of ST-segment abnormalities in ECG using signal block averaging technique | |
| US9545203B2 (en) | Systems and methods for cardiomyocyte conduction speed mapping | |
| Chieng et al. | Ventricular tachyarrhythmias prediction methods and its prognostic features: a review | |
| US11191473B1 (en) | Generation of vital sign monitoring | |
| Mayapur | Detection and classification of heart defects | |
| US11896381B1 (en) | Classification of ST waves and ST segment type | |
| Meo | Spatio-temporal characterization of the surface electrocardiogram for catheter ablation outcome prediction in persistent atrial fibrillation | |
| Anisimov et al. | ECG and Intracardiac Electrograms Temporal Characteristics Analysis | |
| George et al. | Heart disease diagnostic graphical user interface using fractal dimension | |
| Chee et al. | Visualization of cardiac health using vector cardiogram | |
| Yang | Noninvasive Cardiac Electrical Imaging of Activation Sequence and Activation Recovery Interval, and Localization of Ventricular Arrhythmias | |
| Kansal et al. | Markers for various cardiac diseases | |
| Rahnama | Empirical Mode Decomposition and Analysis of Non-Stationary Cardiac Signals |
Legal Events
| Date | Code | Title | Description |
|---|---|---|---|
| AS | Assignment |
Owner name: CHEN, GUANGREN, CALIFORNIA Free format text: ASSIGNMENT OF ASSIGNORS INTEREST;ASSIGNORS:CHEN, GUANGREN;YAO, LINGLING;REEL/FRAME:035923/0558 Effective date: 20150629 |
|
| STCF | Information on status: patent grant |
Free format text: PATENTED CASE |
|
| MAFP | Maintenance fee payment |
Free format text: PAYMENT OF MAINTENANCE FEE, 4TH YR, SMALL ENTITY (ORIGINAL EVENT CODE: M2551); ENTITY STATUS OF PATENT OWNER: SMALL ENTITY Year of fee payment: 4 |