US8885901B1 - Systems and methods for automated enhancement of retinal images - Google Patents
Systems and methods for automated enhancement of retinal images Download PDFInfo
- Publication number
- US8885901B1 US8885901B1 US14/266,688 US201414266688A US8885901B1 US 8885901 B1 US8885901 B1 US 8885901B1 US 201414266688 A US201414266688 A US 201414266688A US 8885901 B1 US8885901 B1 US 8885901B1
- Authority
- US
- United States
- Prior art keywords
- image
- intensity
- images
- descriptors
- retinal
- Prior art date
- Legal status (The legal status is an assumption and is not a legal conclusion. Google has not performed a legal analysis and makes no representation as to the accuracy of the status listed.)
- Active
Links
- 238000000034 method Methods 0.000 title claims abstract description 173
- 230000004256 retinal image Effects 0.000 title claims description 193
- 230000003902 lesion Effects 0.000 claims abstract description 188
- 238000012216 screening Methods 0.000 claims abstract description 102
- 230000004807 localization Effects 0.000 claims abstract description 34
- 210000003484 anatomy Anatomy 0.000 claims abstract description 10
- 230000002207 retinal effect Effects 0.000 claims description 72
- 238000001514 detection method Methods 0.000 claims description 64
- 238000003860 storage Methods 0.000 claims description 42
- 230000005856 abnormality Effects 0.000 claims description 17
- 238000001303 quality assessment method Methods 0.000 claims description 17
- 230000002708 enhancing effect Effects 0.000 claims description 4
- 239000000090 biomarker Substances 0.000 abstract description 15
- 238000012544 monitoring process Methods 0.000 abstract description 10
- 238000003745 diagnosis Methods 0.000 abstract description 9
- 238000002059 diagnostic imaging Methods 0.000 abstract description 5
- 230000010354 integration Effects 0.000 abstract description 4
- 238000011002 quantification Methods 0.000 abstract description 4
- 238000004458 analytical method Methods 0.000 description 95
- 208000009857 Microaneurysm Diseases 0.000 description 72
- 239000013598 vector Substances 0.000 description 70
- 238000012545 processing Methods 0.000 description 67
- 230000000877 morphologic effect Effects 0.000 description 66
- 238000003384 imaging method Methods 0.000 description 52
- 230000008569 process Effects 0.000 description 50
- 206010012689 Diabetic retinopathy Diseases 0.000 description 47
- 239000000428 dust Substances 0.000 description 44
- 206010002329 Aneurysm Diseases 0.000 description 39
- 206010048843 Cytomegalovirus chorioretinitis Diseases 0.000 description 31
- 208000001763 cytomegalovirus retinitis Diseases 0.000 description 31
- 238000004422 calculation algorithm Methods 0.000 description 30
- 238000012360 testing method Methods 0.000 description 28
- 201000010099 disease Diseases 0.000 description 27
- 208000037265 diseases, disorders, signs and symptoms Diseases 0.000 description 27
- 208000017442 Retinal disease Diseases 0.000 description 23
- 210000001525 retina Anatomy 0.000 description 23
- 230000000875 corresponding effect Effects 0.000 description 22
- 238000012549 training Methods 0.000 description 22
- 238000010191 image analysis Methods 0.000 description 21
- 230000002085 persistent effect Effects 0.000 description 21
- 238000013534 fluorescein angiography Methods 0.000 description 20
- 238000012706 support-vector machine Methods 0.000 description 20
- 238000010586 diagram Methods 0.000 description 19
- 230000007306 turnover Effects 0.000 description 17
- 230000004044 response Effects 0.000 description 16
- 238000012014 optical coherence tomography Methods 0.000 description 14
- 206010012601 diabetes mellitus Diseases 0.000 description 13
- 238000001914 filtration Methods 0.000 description 13
- 206010038923 Retinopathy Diseases 0.000 description 12
- 230000003044 adaptive effect Effects 0.000 description 12
- 238000013459 approach Methods 0.000 description 12
- 238000013528 artificial neural network Methods 0.000 description 12
- 238000013135 deep learning Methods 0.000 description 12
- 208000002780 macular degeneration Diseases 0.000 description 12
- 210000005166 vasculature Anatomy 0.000 description 11
- 230000002146 bilateral effect Effects 0.000 description 10
- 210000000416 exudates and transudate Anatomy 0.000 description 10
- 239000011159 matrix material Substances 0.000 description 10
- 230000003595 spectral effect Effects 0.000 description 10
- 230000009466 transformation Effects 0.000 description 10
- 208000032843 Hemorrhage Diseases 0.000 description 9
- 230000008901 benefit Effects 0.000 description 9
- 238000013507 mapping Methods 0.000 description 9
- 210000003733 optic disk Anatomy 0.000 description 9
- 238000000513 principal component analysis Methods 0.000 description 9
- 238000011282 treatment Methods 0.000 description 9
- 238000009499 grossing Methods 0.000 description 8
- 230000011218 segmentation Effects 0.000 description 8
- 238000000701 chemical imaging Methods 0.000 description 7
- 230000006870 function Effects 0.000 description 7
- 230000035945 sensitivity Effects 0.000 description 7
- 238000012546 transfer Methods 0.000 description 7
- 206010025421 Macule Diseases 0.000 description 6
- 206010038933 Retinopathy of prematurity Diseases 0.000 description 6
- 238000004891 communication Methods 0.000 description 6
- 230000000694 effects Effects 0.000 description 6
- PXFBZOLANLWPMH-UHFFFAOYSA-N 16-Epiaffinine Natural products C1C(C2=CC=CC=C2N2)=C2C(=O)CC2C(=CC)CN(C)C1C2CO PXFBZOLANLWPMH-UHFFFAOYSA-N 0.000 description 5
- 208000024827 Alzheimer disease Diseases 0.000 description 5
- 201000004569 Blindness Diseases 0.000 description 5
- 230000009471 action Effects 0.000 description 5
- 238000000605 extraction Methods 0.000 description 5
- 238000013519 translation Methods 0.000 description 5
- 230000002792 vascular Effects 0.000 description 5
- 208000024172 Cardiovascular disease Diseases 0.000 description 4
- 208000010412 Glaucoma Diseases 0.000 description 4
- 208000035719 Maculopathy Diseases 0.000 description 4
- 206010038862 Retinal exudates Diseases 0.000 description 4
- 230000002159 abnormal effect Effects 0.000 description 4
- 230000005540 biological transmission Effects 0.000 description 4
- 230000010339 dilation Effects 0.000 description 4
- 230000008034 disappearance Effects 0.000 description 4
- 230000036541 health Effects 0.000 description 4
- 230000006872 improvement Effects 0.000 description 4
- 238000010801 machine learning Methods 0.000 description 4
- 230000003287 optical effect Effects 0.000 description 4
- 230000000717 retained effect Effects 0.000 description 4
- 238000002560 therapeutic procedure Methods 0.000 description 4
- 230000000007 visual effect Effects 0.000 description 4
- 208000030507 AIDS Diseases 0.000 description 3
- 238000012935 Averaging Methods 0.000 description 3
- 206010020772 Hypertension Diseases 0.000 description 3
- 208000032400 Retinal pigmentation Diseases 0.000 description 3
- 206010038926 Retinopathy hypertensive Diseases 0.000 description 3
- 238000013475 authorization Methods 0.000 description 3
- 230000009286 beneficial effect Effects 0.000 description 3
- 230000008859 change Effects 0.000 description 3
- 238000013500 data storage Methods 0.000 description 3
- 238000009826 distribution Methods 0.000 description 3
- 238000005516 engineering process Methods 0.000 description 3
- 238000011156 evaluation Methods 0.000 description 3
- 239000000284 extract Substances 0.000 description 3
- 201000001948 hypertensive retinopathy Diseases 0.000 description 3
- 238000005286 illumination Methods 0.000 description 3
- 238000002372 labelling Methods 0.000 description 3
- 238000010606 normalization Methods 0.000 description 3
- 230000036961 partial effect Effects 0.000 description 3
- 238000013139 quantization Methods 0.000 description 3
- 230000009467 reduction Effects 0.000 description 3
- 230000002829 reductive effect Effects 0.000 description 3
- 210000001210 retinal vessel Anatomy 0.000 description 3
- 238000012106 screening analysis Methods 0.000 description 3
- 239000007787 solid Substances 0.000 description 3
- 230000004393 visual impairment Effects 0.000 description 3
- 241000701022 Cytomegalovirus Species 0.000 description 2
- 208000037111 Retinal Hemorrhage Diseases 0.000 description 2
- 206010064930 age-related macular degeneration Diseases 0.000 description 2
- 230000002776 aggregation Effects 0.000 description 2
- 238000004220 aggregation Methods 0.000 description 2
- 238000003491 array Methods 0.000 description 2
- 210000002565 arteriole Anatomy 0.000 description 2
- 210000001367 artery Anatomy 0.000 description 2
- 230000003190 augmentative effect Effects 0.000 description 2
- 230000036772 blood pressure Effects 0.000 description 2
- 210000004204 blood vessel Anatomy 0.000 description 2
- 230000015556 catabolic process Effects 0.000 description 2
- 230000001684 chronic effect Effects 0.000 description 2
- 239000002131 composite material Substances 0.000 description 2
- 238000002790 cross-validation Methods 0.000 description 2
- 238000006731 degradation reaction Methods 0.000 description 2
- 230000001419 dependent effect Effects 0.000 description 2
- 238000006073 displacement reaction Methods 0.000 description 2
- 239000003814 drug Substances 0.000 description 2
- 229940079593 drug Drugs 0.000 description 2
- 230000003628 erosive effect Effects 0.000 description 2
- 238000002474 experimental method Methods 0.000 description 2
- 208000030533 eye disease Diseases 0.000 description 2
- 238000003064 k means clustering Methods 0.000 description 2
- 238000012986 modification Methods 0.000 description 2
- 230000004048 modification Effects 0.000 description 2
- 210000000056 organ Anatomy 0.000 description 2
- 230000001575 pathological effect Effects 0.000 description 2
- 238000011160 research Methods 0.000 description 2
- 230000002441 reversible effect Effects 0.000 description 2
- 238000005070 sampling Methods 0.000 description 2
- 229920006395 saturated elastomer Polymers 0.000 description 2
- 239000000243 solution Substances 0.000 description 2
- 230000009885 systemic effect Effects 0.000 description 2
- 238000000844 transformation Methods 0.000 description 2
- 210000003462 vein Anatomy 0.000 description 2
- 201000001320 Atherosclerosis Diseases 0.000 description 1
- 244000180534 Berberis hybrid Species 0.000 description 1
- 206010007559 Cardiac failure congestive Diseases 0.000 description 1
- 208000017667 Chronic Disease Diseases 0.000 description 1
- 102000003712 Complement factor B Human genes 0.000 description 1
- 108090000056 Complement factor B Proteins 0.000 description 1
- 206010011831 Cytomegalovirus infection Diseases 0.000 description 1
- WQZGKKKJIJFFOK-GASJEMHNSA-N Glucose Natural products OC[C@H]1OC(O)[C@H](O)[C@@H](O)[C@@H]1O WQZGKKKJIJFFOK-GASJEMHNSA-N 0.000 description 1
- 206010019280 Heart failures Diseases 0.000 description 1
- 241000282412 Homo Species 0.000 description 1
- 208000001344 Macular Edema Diseases 0.000 description 1
- 206010025415 Macular oedema Diseases 0.000 description 1
- 206010064997 Necrotising retinitis Diseases 0.000 description 1
- 206010029113 Neovascularisation Diseases 0.000 description 1
- 206010061323 Optic neuropathy Diseases 0.000 description 1
- 206010036590 Premature baby Diseases 0.000 description 1
- 206010038910 Retinitis Diseases 0.000 description 1
- 206010072731 White matter lesion Diseases 0.000 description 1
- 230000004075 alteration Effects 0.000 description 1
- 238000003556 assay Methods 0.000 description 1
- 230000006399 behavior Effects 0.000 description 1
- 208000020036 bilateral optic nerve hypoplasia Diseases 0.000 description 1
- 239000008280 blood Substances 0.000 description 1
- 210000004369 blood Anatomy 0.000 description 1
- 239000003086 colorant Substances 0.000 description 1
- 230000000295 complement effect Effects 0.000 description 1
- 230000006835 compression Effects 0.000 description 1
- 238000007906 compression Methods 0.000 description 1
- 230000001010 compromised effect Effects 0.000 description 1
- 238000004195 computer-aided diagnosis Methods 0.000 description 1
- 238000012937 correction Methods 0.000 description 1
- 230000002596 correlated effect Effects 0.000 description 1
- 238000005520 cutting process Methods 0.000 description 1
- 230000006378 damage Effects 0.000 description 1
- 238000003066 decision tree Methods 0.000 description 1
- 238000000354 decomposition reaction Methods 0.000 description 1
- 230000007850 degeneration Effects 0.000 description 1
- 238000013461 design Methods 0.000 description 1
- 238000003708 edge detection Methods 0.000 description 1
- 230000008030 elimination Effects 0.000 description 1
- 238000003379 elimination reaction Methods 0.000 description 1
- 239000008103 glucose Substances 0.000 description 1
- PCHJSUWPFVWCPO-UHFFFAOYSA-N gold Chemical compound [Au] PCHJSUWPFVWCPO-UHFFFAOYSA-N 0.000 description 1
- 238000003709 image segmentation Methods 0.000 description 1
- 210000000987 immune system Anatomy 0.000 description 1
- 238000010348 incorporation Methods 0.000 description 1
- 208000015181 infectious disease Diseases 0.000 description 1
- 230000010365 information processing Effects 0.000 description 1
- 230000000977 initiatory effect Effects 0.000 description 1
- 238000002347 injection Methods 0.000 description 1
- 239000007924 injection Substances 0.000 description 1
- 230000004410 intraocular pressure Effects 0.000 description 1
- 230000001788 irregular Effects 0.000 description 1
- 210000003734 kidney Anatomy 0.000 description 1
- 238000012417 linear regression Methods 0.000 description 1
- 201000010230 macular retinal edema Diseases 0.000 description 1
- 238000007726 management method Methods 0.000 description 1
- 239000003550 marker Substances 0.000 description 1
- 230000000873 masking effect Effects 0.000 description 1
- 230000003278 mimic effect Effects 0.000 description 1
- 210000005036 nerve Anatomy 0.000 description 1
- 230000006855 networking Effects 0.000 description 1
- 230000001537 neural effect Effects 0.000 description 1
- 210000001328 optic nerve Anatomy 0.000 description 1
- 208000020911 optic nerve disease Diseases 0.000 description 1
- 238000005457 optimization Methods 0.000 description 1
- 230000008520 organization Effects 0.000 description 1
- 238000005192 partition Methods 0.000 description 1
- 230000007119 pathological manifestation Effects 0.000 description 1
- 230000007170 pathology Effects 0.000 description 1
- 230000002093 peripheral effect Effects 0.000 description 1
- 238000011176 pooling Methods 0.000 description 1
- 238000007781 pre-processing Methods 0.000 description 1
- 238000002360 preparation method Methods 0.000 description 1
- 230000000644 propagated effect Effects 0.000 description 1
- 210000001747 pupil Anatomy 0.000 description 1
- 238000013441 quality evaluation Methods 0.000 description 1
- 239000000700 radioactive tracer Substances 0.000 description 1
- 238000011084 recovery Methods 0.000 description 1
- 238000000611 regression analysis Methods 0.000 description 1
- 230000004233 retinal vasculature Effects 0.000 description 1
- 210000001957 retinal vein Anatomy 0.000 description 1
- 238000012552 review Methods 0.000 description 1
- 238000013341 scale-up Methods 0.000 description 1
- 238000007619 statistical method Methods 0.000 description 1
- 230000026676 system process Effects 0.000 description 1
- 238000002604 ultrasonography Methods 0.000 description 1
- 208000029257 vision disease Diseases 0.000 description 1
- 238000011179 visual inspection Methods 0.000 description 1
- 238000012800 visualization Methods 0.000 description 1
Images


Classifications
-
- G—PHYSICS
- G06—COMPUTING; CALCULATING OR COUNTING
- G06T—IMAGE DATA PROCESSING OR GENERATION, IN GENERAL
- G06T5/00—Image enhancement or restoration
- G06T5/20—Image enhancement or restoration by the use of local operators
-
- G06T5/94—
-
- A—HUMAN NECESSITIES
- A61—MEDICAL OR VETERINARY SCIENCE; HYGIENE
- A61B—DIAGNOSIS; SURGERY; IDENTIFICATION
- A61B3/00—Apparatus for testing the eyes; Instruments for examining the eyes
- A61B3/0016—Operational features thereof
- A61B3/0025—Operational features thereof characterised by electronic signal processing, e.g. eye models
-
- A—HUMAN NECESSITIES
- A61—MEDICAL OR VETERINARY SCIENCE; HYGIENE
- A61B—DIAGNOSIS; SURGERY; IDENTIFICATION
- A61B3/00—Apparatus for testing the eyes; Instruments for examining the eyes
- A61B3/10—Objective types, i.e. instruments for examining the eyes independent of the patients' perceptions or reactions
- A61B3/12—Objective types, i.e. instruments for examining the eyes independent of the patients' perceptions or reactions for looking at the eye fundus, e.g. ophthalmoscopes
-
- A—HUMAN NECESSITIES
- A61—MEDICAL OR VETERINARY SCIENCE; HYGIENE
- A61B—DIAGNOSIS; SURGERY; IDENTIFICATION
- A61B3/00—Apparatus for testing the eyes; Instruments for examining the eyes
- A61B3/10—Objective types, i.e. instruments for examining the eyes independent of the patients' perceptions or reactions
- A61B3/14—Arrangements specially adapted for eye photography
-
- G—PHYSICS
- G06—COMPUTING; CALCULATING OR COUNTING
- G06F—ELECTRIC DIGITAL DATA PROCESSING
- G06F16/00—Information retrieval; Database structures therefor; File system structures therefor
- G06F16/50—Information retrieval; Database structures therefor; File system structures therefor of still image data
- G06F16/58—Retrieval characterised by using metadata, e.g. metadata not derived from the content or metadata generated manually
- G06F16/583—Retrieval characterised by using metadata, e.g. metadata not derived from the content or metadata generated manually using metadata automatically derived from the content
-
- G—PHYSICS
- G06—COMPUTING; CALCULATING OR COUNTING
- G06F—ELECTRIC DIGITAL DATA PROCESSING
- G06F16/00—Information retrieval; Database structures therefor; File system structures therefor
- G06F16/50—Information retrieval; Database structures therefor; File system structures therefor of still image data
- G06F16/58—Retrieval characterised by using metadata, e.g. metadata not derived from the content or metadata generated manually
- G06F16/5866—Retrieval characterised by using metadata, e.g. metadata not derived from the content or metadata generated manually using information manually generated, e.g. tags, keywords, comments, manually generated location and time information
-
- G06T3/14—
-
- G06T3/18—
-
- G—PHYSICS
- G06—COMPUTING; CALCULATING OR COUNTING
- G06T—IMAGE DATA PROCESSING OR GENERATION, IN GENERAL
- G06T3/00—Geometric image transformation in the plane of the image
- G06T3/40—Scaling the whole image or part thereof
-
- G—PHYSICS
- G06—COMPUTING; CALCULATING OR COUNTING
- G06T—IMAGE DATA PROCESSING OR GENERATION, IN GENERAL
- G06T7/00—Image analysis
- G06T7/0002—Inspection of images, e.g. flaw detection
- G06T7/0012—Biomedical image inspection
-
- G—PHYSICS
- G06—COMPUTING; CALCULATING OR COUNTING
- G06T—IMAGE DATA PROCESSING OR GENERATION, IN GENERAL
- G06T7/00—Image analysis
- G06T7/0002—Inspection of images, e.g. flaw detection
- G06T7/0012—Biomedical image inspection
- G06T7/0014—Biomedical image inspection using an image reference approach
- G06T7/0016—Biomedical image inspection using an image reference approach involving temporal comparison
-
- G—PHYSICS
- G06—COMPUTING; CALCULATING OR COUNTING
- G06V—IMAGE OR VIDEO RECOGNITION OR UNDERSTANDING
- G06V10/00—Arrangements for image or video recognition or understanding
- G06V10/20—Image preprocessing
- G06V10/26—Segmentation of patterns in the image field; Cutting or merging of image elements to establish the pattern region, e.g. clustering-based techniques; Detection of occlusion
- G06V10/267—Segmentation of patterns in the image field; Cutting or merging of image elements to establish the pattern region, e.g. clustering-based techniques; Detection of occlusion by performing operations on regions, e.g. growing, shrinking or watersheds
-
- G—PHYSICS
- G06—COMPUTING; CALCULATING OR COUNTING
- G06V—IMAGE OR VIDEO RECOGNITION OR UNDERSTANDING
- G06V10/00—Arrangements for image or video recognition or understanding
- G06V10/40—Extraction of image or video features
- G06V10/44—Local feature extraction by analysis of parts of the pattern, e.g. by detecting edges, contours, loops, corners, strokes or intersections; Connectivity analysis, e.g. of connected components
-
- G—PHYSICS
- G06—COMPUTING; CALCULATING OR COUNTING
- G06V—IMAGE OR VIDEO RECOGNITION OR UNDERSTANDING
- G06V10/00—Arrangements for image or video recognition or understanding
- G06V10/40—Extraction of image or video features
- G06V10/50—Extraction of image or video features by performing operations within image blocks; by using histograms, e.g. histogram of oriented gradients [HoG]; by summing image-intensity values; Projection analysis
-
- G—PHYSICS
- G06—COMPUTING; CALCULATING OR COUNTING
- G06V—IMAGE OR VIDEO RECOGNITION OR UNDERSTANDING
- G06V10/00—Arrangements for image or video recognition or understanding
- G06V10/70—Arrangements for image or video recognition or understanding using pattern recognition or machine learning
- G06V10/74—Image or video pattern matching; Proximity measures in feature spaces
- G06V10/75—Organisation of the matching processes, e.g. simultaneous or sequential comparisons of image or video features; Coarse-fine approaches, e.g. multi-scale approaches; using context analysis; Selection of dictionaries
- G06V10/758—Involving statistics of pixels or of feature values, e.g. histogram matching
-
- G—PHYSICS
- G06—COMPUTING; CALCULATING OR COUNTING
- G06V—IMAGE OR VIDEO RECOGNITION OR UNDERSTANDING
- G06V40/00—Recognition of biometric, human-related or animal-related patterns in image or video data
- G06V40/10—Human or animal bodies, e.g. vehicle occupants or pedestrians; Body parts, e.g. hands
- G06V40/18—Eye characteristics, e.g. of the iris
- G06V40/193—Preprocessing; Feature extraction
-
- G—PHYSICS
- G16—INFORMATION AND COMMUNICATION TECHNOLOGY [ICT] SPECIALLY ADAPTED FOR SPECIFIC APPLICATION FIELDS
- G16H—HEALTHCARE INFORMATICS, i.e. INFORMATION AND COMMUNICATION TECHNOLOGY [ICT] SPECIALLY ADAPTED FOR THE HANDLING OR PROCESSING OF MEDICAL OR HEALTHCARE DATA
- G16H30/00—ICT specially adapted for the handling or processing of medical images
- G16H30/20—ICT specially adapted for the handling or processing of medical images for handling medical images, e.g. DICOM, HL7 or PACS
-
- G—PHYSICS
- G16—INFORMATION AND COMMUNICATION TECHNOLOGY [ICT] SPECIALLY ADAPTED FOR SPECIFIC APPLICATION FIELDS
- G16H—HEALTHCARE INFORMATICS, i.e. INFORMATION AND COMMUNICATION TECHNOLOGY [ICT] SPECIALLY ADAPTED FOR THE HANDLING OR PROCESSING OF MEDICAL OR HEALTHCARE DATA
- G16H30/00—ICT specially adapted for the handling or processing of medical images
- G16H30/40—ICT specially adapted for the handling or processing of medical images for processing medical images, e.g. editing
-
- G—PHYSICS
- G16—INFORMATION AND COMMUNICATION TECHNOLOGY [ICT] SPECIALLY ADAPTED FOR SPECIFIC APPLICATION FIELDS
- G16H—HEALTHCARE INFORMATICS, i.e. INFORMATION AND COMMUNICATION TECHNOLOGY [ICT] SPECIALLY ADAPTED FOR THE HANDLING OR PROCESSING OF MEDICAL OR HEALTHCARE DATA
- G16H50/00—ICT specially adapted for medical diagnosis, medical simulation or medical data mining; ICT specially adapted for detecting, monitoring or modelling epidemics or pandemics
- G16H50/20—ICT specially adapted for medical diagnosis, medical simulation or medical data mining; ICT specially adapted for detecting, monitoring or modelling epidemics or pandemics for computer-aided diagnosis, e.g. based on medical expert systems
-
- G—PHYSICS
- G16—INFORMATION AND COMMUNICATION TECHNOLOGY [ICT] SPECIALLY ADAPTED FOR SPECIFIC APPLICATION FIELDS
- G16Z—INFORMATION AND COMMUNICATION TECHNOLOGY [ICT] SPECIALLY ADAPTED FOR SPECIFIC APPLICATION FIELDS, NOT OTHERWISE PROVIDED FOR
- G16Z99/00—Subject matter not provided for in other main groups of this subclass
-
- G—PHYSICS
- G06—COMPUTING; CALCULATING OR COUNTING
- G06F—ELECTRIC DIGITAL DATA PROCESSING
- G06F16/00—Information retrieval; Database structures therefor; File system structures therefor
- G06F16/50—Information retrieval; Database structures therefor; File system structures therefor of still image data
- G06F16/51—Indexing; Data structures therefor; Storage structures
-
- G—PHYSICS
- G06—COMPUTING; CALCULATING OR COUNTING
- G06T—IMAGE DATA PROCESSING OR GENERATION, IN GENERAL
- G06T2207/00—Indexing scheme for image analysis or image enhancement
- G06T2207/10—Image acquisition modality
- G06T2207/10024—Color image
-
- G—PHYSICS
- G06—COMPUTING; CALCULATING OR COUNTING
- G06T—IMAGE DATA PROCESSING OR GENERATION, IN GENERAL
- G06T2207/00—Indexing scheme for image analysis or image enhancement
- G06T2207/20—Special algorithmic details
- G06T2207/20016—Hierarchical, coarse-to-fine, multiscale or multiresolution image processing; Pyramid transform
-
- G—PHYSICS
- G06—COMPUTING; CALCULATING OR COUNTING
- G06T—IMAGE DATA PROCESSING OR GENERATION, IN GENERAL
- G06T2207/00—Indexing scheme for image analysis or image enhancement
- G06T2207/20—Special algorithmic details
- G06T2207/20024—Filtering details
- G06T2207/20032—Median filtering
-
- G—PHYSICS
- G06—COMPUTING; CALCULATING OR COUNTING
- G06T—IMAGE DATA PROCESSING OR GENERATION, IN GENERAL
- G06T2207/00—Indexing scheme for image analysis or image enhancement
- G06T2207/20—Special algorithmic details
- G06T2207/20036—Morphological image processing
-
- G—PHYSICS
- G06—COMPUTING; CALCULATING OR COUNTING
- G06T—IMAGE DATA PROCESSING OR GENERATION, IN GENERAL
- G06T2207/00—Indexing scheme for image analysis or image enhancement
- G06T2207/30—Subject of image; Context of image processing
- G06T2207/30004—Biomedical image processing
- G06T2207/30041—Eye; Retina; Ophthalmic
-
- G—PHYSICS
- G06—COMPUTING; CALCULATING OR COUNTING
- G06T—IMAGE DATA PROCESSING OR GENERATION, IN GENERAL
- G06T2207/00—Indexing scheme for image analysis or image enhancement
- G06T2207/30—Subject of image; Context of image processing
- G06T2207/30004—Biomedical image processing
- G06T2207/30096—Tumor; Lesion
-
- G—PHYSICS
- G06—COMPUTING; CALCULATING OR COUNTING
- G06T—IMAGE DATA PROCESSING OR GENERATION, IN GENERAL
- G06T2207/00—Indexing scheme for image analysis or image enhancement
- G06T2207/30—Subject of image; Context of image processing
- G06T2207/30004—Biomedical image processing
- G06T2207/30101—Blood vessel; Artery; Vein; Vascular
- G06T2207/30104—Vascular flow; Blood flow; Perfusion
-
- G—PHYSICS
- G06—COMPUTING; CALCULATING OR COUNTING
- G06T—IMAGE DATA PROCESSING OR GENERATION, IN GENERAL
- G06T2207/00—Indexing scheme for image analysis or image enhancement
- G06T2207/30—Subject of image; Context of image processing
- G06T2207/30168—Image quality inspection
-
- G—PHYSICS
- G06—COMPUTING; CALCULATING OR COUNTING
- G06V—IMAGE OR VIDEO RECOGNITION OR UNDERSTANDING
- G06V2201/00—Indexing scheme relating to image or video recognition or understanding
- G06V2201/03—Recognition of patterns in medical or anatomical images
-
- G—PHYSICS
- G06—COMPUTING; CALCULATING OR COUNTING
- G06V—IMAGE OR VIDEO RECOGNITION OR UNDERSTANDING
- G06V40/00—Recognition of biometric, human-related or animal-related patterns in image or video data
- G06V40/10—Human or animal bodies, e.g. vehicle occupants or pedestrians; Body parts, e.g. hands
- G06V40/14—Vascular patterns
Definitions
- Imaging of human organs plays a critical role in diagnosis of multiple diseases. This is especially true for the human retina, where the presence of a large network of blood vessels and nerves make it a near-ideal window for exploring the effects of diseases that harm vision (such as diabetic retinopathy seen in diabetic patients, cytomegalovirus retinitis seen in HIV/AIDS patients, glaucoma, and so forth) or other systemic diseases (such as hypertension, stroke, and so forth).
- harm vision such as diabetic retinopathy seen in diabetic patients, cytomegalovirus retinitis seen in HIV/AIDS patients, glaucoma, and so forth
- systemic diseases such as hypertension, stroke, and so forth.
- Advances in computer-aided image processing and analysis technologies are essential to make imaging-based disease diagnosis scalable, cost-effective, and reproducible. Such advances would directly result in effective triage of patients, leading to timely treatment and better quality of life.
- a computing system for enhancing a retinal image may include one or more hardware computer processors; and one or more storage devices configured to store software instructions configured for execution by the one or more hardware computer processors in order to cause the computing system to: access a medical retinal image for enhancement, the medical retinal image related to a subject; compute a median filtered image I Back,S with a median computed over a geometric shape, at single or multiple scales; determine whether intensity at a first pixel location in the medical retinal image I(x,y) is lower than intensity at a same position in the median filtered image I Back,S (x,y) for generating an enhanced image; if the intensity at the first pixel location is lower, then set a value at the first pixel location in the enhanced image to a value around a middle of a minimum and a maximum intensity value for the medical retinal image C mid scaled by a ratio of intensity at medical retinal image to intensity in the median filtered image as expressed by
- a computing system for automated detection of active pixels in retinal images may include one or more hardware computer processors; and one or more storage devices configured to store software instructions configured for execution by the one or more hardware computer processors in order to cause the computing system to: access a retinal image; generate a first median normalized image using the retinal image with a median computed over a first geometric shape of a first size; generate a second median normalized image using the retinal image with a median computed over the first geometric shape of a second size, the second size different from the first size; automatically generate a difference image by computing a difference between the first median normalized image and the second median normalized image; generate a binary image by computing a hysteresis threshold of the difference image using at least two thresholds to detect dark and bright structures in the difference image; apply a connected component analysis to the binary image to group neighboring pixels of the binary image into a plurality of local regions; compute the area of each local region in the plurality of local regions; and store the pluralit
- a computer-implemented method for automated detection of active pixels in retinal images may include, as implemented by one or more computing devices configured with specific executable instructions: accessing a retinal image; generating a first median normalized image using the retinal image with a median computed over a first geometric shape of a first size; generating a second median normalized image using the retinal image with a median computed over the first geometric shape of a second size, the second size different from the first size; automatically generating a difference image by computing a difference between the first median normalized image and the second median normalized image; generating a binary image by computing a hysteresis threshold of the difference image using at least two thresholds to detect dark and bright structures in the difference image; applying a connected component analysis to the binary image to group neighboring pixels of the binary image into a plurality of local regions; computing the area of each local region in the plurality of local regions; and storing the plurality of local regions in a memory.
- non-transitory computer storage that stores executable program instructions.
- the non-transitory computer storage may include instructions that, when executed by one or more computing devices, configure the one or more computing devices to perform operations including: accessing a retinal image; generating a first median normalized image using the retinal image with a median computed over a first geometric shape of a first size; generating a second median normalized image using the retinal image with a median computed over the first geometric shape of a second size, the second size different from the first size; automatically generating a difference image by computing a difference between the first median normalized image and the second median normalized image; generating a binary image by computing a hysteresis threshold of the difference image using at least two thresholds to detect dark and bright structures in the difference image; applying a connected component analysis to the binary image to group neighboring pixels of the binary image into a plurality of local regions; computing the area of each local region in the plurality of local regions; and storing the plurality of local regions in a
- a computing system for automated generation of descriptors of local regions within a retinal image may include one or more hardware computer processors; and one or more storage devices configured to store software instructions configured for execution by the one or more hardware computer processors in order to cause the computing system to: access a retinal image; generate a first morphological filtered image using the retinal image, with a the said morphological filter computed over a first geometric shape; generate a second morphological filtered image using the retinal image, with a morphological filter computed over a second geometric shape, the second geometric shape having one or more of a different shape or different size from the first geometric shape; generate a difference image by computing a difference between the first morphological filtered image and the second morphological filtered image; and assign the difference of image pixel values as a descriptor value, each descriptor value corresponding to given pixel location of the said retinal image.
- a computer-implemented method for automated generation of descriptors of local regions within a retinal image may include, as implemented by one or more computing devices configured with specific executable instructions: accessing a retinal image; generating a first morphological filtered image using the retinal image, with a the said morphological filter computed over a first geometric shape; generating a second morphological filtered image using the retinal image, with a morphological filter computed over a second geometric shape, the second geometric shape having one or more of a different shape or different size from the first geometric shape; generating a difference image by computing a difference between the first morphological filtered image and the second morphological filtered image; and assigning the difference of image pixel values as a descriptor value, each descriptor value corresponding to given pixel location of the said retinal image.
- non-transitory computer storage that stores executable program instructions.
- the non-transitory computer storage may include instructions that, when executed by one or more computing devices, configure the one or more computing devices to perform operations including: accessing a retinal image; generating a first morphological filtered image using the retinal image, with a the said morphological filter computed over a first geometric shape; generating a second morphological filtered image using the retinal image, with a morphological filter computed over a second geometric shape, the second geometric shape having one or more of a different shape or different size from the first geometric shape; generating a difference image by computing a difference between the first morphological filtered image and the second morphological filtered image; and assigning the difference of image pixel values as a descriptor value, each descriptor value corresponding to given pixel location of the said retinal image.
- a computing system for automated processing of retinal images for screening of diseases or abnormalities may include: one or more hardware computer processors; and one or more storage devices configured to store software instructions configured for execution by the one or more hardware computer processors in order to cause the computing system to: access retinal images related to a patient, each of the retinal images comprising a plurality of pixels; for each of the retinal images, designate a first set of the plurality of pixels as active pixels indicating that they include interesting regions of the retinal image, the designating using one or more of: conditional number theory, single- or multi-scale interest region detection, vasculature analysis, or structured-ness analysis; for each of the retinal images, compute descriptors from the retinal image, the descriptors including one or more of: morphological filterbank descriptors, median filterbank descriptors, oriented median filterbank descriptors, Hessian based descriptors, Gaussian derivatives descriptors, blob statistics descriptor
- a computer implemented method for automated processing of retinal images for screening of diseases or abnormalities may include: accessing retinal images related to a patient, each of the retinal images comprising a plurality of pixels; for each of the retinal images, designating a first set of the plurality of pixels as active pixels indicating that they include interesting regions of the retinal image, the designating using one or more of: conditional number theory, single- or multi-scale interest region detection, vasculature analysis, or structured-ness analysis; for each of the retinal images, computing descriptors from the retinal image, the descriptors including one or more of: morphological filterbank descriptors, median filterbank descriptors, oriented median filterbank descriptors, Hessian based descriptors, Gaussian derivatives descriptors, blob statistics descriptors, color descriptors, matched filter descriptors, path opening and closing based morphological descriptors, local binary pattern descriptors,
- non-transitory computer storage that stores executable program instructions.
- the non-transitory computer storage may include instructions that, when executed by one or more computing devices, configure the one or more computing devices to perform operations including: accessing retinal images related to a patient, each of the retinal images comprising a plurality of pixels; for each of the retinal images, designating a first set of the plurality of pixels as active pixels indicating that they include interesting regions of the retinal image, the designating using one or more of: conditional number theory, single- or multi-scale interest region detection, vasculature analysis, or structured-ness analysis; for each of the retinal images, computing descriptors from the retinal image, the descriptors including one or more of: morphological filterbank descriptors, median filterbank descriptors, oriented median filterbank descriptors, Hessian based descriptors, Gaussian derivatives descriptors, blob statistics descriptors, color descriptors, matched filter descriptors, path
- a computing system for automated computation of image-based lesion biomarkers for disease analysis may include: one or more hardware computer processors; and one or more storage devices configured to store software instructions configured for execution by the one or more hardware computer processors in order to cause the computing system to: access a first set of retinal images related to one or more visits from a patient, each of the retinal images in the first set comprising a plurality of pixels; access a second set of retinal images related to a current visit from the patient, each of the retinal images in the second set comprising a plurality of pixels; perform lesion analysis comprising: detecting interesting pixels; computing descriptors from the images; and classifying active regions using machine learning techniques; conduct image-to-image registration of a second image from the second set and a first image from the first set using retinal image registration, the registration comprising: identifying pixels in the first image as landmarks; identifying pixels in the second image as landmarks; computing descriptors at landmark pixels; matching descriptors across the
- a computer implemented method for automated computation of image-based lesion biomarkers for disease analysis may include: accessing a first set of retinal images related to one or more visits from a patient, each of the retinal images in the first set comprising a plurality of pixels; accessing a second set of retinal images related to a current visit from the patient, each of the retinal images in the second set comprising a plurality of pixels; performing lesion analysis comprising: detecting interesting pixels; computing descriptors from the images; and classifying active regions using machine learning techniques; conducting image-to-image registration of a second image from the second set and a first image from the first set using retinal image registration, the registration comprising: identifying pixels in the first image as landmarks; identifying pixels in the second image as landmarks; computing descriptors at landmark pixels; matching descriptors across the first image and the second image; and estimating a transformation model to align the first image and the second image; computing changes in lesions and anatomical structures in registered images
- non-transitory computer storage that stores executable program instructions.
- the non-transitory computer storage may include instructions that, when executed by one or more computing devices, configure the one or more computing devices to perform operations including: accessing a first set of retinal images related to one or more visits from a patient, each of the retinal images in the first set comprising a plurality of pixels; accessing a second set of retinal images related to a current visit from the patient, each of the retinal images in the second set comprising a plurality of pixels; performing lesion analysis comprising: detecting interesting pixels; computing descriptors from the images; and classifying active regions using machine learning techniques; conducting image-to-image registration of a second image from the second set and a first image from the first set using retinal image registration, the registration comprising: identifying pixels in the first image as landmarks; identifying pixels in the second image as landmarks; computing descriptors at landmark pixels; matching descriptors across the first image and the second image; and estimating a transformation model to align the
- a computing system for identifying the quality of an image to infer its appropriateness for manual or automatic grading id disclosed.
- the computing system may include: one or more hardware computer processors; and one or more storage devices configured to store software instructions configured for execution by the one or more hardware computer processors in order to cause the computing system to: access a retinal image related to a subject; automatically compute descriptors from the retinal image, the descriptors comprising a vector of a plurality of values for capturing a particular quality of an image and including one or more of: focus measure descriptors, saturation measure descriptors, contrast descriptors, color descriptors, texture descriptors, or noise metric descriptors; and use the descriptors to classify image suitability for grading comprising one or more of: support vector machine, support vector regression, k-nearest neighbor, naive Bayes, Fisher linear discriminant, neural network, deep learning, or convolution networks.
- a computer implemented method for identifying the quality of an image to infer its appropriateness for manual or automatic grading may include: accessing a retinal image related to a subject; automatically computing descriptors from the retinal image, the descriptors comprising a vector of a plurality of values for capturing a particular quality of an image and including one or more of: focus measure descriptors, saturation measure descriptors, contrast descriptors, color descriptors, texture descriptors, or noise metric descriptors; and using the descriptors to classify image suitability for grading comprising one or more of: support vector machine, support vector regression, k-nearest neighbor, naive Bayes, Fisher linear discriminant, neural network, deep learning, or convolution networks.
- non-transitory computer storage that stores executable program instructions.
- the non-transitory computer storage may include instructions that, when executed by one or more computing devices, configure the one or more computing devices to perform operations including: accessing a retinal image related to a subject; automatically computing descriptors from the retinal image, the descriptors comprising a vector of a plurality of values for capturing a particular quality of an image and including one or more of: focus measure descriptors, saturation measure descriptors, contrast descriptors, color descriptors, texture descriptors, or noise metric descriptors; and using the descriptors to classify image suitability for grading comprising one or more of: support vector machine, support vector regression, k-nearest neighbor, naive Bayes, Fisher linear discriminant, neural network, deep learning, or convolution networks.
- a retinal fundus image is acquired from a patient, then active or interesting regions comprising active pixels from the image are determined using multi-scale background estimation. The inherent scale and orientation at which these active pixels are described is determined automatically.
- a local description of the pixels may be formed using one or more of median filterbank descriptors, shape descriptors, edge flow descriptors, spectral descriptors, mutual information, or local texture descriptors.
- One embodiment of the system provides a framework that allows computation of these descriptors at multiple scales.
- supervised learning and classification can be used to obtain a prediction for each pixel for each class of lesion or retinal anatomical structure, such as optic nerve head, veins, arteries, and/or fovea.
- a joint segmentation-recognition method can be used to recognize and localize the lesions and retinal structures.
- this lesion information is further processed to generate a prediction score indicating the severity of retinopathy in the patient, which provides context determining potential further operations such as clinical referral or recommendations for the next screening date.
- the automated detection of retinal image lesions is performed using images obtained from prior and current visits of the same patient. These images may be registered using the disclosed system. This registration allows for the alignment of images such that the anatomical structures overlap, and for the automated quantification of changes to the lesions.
- system may compute quantities including, but not limited to, appearance and disappearance rates of lesions (such as microaneurysms), and quantification of changes in number, area, perimeter, location, distance from fovea, or distance from optic nerve head.
- lesions such as microaneurysms
- quantification of changes in number, area, perimeter, location, distance from fovea, or distance from optic nerve head can be used as image-based biomarker for monitoring progression, early detection, or evaluating efficacy of treatment, among many other uses.
- FIG. 1 shows one embodiment in which retinal image analysis can be applied.
- FIG. 2 illustrates various embodiments of an image enhancement system and process.
- FIG. 3 is a block diagram of one embodiment for computing an enhanced image of an input retinal image.
- FIGS. 4A and 4C show examples of embodiments of retinal images taken on two different retinal devices.
- FIGS. 4B and 4D show examples of embodiments of median normalized images.
- FIGS. 4E and 4F demonstrate an example of embodiments of improved lesion and vessel visibility after image enhancement.
- FIGS. 5A and 5B show examples of embodiments of retinal images.
- FIGS. 5C and 5D show examples of embodiments of a retinal fundus mask.
- FIGS. 6A and 6B show an example of embodiments of before and after noise removal.
- FIG. 7A is a block diagram of one embodiment of a system for identifying image regions with similar properties across multiple images.
- FIG. 7B is a block diagram of one embodiment of a system for identifying an encounter level fundus mask.
- FIGS. 8A , 8 B, 8 C, and 8 D show examples of embodiments of retinal images from a single patient encounter.
- FIGS. 8E , 8 F, 8 G, and 8 H show examples of embodiments of a retinal image-level fundus mask.
- FIGS. 8I , 8 J, 8 K, and 8 L show examples of embodiments of a retinal encounter-level fundus mask.
- FIG. 9A depicts one embodiment of a process for lens dust artifact detection.
- FIGS. 9B , 9 C, 9 D, and 9 E are block diagrams of image processing operations used in an embodiment of lens dust artifact detection.
- FIGS. 10A , 10 B, 10 C, and 10 D show embodiments of retinal images from encounters with lens dust artifact displayed in the insets.
- FIG. 10E shows an embodiment of an extracted lens dust binary mask using an embodiment of lens dust artifact detection.
- FIGS. 10F , 10 G, 10 H, and 10 I show embodiments of retinal images from one encounter with lens dust artifact displayed in the inset.
- FIG. 10J shows an embodiment of an extracted lens dust binary mask using an embodiment of lens dust artifact detection.
- FIGS. 10K , 10 L, 10 M, and 10 N show embodiments of retinal images from one encounter with lens dust artifact displayed in the inset.
- FIG. 10O shows an extracted lens dust binary mask using an embodiment of lens dust artifact detection.
- FIG. 11 is a block diagram of one embodiment for evaluating an interest region detector at a particular scale.
- FIG. 12A shows one embodiment of an example retinal fundus image.
- FIG. 12B shows one embodiment of an example of interest region detection for the image in FIG. 12A using one embodiment of the interest region detection block.
- FIG. 13A is a block diagram of one embodiment of registration or alignment of a given pair of images.
- FIG. 13B is a block diagram of one embodiment of computation of descriptors for registering two images.
- FIG. 14 shows embodiments of an example of keypoint matches used for defining a registration model, using one embodiment of the image registration module.
- FIG. 15 shows embodiments of an example set of registered images using one embodiment of the image registration module.
- FIG. 16 shows example embodiments of lens shot images.
- FIG. 17 illustrates various embodiments of an image quality analysis system and process.
- FIG. 18 is a block diagram of one embodiment for evaluating gradability of a given retinal image.
- FIG. 19 shows one embodiment of example vessel enhancement images computed using one embodiment of the vesselness computation block.
- FIG. 20A shows an example of embodiments of visibility of retinal layers in different channels of an image-color fundus image.
- FIG. 20B shows one embodiment of a red channel of a retinal image displaying vasculature from the choroidal layers.
- FIG. 20C shows one embodiment of a green channel of a retinal image which captures the retinal vessels and lesions.
- FIG. 20D shows one embodiment of a blue channel of a retinal image which does not capture much retinal image information.
- FIG. 21 shows an example of one embodiment of an automatic image quality assessment with a quality score output overlaid on retinal images.
- FIG. 22 is a block diagram of one embodiment for generating a vessel enhanced image.
- FIG. 23 shows one embodiment of a receiver operating characteristics (ROC) curve for vessel classification obtained using one embodiment of a vesselness computation block on a STARE (Structured Analysis of the Retina) dataset.
- ROC receiver operating characteristics
- FIG. 24 shows one embodiment of images generated using one embodiment of a vesselness computation block.
- FIG. 25 is a block diagram of one embodiment of a setup to localize lesions in an input retinal image.
- FIG. 26A shows one embodiment of an example of microaneurysms localization.
- FIG. 26B shows one embodiment of an example of hemorrhages localization.
- FIG. 26C shows one embodiment of an example of exudates localization.
- FIG. 27 shows one embodiment of a graph demonstrating performance of one embodiment of the lesion localization module in terms of free response ROC plots for lesion detection.
- FIG. 28 illustrates various embodiments of a lesion dynamics analysis system and process.
- FIG. 29A depicts an example of one embodiment of a user interface of a tool for lesion dynamics analysis depicting persistent, appeared, and disappeared lesions.
- FIG. 29B depicts an example of one embodiment of a user interface of a tool for lesion dynamics analysis depicting plots of lesion turnover.
- FIG. 29C depicts an example of one embodiment of a user interface of a tool for lesion dynamics analysis depicting overlay of the longitudinal images.
- FIG. 30 is a block diagram of one embodiment for evaluating longitudinal changes in lesions.
- FIGS. 31A and 31B show patches of aligned image patches from two longitudinal images.
- FIGS. 31C and 31D show persistent microaneurysms (MAs) along with the new and disappeared MAs.
- FIG. 32A shows a patch of an image with MAs.
- FIG. 32B shows ground truth annotations marking MAs.
- FIG. 32C shows MAs detected by one embodiment with a confidence of the estimate depicted by the brightness of the disk.
- FIG. 33A shows embodiments of local registration refinement with baseline and month 6 images registered and overlaid.
- FIG. 33B shows embodiments of local registration refinement with baseline image, and enhanced green channel when the dotted box shows a region centered on the detected microaneurysm, and with an inset showing a zoomed version.
- FIG. 33C shows embodiments of local registration refinement with a month 6 image, enhanced green channel, the new lesion location after refinement correctly identified as persistent.
- FIG. 34A shows embodiments of microaneurysms turnover (or appearance) rates ranges, number of MAs per year, computed (in gray), and ground truth values (black circles) for various images in a dataset.
- FIG. 34B shows embodiments of microaneurysms turnover (or disappearance) rates ranges, number of MAs per year, computed (in gray), and ground truth values (black circles) for various images in a dataset.
- FIG. 35 illustrates various embodiments of an image screening system and process.
- FIG. 36A depicts an example of one embodiment of a user interface of a tool for screening for a single encounter.
- FIG. 36B depicts an example of one embodiment of a user interface of a tool for screening with detected lesions overlaid on an image.
- FIG. 36C depicts an example of one embodiment of a user interface of a tool for screening for multiple encounters.
- FIG. 36D depicts an example of one embodiment of a user interface of a tool for screening for multiple encounters with detected lesions overlaid on an image.
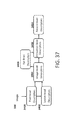
- FIG. 37 is a block diagram of one embodiment that indicates evaluation of descriptors at multiple levels.
- FIG. 38 is a block diagram of one embodiment of screening for retinal abnormalities associated with diabetic retinopathy.
- FIG. 39 shows an embodiment of an ROC plot for one embodiment of screening classifier with a 50/50 train-test split.
- FIG. 40 shows an embodiment of an ROC plot for one embodiment on entire dataset with cross dataset training.
- FIGS. 41A and 41B show embodiments of Cytomegalovirus retinitis screening results using one embodiment of the Cytomegalovirus retinitis detection module for “normal retina” category screened as “no refer”.
- FIGS. 41C and 41D show embodiments of Cytomegalovirus retinitis screening results using one embodiment of the Cytomegalovirus retinitis detection module for “retina with CMVR” category screened as “refer”.
- FIGS. 41E and 41F show embodiments of Cytomegalovirus retinitis screening results using one embodiment of the Cytomegalovirus retinitis detection module for “cannot determine” category screened as “refer”.
- FIG. 42 is a block diagram of one embodiment of screening for retinal abnormalities associated with Cytomegalovirus retinitis.
- FIG. 43A outlines the operation of one embodiment of an Image Analysis System-Picture Archival and Communication System Application Program Interface (API).
- API Image Analysis System-Picture Archival and Communication System Application Program Interface
- FIG. 43B outlines the operation of an additional API.
- FIG. 44 illustrates various embodiments of a cloud-based analysis and processing system and process.
- FIG. 45 illustrates architectural details of one embodiment of a cloud-based analysis and processing system.
- FIG. 46 is a block diagram showing one embodiment of an imaging system to detect diseases.
- Retinal diseases in humans can be manifestations of different physiological or pathological conditions such as diabetes that causes diabetic retinopathy, cytomegalovirus that causes retinitis in immune-system compromised patients with HIV/AIDS, intraocular pressure buildup that results in optic neuropathy leading to glaucoma, age-related degeneration of macula seen in seniors, and so forth.
- diabetes that causes diabetic retinopathy
- cytomegalovirus that causes retinitis in immune-system compromised patients with HIV/AIDS
- intraocular pressure buildup that results in optic neuropathy leading to glaucoma
- age-related degeneration of macula seen in seniors and so forth.
- stress-filled lifestyles have resulted in a rapid increase in the number of patients suffering from these vision threatening conditions.
- DM Diabetes mellitus
- DR Diabetic retinopathy
- Clinical trials have demonstrated that early detection and treatment of DR can reduce vision loss by 90%.
- DR is the leading cause of blindness in the adult working age population. Technologies that allow early screening of diabetic patients who are likely to progress rapidly would greatly help reduce the toll taken by this blinding eye disease. This is especially important because DR progresses without much pain or discomfort until the patient suffers actual vision loss, at which point it is often too late for effective treatment.
- telescreening programs are being implemented worldwide. These programs use fundus photography, using a fundus camera typically deployed at a primary care facility where the diabetic patients normally go for monitoring and treatment. Such telemedicine programs significantly help in expanding the DR screening, but are still limited by the need for human grading, of the fundus photographs, which is typically performed at a reading center.
- Methods and systems are disclosed that provide automated image analysis allowing detection, screening, and/or monitoring of retinal abnormalities, including diabetic retinopathy, macular degeneration, glaucoma, retinopathy of prematurity, cytomegalovirus retinitis, and hypertensive retinopathy.
- the methods and systems can be used to conduct automated screening of patients with one or more retinal diseases. In one embodiment, this is accomplished by first identifying interesting regions in an image of a patient's eye for further analysis, followed by computation of a plurality of descriptors of interesting pixels identified within the image. In this embodiment, these descriptors are used for training a machine learning algorithm, such as support vector machine, deep learning, neural network, naive Bayes, and/or k-nearest neighbor. In one embodiment, these classification methods are used to generate decision statistics for each pixel, and histograms for these pixel-level decision statistics are used to train another classifier, such as one of those mentioned above, to allow screening of one or more images of the patient's eye.
- a machine learning algorithm such as support vector machine, deep learning, neural network, naive Bayes, and/or k-nearest neighbor.
- these classification methods are used to generate decision statistics for each pixel, and histograms for these pixel-level decision statistics are used to train another class
- a dictionary of descriptor sets are formed using a clustering method, such as k-means, and this dictionary is used to form a histogram of codewords for an image.
- the histogram descriptors are combined with the decision statistics histogram descriptors before training image-level, eye-level, and/or encounter-level classifiers.
- multiple classifiers are each trained for specific lesion types and/or for different diseases.
- a score for a particular element can be generated by computing the distance of the given element from the classification boundary.
- the screening system is further included in a telemedicine system, and the screening score is presented to a user of the telemedicine system.
- the methods and systems can also be used to conduct automated identification and localization of lesions related to retinal diseases, including but not limited to diabetic retinopathy, macular degeneration, retinopathy of prematurity, or cytomegalovirus retinitis.
- the methods and systems can also be used to compute biomarkers for retinal diseases based on images taken at different time intervals, for example, approximately once every year or about six months.
- the images of a patient's eye from different visits are co-registered.
- the use of a lesion localization module allows for the detection of lesions as well as a quantification of changes in the patient's lesions over time, which is used as an image-based biomarker.
- the methods and systems can also be used to conduct co-registration of retinal images.
- these images could be of different fields of the eye, and in another embodiment these images could have been taken at different times.
- the methods and systems can also be used to enhance images to make it easier to visualize the lesions by a human observer or for analysis by an automated image analysis system.
- FIG. 1 shows one embodiment in which retinal image analysis is applied.
- the patient 19000 is imaged using a retinal imaging system 19001 .
- the image/images 19010 captured are sent for processing on a computing cloud 19014 , a computer or computing system 19004 , or a mobile device 19008 .
- the results of the analysis are sent back to the health professional 19106 and/or to the retinal imaging system 19001 .
- the systems and methods disclosed herein include an automated screening system that processes automated image analysis algorithms that can automatically evaluate fundus photographs to triage patients with signs of diabetic retinopathy (DR) and other eye diseases.
- An automated telescreening system can assist an at-risk population by helping reduce the backlog in one or more of the following ways.
- automated screening systems may include one or more of the following features:
- the accuracy, sensitivity and specificity should be high enough to match trained human graders, though not necessarily retina experts. Studies suggest that sensitivity of 85%, with high enough specificity, is a good target but other sensitivity levels may be acceptable.
- a computerized retinal disease screening system is configured to work in varying imaging conditions.
- a screening system processes and grades large, growing databases of patient images.
- the speed at which the algorithm performs grading can be important.
- testing time for a new image to be screened remains constant even as the database grows, such that it does not take longer to screen a new test image as the database size increases as more patients are screened. What is sometimes desired is a method that takes a constant time to evaluate a new set of patient images even as the database size grows.
- the system does not disrupt the existing workflow that users are currently used to. This means that the system inter-operates with a variety of existing software. What is sometimes desired is a system that can be flexibly incorporated into existing software and devices.
- biomarker a measurable quantity that correlates with the clinical progression of the disease and greatly enhances the clinical care available to the patients. It could also positively impact drug research, facilitating early and reliable determination of biological efficacy of potential new therapies. It will be a greatly added benefit if the biomarker is based only on images, which would lead to non-invasive and inexpensive techniques. Because retinal vascular changes often reflect or mimic changes in other end organs, such as the kidney or the heart, the biomarker may also prove to be a valuable assay of the overall systemic vascular state of a patient with diabetes.
- Lesion dynamics such as microaneurysm (MA) turnover
- MA microaneurysm
- a system that improves the lesion detection and localization accuracy could be beneficial.
- a system and method for computation of changes in retinal image lesions over successive visits would also be of value by leading to a variety of image-based biomarkers that could help monitor the progression of diseases.
- the systems and methods provide for various features of automated low-level image processing, which may include image enhancement or image-level processing blocks.
- the system may also make it easier for a human or an automated system to evaluate a retinal image and to visualize and quantify retinal abnormalities.
- Retinal fundus images can be acquired from a wide variety of cameras, under varying amounts of illumination, by different technicians, and on different people. From an image processing point of view, these images have different colors levels, different dynamic ranges, and different sensor noise levels. This makes it difficult for a system to operate on these images using the same parameters. Human image graders or experts may also find it a hindrance that the images often look very different overall. Therefore, in some embodiments, the image enhancement process applies filters on the images to enhance them in such a way that their appearance is neutralized. After this image enhancement processing, the enhanced images can be processed by the same algorithms using identical or substantially similar parameters.
- FIG. 2 shows one embodiment of a detailed view of the different scenarios in which image enhancement can be applied.
- the patient 29000 is imaged by an operator 29016 using an image capture device 29002 .
- the image capture device is depicted as a retinal camera.
- the images captured are sent to a computer or computing system 29004 for image enhancement.
- Enhanced images 29202 are then sent for viewing or further processing on the cloud 19014 , or a computer or computing device 19004 or a mobile device 19008 .
- the images 29004 could directly be sent to the cloud 19014 , the computer or computing device 19004 , or the mobile device 19008 for enhancement and/or processing.
- the patient 29000 may take the image himself using an image capture device 29006 , which in this case is shown as a retinal camera attachment for a mobile device 29008 .
- the image enhancement is then performed on the mobile device 29008 .
- Enhanced images 29204 can then be sent for viewing or further processing.
- FIG. 3 gives an overview of one embodiment of computing an enhanced image.
- the blocks shown here may be implemented in the cloud 19014 , on a computer or computing system 19004 , or a mobile device 19008 , or the like.
- the image 100 refers in general to the retinal data, single or multidimensional, that has been captured using a retinal imaging device, such as camera for color image capture, fluorescein angiography (FA), adaptive optics, optical coherence tomography (OCT), hyperspectral imaging, scanning laser ophthalmoscope (SLO), wide-field imaging or ultra-wide-field imaging.
- Background estimation block 800 estimates the background of the image 100 at a given scale.
- Adaptive intensity scaling 802 is then applied to scale the image intensity based on local background intensity levels.
- Image enhancement module 106 enhances the image to normalize the effects of lighting, different cameras, retinal pigmentation and the like. An image is then created that excludes/ignores objects smaller than a given size.
- the images are first subjected to an edge-preserving bilateral filter such as the filter disclosed in Carlo Tomasi and Roberto Manduchi, “Bilateral Filtering for Gray and Color Images,” in Computer Vision, 1998. Sixth International Conference on, 1998, 839-846; and Ben Weiss, “Fast Median and Bilateral Filtering,” in ACM Transactions on Graphics ( TOG ), vol. 25, 2006, 519-526.
- the filter removes noise without affecting important landmarks such as lesions and vessels.
- the system then uses a median filter based normalization technique, referred to as median normalization, to locally enhance the image at each pixel using local background estimation.
- median normalization a median filter based normalization technique
- I Norm,S at pixel location (x,y) is computed as
- I Norm , S ⁇ ( x , y ) ⁇ C mid + ( C mid - 1 ) ⁇ if ⁇ ⁇ I ⁇ ( x , y ) ⁇ I Back , S ⁇ ( x , y ) , I ⁇ ( x , y ) - I Back , S ⁇ ( x , y ) C max - I Back , S ⁇ ( x , y ) C mid ⁇ I ⁇ ( x , y ) I Back , S ⁇ ( x , y ) otherwise Equation ⁇ ⁇ 1
- B is the image bit-depth
- I Back is background image obtained using a median filter over the area S
- [C min ,C max ] [0,255]
- C mid 128.
- a circle, a square, or a regular polygon is used.
- a square may be used with a pre-defined size.
- FIGS. 4B and 4D show embodiments of some example median normalized images for the input images shown in FIG. 4A and FIG. 4C respectively. Note that this normalization improves the visibility of structures such as lesions and vessels in the image as shown in FIG. 4E and FIG. 4F .
- the inset in FIGS. 4E and 4F show the improved visibility of microaneurysm lesions.
- the results of this image enhancement algorithm have also been qualitatively reviewed by retina experts at Doheny Eye Institute, and they concur with the observations noted here. The effectiveness of this algorithm is demonstrated by superior cross-dataset performance of the system described below in the section entitled “Screening Using Lesion Classifiers Trained On Another Dataset (Cross-Dataset Testing).”
- retinal fundus photographs have a central circular region of the eye visible, with a dark border surrounding it.
- information pertaining to the patient, or the field number may also be embedded in the corners of the photograph.
- border regions of the photograph do not provide any useful information and therefore it is desirable to ignore them.
- border regions of the retinal photographs are automatically identified using morphological filtering operations as described below.
- the input image is first blurred using a median filter.
- a binary mask is then generated by thresholding this image so that locations with pixel intensity values above a certain threshold are set to 1 in the mask, while other areas are set to 0.
- the threshold is empirically chosen so as to nullify the pixel intensity variations in the border regions, so that they go to 0 during thresholding. In one embodiment, this threshold is automatically estimated.
- the binary mask is then subjected to region dilation and erosion morphological operations, to obtain the final mask.
- the median filter uses a radius of 5 pixels, and, the threshold for binary mask generation is 15 for an 8-bit image with pixel values ranging from [0,255], though other radii and thresholds can be used.
- the dilation and erosion operations can be performed using rectangular structuring elements, such as, for example, size 10 and 20 pixels respectively.
- FIG. 5A and FIG. 5B show two different retinal image types
- FIG. 5C and FIG. 5D show embodiments of fundus masks for these two images generated using the above described embodiment.
- ONH optic nerve heard
- a ONH can be robustly detected using an approach that mirrors the one for lesions as described in section below entitled “Lesion Localization”.
- multi-resolution decomposition and template matching is employed for ONH localization.
- the ONH localization is performed on a full resolution retinal fundus image, or a resized version of the image, or the image (full or resized) processed using one or more morphological filters that can be chosen from minimum filter or maximum filter, dilation filter, morphological wavelet filter, or the like.
- An approximate location of the ONH is first estimated in the horizontal direction by filtering horizontal strips of the image whose height is equal to the typical ONH diameter and width is equal to the image width, with a filter kernel of size approximately equal to the typical ONH size.
- the filter kernel can be: a circle of specific radius, square of specific side and orientation, Gaussian of specific sigmas (that is, standard deviations), ellipse of specific orientation and axes, rectangle of specific orientation and sides, or a regular polygon of specific side.
- the filtered image strips are converted to a one-dimensional signal by collating the data along the vertical dimension by averaging or taking the maximum or minimum or the like.
- the largest N local maxima of the one-dimensional signal whose spatial locations are considerably apart are considered as likely horizontal locations of the ONH since the ONH is expected to be a bright region.
- the vertical position of the ONH is approximated by examining vertical image strips centered about the N approximate horizontal positions. This ONH position approximation technique produces M approximate locations for the ONH.
- the approximate sizes or radii of the possible ONHs can be estimated by using a segmentation algorithm such as the marker-controlled watershed algorithm.
- the markers are placed based on the knowledge of the fundus mask and approximate ONH location.
- typical ONH sizes or radii can also be used as approximate ONH sizes or radii.
- these approximate locations and sizes for the ONH can be refined by performing template matching in a neighborhood about these approximate ONH locations and choosing the one location and size that gives the maximum confidence or probability of ONH presence.
- the ONH position can be estimated as the vertex of the parabola approximation to the major vascular arch.
- the images are standardized by scaling them to have identical or near identical pixel pitch.
- the pixel pitch is computed using the resolution of the image and field of view information from the metadata.
- the pixel pitch is estimated by measuring the optic nerve head (ONH) size in the image as described in the section above entitled “Optic Nerve Head Detection.”
- OHP optic nerve head
- an average ONH size of 2 mm can be used.
- the image at the end of size standardization is referred to as I s 0 .
- the fundus mask is generated for I s 0 and can be used for further processing.
- the diameter of the fundus mask is used as a standard quantity for the pitch. The diameter may be calculated as described in the section above entitled “Image-Level Fundus Mask Generation” or in the section below entitled “Encounter-Level Fundus Mask Generation.”
- a bilateral filter may be used, such as, for example, the filter disclosed in Tomasi and Manduchi, “Bilateral Filtering for Gray and Color Images”, and Weiss, “Fast Median and Bilateral Filtering.”
- Bilateral filtering is a normalized convolution operation in which the weighting for each pixel p is determined by the spatial distance from the center pixel s, as well as its relative difference in intensity.
- the bilateral filtering operation is defined as follows:
- FIG. 6A shows one embodiment of an enlarged portion of a retinal image before noise removal and FIG. 6B shows one embodiment of the same portion after noise removal. It can be observed that the sensor noise is greatly suppressed while preserving lesion and vessel structures.
- images While capturing images using commercial cameras, retinal cameras, or medical imaging equipment, several images could be captured in a short duration of time without changing the imaging hardware. These images will have certain similar characteristics that can be utilized for various tasks, such as image segmentation, detection, or analysis. However, the images possibly may have different fields of view or illumination conditions.
- FIG. 7A depicts one embodiment of an algorithmic framework to determine regions without useful image information from images captured during an encounter.
- the illustrated blocks may be implemented on the cloud 19014 , a computer or computing device 19004 , a mobile device 19008 , the like as shown in FIG. 1 .
- This analysis may be helpful when regions with useful information are sufficiently different across the images in an encounter compared to the outside regions without useful information.
- the N images 74802 in the encounter are denoted as I (1) , I (2) . . . I (N) .
- the regions that are similar across the images in the encounter are determined as those pixel positions where most of the pair-wise differences 74804 are small in magnitude 74806 .
- the regions that are similar across most of the N images in the encounter include regions without useful image information.
- regions also include portions of the region with useful image information that are also similar across most of the images in the encounter. Therefore, to exclude such similar regions with useful information, additional constraints 74808 can be included and logically combined 74810 with the regions determined to be similar and obtain the fundus mask 74812 . For example, regions outside the fundus portion of retinal images usually have low pixel intensities and can be used to determine which region to exclude.
- FIG. 7B depicts one embodiment of an algorithmic framework that determines a fundus mask for the retinal images in an encounter.
- the encounter-level fundus mask generation may be simplified, with low loss in performance by using only the red channel of the retinal photographs denoted as I (1),r , I (2),r , . . . I (N),r 74814 . This is because in most retinal photographs, the red channel has very high pixel values within the fundus region and small pixel values outside the fundus region.
- the noise may be removed from the red channels of the images in an encounter as described in the section above entitled “Noise Removal”. Then, the absolute differences between possible pairs of images in the encounter are computed 74816 and the median across the absolute difference images is evaluated 74818 .
- Pixels at a given spatial position in the images of an encounter are declared to be outside the fundus if the median of the absolute difference images 74818 at that position is low (for example, close to zero), 74820 , and 74824 if the median of those pixel values is also small 74822 .
- the fundus mask 74828 is obtained by logically negating 74826 the mask indicating regions outside the fundus.
- prior techniques to determine fundus masks include processing one retinal image at a time, which are based on thresholding the pixel intensities in the retinal image.
- these image-level fundus mask generation algorithms may be accurate for some retinal fundus photographs, they could fail for photographs that have dark fundus regions, such as those shown in FIG. 8 .
- the failure of the image-level fundus mask generation algorithm as in FIG. 8E and FIG. 8H is primarily due to the pixel intensity thresholding operation that discards dark regions that have low pixel intensities in the images shown in FIG. 8A and FIG. 8D .
- image-level fundus mask generation can be overcome by computing a fundus mask using multiple images in an encounter, that is a given visit of a given patient. For example, three or more images in an encounter may be used if the images in the encounter have been captured using the same imaging hardware and settings and hence have the same fundus mask. Therefore, the encounter-level fundus mask computed using data from multiple images in an encounter will be more robust for low pixel intensities in the regions with useful image information.
- FIGS. 8I , 8 J, 8 K, and 8 L Embodiments of encounter-level fundus masks generated using multiple images within an encounter are shown in FIGS. 8I , 8 J, 8 K, and 8 L. It can be noted that in FIGS. 8A and 8D , pixels with low intensity values that are within the fundus regions are correctly identified by the encounter-level fundus mask shown in FIGS. 8I and 8L , unlike in the image-level fundus masks shown in FIGS. 8E and 8H .
- the fundus mask generation algorithm validates that the images in an encounter share the same fundus mask by computing the image-level fundus masks and ensuring that the two masks obtained differ in less than, for example, 10% of the total number of pixels in each image by logically “AND”-ing and “OR”-ing the individual image-level fundus masks. If the assumption is not validated, the image-level fundus masks are used and the encounter-level fundus masks are not calculated. Median values of absolute differences that are close to zero can be identified by hysteresis thresholding, for example by using techniques disclosed in John Canny, “A Computational Approach to Edge Detection,” Pattern Analysis and Machine Intelligence, IEEE Transactions on no. 6 (1986): 679-698.
- the upper threshold is set to ⁇ 2
- the lower threshold is set to ⁇ 3, such that medians of the pixel values are determined to be small if they are less than 15, the same value used for thresholding pixel values during image-level fundus mask generation.
- Dust and blemishes in the lens or sensor of an imaging device manifest as artifacts in the images captured using that device.
- these dust and blemish artifacts can be mistaken to be pathological manifestations.
- the dust and blemish artifacts can be mistaken for lesions by both human readers and image analysis algorithms.
- detecting these artifacts using individual images is difficult since the artifacts might be indistinguishable from other structures in the image.
- images in an encounter are often captured using the same imaging device and settings, the blemish artifacts in these images will be co-located and similar looking.
- lens dust artifacts due to dust and blemishes on the lens or in the sensor are termed as lens dust artifacts for simplicity and brevity, since they can be detected using similar techniques within the framework described below.
- FIG. 9A depicts one embodiment of a process for lens dust artifact detection.
- the blocks for lens dust artifact detection may be implemented on the cloud 19014 , or a computer or computing device 19004 , a mobile device 19008 , or the like, as shown in FIG. 1 .
- the individual images are first processed 92300 to detect structures that could possibly be lens dust artifacts. Detected structures that are co-located across many of the images in the encounter are retained 92304 , while the others are discarded.
- the images in the encounter are also independently smoothed 92302 and processed to determine pixel positions that are similar across many images in the encounter 92306 .
- the lens dust mask 92310 indicates similar pixels that also correspond to co-located structures 92308 as possible locations for lens dust artifacts.
- lens dust detection is disabled if there are fewer than three images in the encounter, since in such a case, the lens dust artifacts detected may not be reliable.
- the lens dust detection uses the red and blue channels of the photographs since vessels and other retinal structures are most visible in the green channel and can accidentally align in small regions and be misconstrued as lens dust artifacts.
- the lens dust artifacts are detected using multiple images in the encounter as described below and indicated by a binary lens dust mask which has true values at pixels most likely due to lens dust artifacts.
- noise may be removed from the images in the encounter using the algorithm described in the section above entitled “Noise Removal”.
- N ⁇ 3 and the image-level fundus masks are consistent, for example as determined by performing encounter-level fundus mask generation, the input images comprising the red and blue channels are individually normalized and/or enhanced using the processes described in the section above entitled “Image Enhancement.” As shown in FIG.
- the mask M bright,dark (i),r for the red channel and the mask M bright,dark (i),b for the blue channel are further logically “OR”-ed to get a single mask M bright,dark (i) 92334 showing locations of bright and dark structures that are likely to be lens dust artifacts in the image I (i) . If a spatial location is indicated as being part of a bright or dark structure in more than 50% of the images in the encounter 92336 , it is likely that a lens dust artifact is present at that pixel location. This is indicated in a binary mask M colocated struct 92338 .
- FIG. 10 shows embodiments of retinal images from encounters with lens dust artifacts shown in the insets.
- Lens dust artifacts in images 1 through 4 of three different encounters are indicated by the black arrows within the magnified insets.
- the lens dust masks obtained for the three encounters using the above described process are shown in FIGS. 10E , 10 J, and 10 O.
- Encounter A FIGS. 10A , 10 B, 10 C, and 10 D
- the lens dust mask also incorrectly marks some smooth regions without lesions and vessels along the edge of the fundus that are similar across the images (top-right corner of FIG. 10E ).
- Encounter B ( FIGS. 10F , 10 G, 10 H, and 10 I) has a large, dark lens dust artifact that is captured in the lens dust mask in FIG. 10J .
- Encounter C ( FIGS. 10K , 10 L, 10 M, and 10 N) has a tiny, faint, microaneurysm-like lens dust artifact that is persistent across multiple images in the encounter. It is detected by the process and indicated in the lens dust mask in FIG. 10O .
- the hysteresis thresholding of the median normalized difference I diff (i),c to obtain the bright mask is performed using an upper threshold that is the maximum of 50 and the 99th percentile of the difference values and a lower threshold that is the maximum of 40 and the 97th percentile of the difference values.
- the dark mask is obtained by hysteresis thresholding ⁇ I diff (i),c (the negative of the median normalized difference) with an upper threshold; for example, the minimum of 60 and the 99th percentile of ⁇ I diff (i),c and a lower threshold that is the minimum of 50 and the 97th percentile of ⁇ I diff (i),c .
- ⁇ I diff range c (the negative difference of the 80th and 20th percentile of the pair-wise absolute differences of I h,smooth (i),c ) is hysteresis thresholded with an upper threshold that is the maximum of ⁇ 5 and 95th percentile of ⁇ I diff range c and a lower threshold that is the minimum of ⁇ 12 and 90th percentile of ⁇ I diff range c .
- ⁇ I diff range c the negative difference of the 80th and 20th percentile of the pair-wise absolute differences of I h,smooth (i),c ) is hysteresis thresholded with an upper threshold that is the maximum of ⁇ 5 and 95th percentile of ⁇ I diff range c and a lower threshold that is the minimum of ⁇ 12 and 90th percentile of ⁇ I diff range c .
- other values may be used to implement the processor.
- a large percentage of a retinal image comprises of background retina pixels which do not contain any interesting pathological or anatomic structures. Identifying interesting pixels for future processing can provide significant improvement in processing time, and in reducing false positives.
- multi-scale morphological filterbank analysis is used to extract interesting pixels for a given query. This analysis allows the systems and methods to be used to construct interest region detectors specific to lesions of interest. Accordingly, a query or request can be submitted which has parameters specific to a particular concern. As one example, the query may request the system to return “bright blobs larger than 64 pixels in area but smaller than 400 pixels”, or “red elongated structures that are larger than 900 pixels”. A blob includes a group of pixels with common local image properties.
- FIG. 11 depicts one embodiment of a block diagram for evaluating interest region pixels at a given scale.
- the illustrated blocks may be implemented either on the cloud 19014 , a computer or computing device 19004 , a mobile device 19008 or the like, as shown in FIG. 1 .
- Scaled image 1200 is generated by resizing image 100 to a particular value.
- “Red/Bright?” 1202 indicates whether the lesion of interest is red or bright.
- Maximum lesion size 1204 indicates the maximum area (in pixels) of the lesion of interest.
- Minimum lesion size 1206 indicates the minimum area (in pixels) of the lesion of interest.
- Median normalized (radius r) 1208 is output of image enhancement block 106 when the background estimation is performed using a disk of radius r.
- Median normalized difference 1210 is the difference between two median normalized images 1208 obtained with different values of radius r.
- Determinant of Hessian 1212 is a map with the determinant of the Hessian matrix at each pixel.
- Local peaks in determinant of Hessian 1214 is a binary image with local peaks in determinant of Hessian marked out.
- Color mask 1216 is a binary image with pixels in the median normalized difference image 1210 over or below a certain threshold marked.
- Hysteresis threshold mask 1218 is a binary image obtained after hysteresis thresholding of input image.
- Masked color image 1220 is an image with just the pixels marked by color mask 1216 set to values as per median normalized difference image 1210 .
- Final masked image 1222 is an image obtained by applying the hysteresis threshold mask 1218 to masked color image 1220 .
- Interest region at a given scale 1224 is a binary mask marking interest regions for further analysis.
- Retinal fundus image I s 0 is scaled down by factor f, n times and scaled images I s 0 , I s 1 . . . I s n are obtained.
- the ratio between different scales is set to 0.8 and 15 scales are used.
- the median normalized images I Norm,r h s k and I Norm,r l s k are computed with radius r h and r l , r h >r l as defined by Equation 1 where S defined as a circle of radius r.
- the Hessian H is computed at each pixel location (x, y) of the difference as:
- H ⁇ ( x , y ) [ L xx ⁇ ( x , y ) L xy ⁇ ( x , y ) L xy ⁇ ( x , y ) L yy ⁇ ( x , y ) ] Equation ⁇ ⁇ 2
- L aa (x, y) is second partial derivative in the a direction
- L ab (x, y) is the mixed partial second derivative in the a and b directions.
- of the difference image I diff s k is the map of the determinant of H at each pixel.
- M ⁇ ( x , y ) ⁇ 1 if ⁇ ⁇ I diff s k ⁇ ( x , y ) ⁇ 0 0 otherwise
- Mask image M if bright pixels are to be marked.
- i max s k max ⁇ ( I col s k ) I col s k ⁇ ( x , y
- F col s k is obtained after hysteresis thresholding I col s k in (3) above with the high threshold t hi and low threshold t lo . This approach may lead to a larger number of interesting points being picked.
- the maximum number of interesting areas (or blobs) that are detected for each scale can be restricted. This approach may lead to better screening performance. Blobs can be ranked based on the determinant of Hessian score. Only the top M blobs per scale based on this determinant of Hessian based ranking are preserved in the interest region mask.
- a blob contrast number can be used to rank the blobs, where the contrast number is generated by computing mean, maximum, or median of intensity of each pixel within the blob, or by using a contrast measure including but not limited to Michelson contrast. The top M blobs per scale based on this contrast ranking are preserved in the interest region mask.
- the union of the top M blobs based on contrast ranking and the top N blobs based on determinant of Hessian based ranking can be used to generate the interest region mask.
- Blobs that were elongated potentially belong to vessels and can be explicitly excluded from this mask. Blobs might be approximately circular or elongated. Approximately circular blobs may often represent lesions. Elongated blobs represent vasculature.
- the top blobs are retained at each scale and this is used to generate the P doh,col mask. The resultant P doh,col is then used to pick the detected pixels.
- Another variation used for P doh,col mask generation was logical OR of the mask obtained with top ranked blobs based on the doh score and the contrast score. Blot hemorrhages can be included by applying a minimum filter at each scale to obtain G col s k rather than using the median normalized difference image.
- FIG. 12B shows the detected interest regions for an example retinal image of FIG. 12A .
- the system may be configured to process the retinal image and during such processing progressively scale up or down the retinal image using a fixed scaling factor; designate groups of neighboring pixels within a retinal image as active areas; and include the active areas from each scale as interest regions across multiple scales.
- the pixels or the local image regions flagged as interesting by the method described above in the section entitled “Interest Region Detection,” can be described using a number or a vector of numbers that form the local region “descriptor”.
- these descriptors are generated by computing two morphologically filtered images with the morphological filter computed over geometric-shaped local regions (such as a structuring element as typically used in morphological analysis) of two different shapes or sizes and taking the difference between these two morphological filtered images. This embodiment produces one number (scalar) describing the information in each pixel.
- oriented morphological descriptors and/or multi-scale morphological descriptors can be obtained.
- a median filter is used as the morphological filter to obtain oriented median descriptors, and multi-scale median descriptors.
- multiple additional types of local descriptors can be computed alongside the median and/or oriented median descriptors.
- the first geometric shape is either a circle or a regular polygon and the second geometric shape is an elongated structure with a specified aspect ratio and orientation
- the system is configured to generate a vector of numbers, the generation comprising: varying an orientation angle of the elongated structure and obtaining a number each for each orientation angle; and stacking the obtained numbers into a vector of numbers.
- the number or the vectors of numbers can be computed on a multitude of images obtained by progressively scaling up and/or down the original input image with a fixed scaling factor referred to as multi-scale analysis, and stacking the obtained vector of numbers into a single larger vector of numbers referred to as multi-scale descriptors.
- Image-to-image registration includes automated alignment of various structures of an image with another image of the same object possibly taken at a different time or different angle, different zoom, or a different field of imaging, where different regions are imaged with a small overlap.
- registration can include identification of different structures in the retinal images that can be used as landmarks. It is desirable that these structures are consistently identified in the longitudinal images for the registration to be reliable.
- the input retinal images (Source image I source , Destination image I dest ) can be split into two parts:
- vessels ONH constant regions in which structures are constant, for example, vessels ONH, and
- variable regions in which structures are changing for example, lesions.
- FIG. 13A shows an overview of the operations involved in registering two images in one embodiment.
- the keypoint descriptor computation block 300 computes the descriptors used for matching image locations from different images.
- One embodiment of the keypoint descriptor computation block is presented in FIG. 13B .
- the blocks shown in FIGS. 13A and 13B here can be implemented on the cloud 19014 , a computer or computing device 19004 , a mobile device 19008 , or the like as shown in FIG. 1 .
- the matching block 302 matches image locations from different images.
- the RANdom Sample And Consensus (RANSAC) based model fitting block 304 estimates image transformations based on the matches computed by the matching block 302 .
- the warping block 306 warps the image based on the estimated image transformation model evaluated by RANSAC based model fitting block 304 .
- Source image 308 is the image to be transformed.
- Destination image 314 is the reference image to whose coordinates the source image 308 is to be warped using the warping block 306 .
- Source image registered to destination image 312 is the source image 308 warped into the destination image 314 coordinates using the warping block 306 .
- FIG. 13B provides an overview of descriptor computation for one embodiment of the image registration module.
- the image 100 can refer to the retinal data, single or multidimensional, that has been captured using a retinal imaging device, such as cameras for color image capture, fluorescein angiography (FA), adaptive optics, optical coherence tomography (OCT), hyperspectral imaging, scanning laser ophthalmoscope (SLO), wide-field imaging or ultra-wide-field imaging.
- Fundus mask generation block 102 can provide an estimation of a mask to extract relevant image sections for further analysis.
- Image gradability computation module 104 can enable computation of a score that automatically quantifies the gradability or quality of the image 100 in terms of analysis and interpretation by a human or a computer.
- Image enhancement module 106 can enhance the image 100 to normalize the effects of lighting, different cameras, retinal pigmentation, or the like.
- Vessel extraction block 400 can be used to extract the retinal vessels from the fundus image 100 .
- Keypoint detection block 402 can evaluate image locations used for matching by matching block 302 .
- Descriptor computation block 404 can evaluate descriptors at keypoint locations to be used for matching by matching block 302 .
- vesselness map is hysteresis thresholded with the high and low thresholds set at 90 and 85 percentiles respectively for the given image. These thresholds may be chosen based on percentage of pixels that are found to be vessel pixels on an average.
- the resulting binary map after removing objects with areas smaller than a predefined threshold, chosen, for example, based on the smallest section of vessels that are to be preserved, V thresh, is used as a mask for potential keypoint locations. For example, 1000 pixels are used as the threshold in one embodiment, a value chosen based on the smallest section of vessels to be preserved.
- the fundus image can be smoothed with Gaussian filters of varying sigma, or standard deviation.
- the range of sigmas, or standard deviations can be chosen based on vessel widths. For example, sigmas ( ⁇ ) of 10, 13, 20 and 35 pixels can be used to locate vessel branches at different scales.
- Scale normalized determinant of Hessian can be computed at pixel locations labeled by V thresh at each of these scales.
- the local image features used as descriptors in some embodiments are listed below. Some descriptors are from a patch of N ⁇ N points centered at the keypoint location. In one embodiment, N is 41 and the points are sampled with a spacing of ⁇ /10. Local image features used as descriptors for matching in one embodiment can include one or more of the following:
- the keypoints in the source and destination images are matched using the above defined descriptors.
- FIG. 14 shows matched keypoints from the source and destination images.
- Euclidean distance is used to measure similarity of keypoints.
- brute-force matching is used get the best or nearly best matches.
- matches that are significantly better than the second best or nearly best match are preserved.
- the ratio of the distance between the best possible match and the second best or nearly best possible match is set to greater than 0.9 for these preserved matches.
- the matches are then sorted based on the computed distance.
- the top M matches can be used for model parameter search using, for example, the RANSAC algorithm. In one embodiment, M can be 120 matches.
- Some embodiments pertain to the estimation of the model for image to image registration.
- the RANSAC method can be used to estimate a model in the presence of outliers. This method is helpful even in situations where many data points are outliers, which might be the case for some keypoint matching methods used for registration.
- Some embodiments disclose a framework for model estimation for medical imaging. However, the disclosed embodiments are not limited thereto and can be used in other imaging applications.
- the RANSAC method can include the following actions performed iteratively (hypothesize-and-test framework).
- the model that gives the largest cardinality for the CS can be taken to be the solution.
- the model can be re-estimated using the points of the CS.
- the RANSAC method used can perform one or more of the following optimizations to help improve the accuracy of estimation, and efficiency of computation, in terms of number of the iterations.
- the augmented vector [x y 1] T can be derived by dividing the vector components of the homogeneous vector by the last element w. The registration models can be discussed using this coordinate notation, with [x y 1] T , the point in the original image, and [x′ y′ 1] T , the point in the “registered” image.
- the rotation-scaling-translation (RST) model can handle scaling by a factor s, rotation by an angle ⁇ , and translation by [t x t y ] T .
- the transformation process can be expressed as:
- T ⁇ This model, denoted by T ⁇ , can be referred to as a similarity transformation since it can preserve the shape or form of the object in the image.
- the parameter vector ⁇ [s cos ⁇ s sin ⁇ t x t y ] T can have 4 degrees of freedom: one for rotation, one for scaling, and two for translation.
- the parameters can be estimated in a least squares sense after reordering Equation 3 as:
- Each keypoint correspondence contributes two equations, and since total number of parameters is four, at least two such point correspondences can be used to estimate ⁇ .
- A being a matrix of size 4 ⁇ 4
- b being vector of size 4 ⁇ 1.
- the error between the ith pair of point correspondences x i and x′ i for the computed model T ⁇ can be defined as:
- the first term in the above equation can be called the reprojection error and e i as a whole can be referred to as the symmetric reprojection error (SRE).
- SRE symmetric reprojection error
- point correspondences whose SRE are below a certain threshold can be retained as inliers in the test operation of RANSAC.
- the average SRE over the points in the CS can be used as the residue to compare two CS of the same size.
- the affine model can handle shear and can be expressed as:
- [ x ′ y ′ 1 ] [ a 11 a 12 t x a 21 a 22 t y 0 0 1 ] ⁇ T ⁇ ⁇ [ x y 1 ] .
- ⁇ can then be estimated using least squares.
- the selection of points for MSS can be done to avoid the degenerate cases by checking for collinearity of points.
- the SRE can then be computed (with T being the affine model), and used to validate inliers for CS and compute the residue for comparison of two CS of the same size.
- the homography model can handle changes in view-point (perspective) in addition to rotation, scaling, translation, and shear and represented as:
- the homography matrix H is a 3 ⁇ 3 matrix, it has only 8 degrees of freedom due to the w′ scaling factor in the left-hand-side of the above equation.
- Estimation of this parameter vector can be performed with four point correspondences and done using the normalized direct linear transform (DLT) method/algorithm, which can produce numerically stable results.
- DLT normalized direct linear transform
- the quadratic model can be used to handle higher-order transformations such as x-dependent y-shear, and y-dependent x-shear. Since the retina is sometimes modeled as being almost spherical, a quadratic model is more suited for retinal image registration.
- the model can be represented as:
- [ x ′ y ′ ] [ ⁇ 1 ⁇ 2 ⁇ 3 ⁇ 4 ⁇ 5 ⁇ 6 ⁇ 7 ⁇ 8 ⁇ 9 ⁇ 10 ⁇ 11 ⁇ 12 ] ⁇ Q ⁇ ⁇ ⁇ ( [ x y ] ) , where ⁇ ([x y] T ) is [x 2 xy y 2 x y 1] T .
- the quadratic model may not be invertible.
- the transform may not be invertible
- the reprojection error that is, the first term on the right-hand-side of Equation 4, is computed and used to form and validate the CS.
- the models discussed above present a set of models that can be used in one or more embodiments of the image registration module. This does not preclude the use of other models or other parameter values in the same methods and systems disclosed herein.
- an initial estimate of homography is computed as described in the section above entitled “Model Estimation Using RANSAC”. Using the initial homography estimate, the keypoint locations in the source image, I source are transformed to the destination image, I dest coordinates.
- the keypoint matching operation can be repeated with an additional constraint that the Euclidean distance between the matched keypoints in the destination image coordinates be lesser than the maximum allowable registration error R e .
- R e can be fixed at 50 pixels. This process constrains the picked matches and results, and can improve registration between the source and destination images.
- various registration models can be fitted including Rotation-Scale-Translation (RST), Homography and Quadratic.
- RST Rotation-Scale-Translation
- Homography Homography
- Quadratic Quadratic.
- the minimum number of matches may be subtracted from the size of the obtained consensus set.
- the model with the maximum resulting quantity can be chosen as the best model. If two models end up with identical values, then the simpler model of the two can be chosen as the best model.
- An aspect of the image registration module may involve warping of the image to the coordinate system of the base image.
- FIG. 15 shows examples of source and destination images that are registered, warped, and overlaid on each other.
- the computed registration models can be used to transform the pixel locations from the original image to the registered image.
- the integer pixel locations in the input image can map to non-integer pixel locations in the registered image, resulting in “holes” in the registered image, for example, when the registered image dimensions are larger than that of the input image.
- the “holes” can be filled by interpolating the transformed pixels in the registered image.
- inverse transform can be used to map registered pixel locations to the input image. For pixels that land at integer locations after inverse mapping, the intensity values can be copied from the input image, while the intensity values at non-integer pixels in input image can be obtained by interpolation.
- a forward transform T ⁇ can be used to build a mapping of the integer pixel locations in the input image to the registered image.
- the forward mapping can be checked for any input location maps to the registered location under consideration. If such a mapping exists, the intensity value is copied. In the absence of such a value, the n-connected pixel locations in an m ⁇ m neighborhood around the registered pixel can be checked. In one embodiment, n is 8 and m is 3.
- the closest n pixels in the input image are found, and the pixel intensity at their centroid location is interpolated to obtain the intensity value at the required pixel location. This analysis may be helpful when pixels in a neighborhood in the input image stay in almost the same relative positions even in the registered image for retinal image registration.
- the estimated quadratic model can be used to compute the forward mapping, swapping the input and registered pixel locations, and estimating the inverse mapping ⁇ circumflex over (T) ⁇ ⁇ ⁇ 1 using least squares can be used to compute the forward mapping.
- a mapping can be applied to the integer locations in the registered image to generate the corresponding mapping from the input image.
- automated image assessment can be implemented using one or more features of the automated low-level image processing, and/or image registration techniques described above; however, using these techniques is not mandatory nor necessary in every embodiment of automated image assessment.
- an automated DR screening system automatically and reliably separates these lens shot images from the actual color fundus images.
- lens shot image classification is achieved by primarily using structural and color descriptors.
- a given image is resized to a predetermined size.
- the histogram of orientations (HoG) feature is computed on the green channel to capture the structure of the image.
- the vesselness maps for images are computed, using for example the processes disclosed in the section below entitled “Vessel Extraction”.
- the vesselness maps are hysteresis thresholded with the lower and higher thresholds set, for example, to 90 and 95 percentiles respectively to obtain a mask.
- the color histograms of the pixels within the mask are computed.
- the final descriptor is obtained by appending the color histogram descriptors to the HoG descriptors.
- the order in which the images were obtained is also sometimes an indicator of an image being a lens shot image. This was encoded as a binary vector indicating absolute value of the difference between the image index and half the number of images in an encounter.
- the system may include computer-aided assessment of the quality or gradability of an image.
- Assessment of image gradability or image quality can be important to an automated screening system.
- the factors that reduce quality of an image may include, for example, poor focus, blurred image due to eye or patient movement, large saturated and/or under-exposed regions, or high noise.
- the quality of image can be highly subjective.
- image characteristics that allow for effective screening of retinopathy by a human grader or software are preferred, whereas images with hazy media are flagged as being of insufficient quality for effective grading.
- Quality assessment can allow the clinician to determine whether he needs to immediately reimage the eye or refer the patient to a clinician depending on the screening setup employed.
- FIG. 17 shows a detailed view of one embodiment of scenarios in which image quality assessment can be applied.
- the patient 179000 is imaged by an operator 179016 using an image capture device 179002 .
- the image capture device is depicted as a retinal camera.
- the images captured are sent to a computer or computing device 179004 for image quality analysis.
- Good quality images 179010 are sent for further processing for example on the cloud 179014 , a computer or computing device 179004 , a mobile device 179008 , or the like.
- Poor quality images are rejected and the operator is asked to retake the image.
- a number is computed that reflects the quality of the image rather than simply classifying the image as of poor quality or not.
- all captured images are sent to the cloud 179014 , a computer or computing device 179004 , a mobile device 179008 , or the like, where the quality analysis takes place and the analysis results are sent back to the operator or the local computer or computing device 179004 .
- the computer itself could direct the image capture device to retake the image.
- the patient 179000 takes the image himself using an image capture device 179006 , which in this case is shown as a retinal camera attachment for a mobile device 179008 . Quality analysis is done on the mobile device. Poor quality images are discarded and the image capture device is asked to retake the image. Good quality images 179012 are sent for further processing.
- FIG. 18 gives an overview of one embodiment of a process for performing image quality computation.
- the illustrated blocks may be implemented on the cloud 179014 , a computer or computing device 179004 , a mobile device 179008 , or the like, as shown in FIG. 17 .
- the gradability interest region identification block 602 evaluates an indicator image that is true or false for each pixel in the original image and indicates or determines whether the pixel is interesting or represents an active region, so that it should be considered for further processing to estimate gradability of the image.
- Gradability descriptor set computation block 600 is configured to compute a single-dimensional or multi-dimensional float or integer valued vector that provides a description of an image region to be used to evaluate gradability of the image.
- the images are first processed using a Hessian based interest region and “vesselness” map detection technique as shown in FIG. 19 .
- the obtained image is then converted to a binary mask by employing hysteresis thresholding, followed by morphological dilation operation.
- the application of this binary mask to the original image greatly reduces the number of pixels to be processed by the subsequent blocks of the quality assessment pipeline, without sacrificing the accuracy of assessment.
- Table 1 is one embodiment of example descriptors that may be used for retinal image quality assessment.
- the green channel is preferred over red or blue channels for retinal analysis. This is because the red channel predominantly captures the vasculature in the choroidal regions, while the blue channel does not capture much information about any of the retinal layers.
- the green channel of the fundus image is used for processing. In other embodiments, all the 3 channels or a subset of them are used for processing.
- the system classifies images based on one or more of the descriptors discussed below:
- the sum-modified Laplacian is used for measuring the degree of focus or blur in the image. This has shown to be an extremely effective local measure of the quality of focus in natural images, as discussed in S. K. Nayar and Y. Nakagawa, “Shape from Focus,” IEEE Transactions on Pattern Analysis and Machine Intelligence 16, no. 8 (1994): 824-831.
- the sum-modified Laplacian I ML at a pixel location (x,y) can be computed as
- I ML ⁇ ( x , y ) ⁇ 2 ⁇ I ⁇ ( x , y ) - I ⁇ ( x - 1 , y ) - I ⁇ ( x + 1 , y ) ⁇ + ⁇ 2 ⁇ I ⁇ ( x , y ) - I ⁇ ( x , y - 1 ) - I ⁇ ( x , y + 1 ) ⁇ .
- a normalized histogram can be computed over the sum-modified Laplacian values in the image to be used as focus measure descriptor.
- I ML values that are too low, or too high may be unstable for reliably measuring focus in retinal images and can be discarded before the histogram computation.
- the low and high thresholds are set to 2.5 and 20.5 respectively, which was empirically found to give good results.
- the computed descriptor has a length of 20. In practice, computing the focus descriptors on the image obtained after enhancement and additional bilateral filtering provides better gradability assessment results.
- the local saturation measure captures the pixels that have been correctly exposed in a neighborhood, by ignoring pixels that have been under-exposed or over-exposed.
- the correctly exposed pixels are determined by generating a binary mask M using two empirically estimated thresholds, S lo for determining under-exposed pixels and S hi for determining over-exposed pixels.
- S lo for determining under-exposed pixels
- S hi for determining over-exposed pixels.
- the binary mask is determined as:
- M ⁇ ( x , y ) ⁇ 1 if ⁇ ⁇ S lo ⁇ I ⁇ ( x , y ) ⁇ S hi , 0 otherwise .
- the local saturation measure at location (x,y) is then determined as:
- contrast is the difference in luminance and/or color that makes an object (or its representation in an image) distinguishable.
- the contrast measure may include Michelson-contrast, also called visibility, as disclosed in Albert A. Michelson, Studies in Optics (Dover Publications. com, 1995).
- the local Michelson-contrast at a pixel location (x,y) is represented as:
- I MC ⁇ ( x , y ) I max - I min I max + I min , where I min and I max are the minimum and maximum pixel intensities in a neighborhood D.
- D is a circular patch of radius r pixels.
- a normalized histogram is then computed over I MC to obtain the contrast descriptors.
- the computed descriptor has a length of 20.
- normalized RGB color histograms are computed over the whole image and used as descriptors of color.
- the computed descriptor has a length of 20 for each of the R, G, and B channels.
- descriptors based on local entropy are incorporated to characterize the texture of the input image.
- B the normalized histogram p i at pixel location (x,y)
- D is a circular patch of radius r pixels.
- the local entropy is obtained as:
- a normalized histogram of the local entropy image I Ent is then used as a local image texture descriptor.
- the computed descriptor would have a length of 20.
- LBP local binary patterns
- the LBP can be computed locally for every pixel, and in one embodiment, the normalized histogram of the LBP image can be used as a descriptor of texture.
- the computed descriptor would still have a length of 20.
- a noise metric descriptor for retinal images is also incorporated using, for example, techniques disclosed in Noriaki Hashimoto et al., “Referenceless Image Quality Evaluation for Whole Slide Imaging,” Journal of Pathology Informatics 3 (2012): 9.
- an unsharp masking technique may be used.
- the Gaussian filtered (blurred) retinal image G is subtracted from the original retinal image, I, to produce a difference image D with large intensity values for edge or noise pixels.
- the center pixel in a 3 ⁇ 3 neighborhood B is replaced with the minimum difference between it and the 8 surrounding pixels as:
- D min ⁇ ( x , y ) min i , j ⁇ ⁇ B
- the resulting D min image has high intensity values for noise pixels.
- a 20-bin normalized histogram of this image can be used as a noise metric descriptor. The descriptor can be computed for the three channels of the input retinal image.
- the system includes a classification action for image quality assessment.
- regression analysis is conducted to obtain a number or value representing image quality.
- One or more quality descriptors discussed above are extracted and concatenated to get a single N-dimensional descriptor vector for the image. It is then subjected to dimensionality reduction, new dimension, M, using principal component analysis (PCA) to consolidate the redundancy among the feature vector components, thereby making quality assessment more robust.
- PCA principal component analysis
- the PCA may include techniques disclosed in Hervé Abdi and Lynne J. Williams, “Principal Component Analysis,” Wiley Interdisciplinary Reviews: Computational Statistics 2, no. 4 (2010): 433-459.
- the PCA-reduced descriptor then train a support vector regression (SVR) engine to generate a continuous score to be used for grading the images, for example, as being of poor, fair, or adequate quality.
- SVR support vector regression
- the SVR may include techniques disclosed in Harris Drucker et al., “Support Vector Regression Machines,” Advances in Neural Information Processing Systems (1997): 155-161.
- the parameters of the SVR were estimated using a 5-fold cross validation on a dataset of 125 images (73 adequate, 31 fair and 21 poor) labeled for retinopathy gradability by experts.
- FIG. 21 shows example images of varying quality that have been scored by the system.
- a support vector classifier is trained to classify poor quality images from fair or adequate quality images.
- the adequate and fair quality images were classified from the poor quality images with accuracy of 87.5%, with an area under receiver operating characteristics (AUROC) of 0.90.
- AUROC area under receiver operating characteristics
- Further improvements are expected with the incorporation of texture descriptors.
- the entire descriptor vector is used, without the PCA reduction, to train a support vector classifier to distinguish poor quality images from good quality ones. This setup obtained an average accuracy of 87.1%, with an average AUROC of 0.88, over 40 different test-train splits of a retinal dataset of 10,000 images.
- the system is configured to identify retinal vasculature, for example, the major arteries and veins in the retina, in retinal images by extracting locations of vasculature in images.
- Vasculature often remains fairly constant between patient visits and can therefore be used to identify reliable landmark points for image registration. Additionally, vessels in good focus are indicative of good quality images, and hence these extracted locations may be useful during image quality assessment.
- ⁇ refers to the standard deviation of the Gaussian used for smoothing.
- Gaussian smoothing 1102 convolves the image with a Gaussian filter of standard deviation ⁇ . This operation is repeated at different values of ⁇ .
- Hessian computation 1104 computes the Hessian matrix (for example, using Equation 2) at each pixel.
- Structureness block 1106 computes the Frobenius norm of the Hessian matrix at each pixel.
- Eigen values 1108 of the Hessian matrix are computed at each pixel.
- Vesselness in ⁇ 1 1110 (Equation 5) is computed at a given pixel after smoothing the image with Gaussian smoothing block 1102 of standard deviation ⁇ 1 .
- the maximum 1112 at each pixel over multiple values of vesselness is computed at different smoothing.
- Vesselness 1114 indicates the vesselness of the input image 100 .
- the vessels in the green channel of the color fundus image can be enhanced after pre-processing using a modified form of Frangi's vesselness using, for example, techniques disclosed in Alejandro F. Frangi et al., “Multiscale Vessel Enhancement Filtering,” in Medical Image Computing and Computer - Assisted Interventation—MICCAI' 98 (Springer, 1998), 130-137 (Frangi et al. (1988)).
- the input image is convolved with Gaussian kernels at a range of scales.
- Structureness S is evaluated as the Frobenius norm of the Hessian.
- the vesselness measure at a particular scale is computed for one embodiment as follows:
- V ⁇ 0 , if ⁇ ⁇ ⁇ 2 > 0 , e - R T 2 2 ⁇ ⁇ 2 ( 1 - e - S 2 2 ⁇ c 2 ) otherwise Equation ⁇ ⁇ 5
- ⁇ is fixed at 0.5 as per Frangi et al. (1998), and c is fixed as the 95 percentile of the structureness S.
- the vesselness measure across multiple scales is integrated by evaluating the maximum across all the scales. Vesselness over multiple standardized datasets were evaluated using, for example, DRIVE, as disclosed in Joes Staal et al., “Ridge-Based Vessel Segmentation in Color Images of the Retina,” IEEE Transactions on Medical Imaging 23, no. 4 (April 2004): 501-509, and STARE, as disclosed in A. Hoover, V. Kouznetsova, and M.
- the unsupervised, non-optimized implementation takes less than 10 s on a 605 ⁇ 700 pixel image.
- Some example vessel segmentations are shown in FIG. 19 .
- the receiver operating characteristics (ROC) curve of one embodiment on the STARE dataset is shown in FIG. 23 .
- Table 2 compares the AUROC and accuracy of one embodiment of the system on the DRIVE and STARE datasets with human segmentation. This embodiment has better accuracy with respect to gold standard when compared to secondary human segmentation.
- the vesselness map is then processed by a filterbank of oriented median filters.
- FIG. 24 shows an example vessel extraction using the custom morphological filterbank analysis on a poor quality image.
- level-set methods such as fast marching are employed for segmenting the vessels and for tracing them.
- fast marching can be used with techniques disclosed in James A. Sethian, “A Fast Marching Level Set Method for Monotonically Advancing Fronts,” Proceedings of the National Academy of Sciences 93, no. 4 (1996): 1591-1595.
- the vessel tracing block may focus on utilizing customized velocity functions, based on median filterbank analysis, for the level-sets framework. At each pixel location the velocity function is defined by the maximum median filter response.
- This embodiment leads to an efficient, mathematically sound vessel tracing approach.
- automatic initialization of start and end points for tracing the vessels in the image is performed using automated optic nerve head (ONH) identification within a framework that provides a lesion localization system.
- OGW automated optic nerve head
- the system is configured to localize lesions in retinal images.
- the lesions may represent abnormalities that are manifestations of diseases, including diabetic retinopathy, macular degeneration, hypertensive retinopathy, and so forth.
- FIG. 25 depicts one embodiment of a lesion localization process.
- the illustrated blocks may be implemented on the cloud 19014 , a computer or computing system 19004 , a mobile device 19008 , or the like, as shown in FIG. 1 .
- the image 100 refers in general to the retinal data, single or multidimensional, that has been captured using a retinal imaging device, such as cameras for color image capture, fluorescein angiography (FA), adaptive optics, optical coherence tomography (OCT), hyperspectral imaging, scanning laser ophthalmoscope (SLO), wide-field imaging or ultra-wide-field imaging.
- Fundus mask generation block 102 estimates the mask to extract relevant image sections for further analysis.
- Image gradability computation module 104 computes a score that automatically quantifies the gradability or quality of the image 100 in terms of analysis and interpretation by a human or a computer.
- Image enhancement module 106 enhances the image 100 to normalize the effects of lighting, different cameras, retinal pigmentation, or the like.
- Interest region identification block 108 generates an indicator image with a true or false value for each pixel in the original image, that indicates or determines whether the pixel is interesting or represents active regions that may be considered for further processing.
- Descriptor set computation block 110 computes a single- or multi-dimensional float or integer valued vector that provides a description of an image region. Examples include shape, texture, spectral, or other descriptors.
- Lesion classification block 200 classifies each pixel marked by interest region identification block 108 using descriptors computed using descriptor set computation block 110 into different lesions.
- Joint segment recognition block 202 analyzes the information and provides an indicator of any recognized lesions.
- interest region detection techniques described in the section above entitled “Interest Region Detection” can be used to locate lesions.
- a set of descriptors that provide complementary evidence about presence or absence of a lesion at a particular location can be used.
- Embodiments of the disclosed framework developed can effectively describe lesions whose sizes vary significantly (for example hemorrhages and exudates) due to local description of interest regions at multiple scales.
- Table 3 lists one embodiment of pixel level descriptors used for lesion localization and how the descriptors may contribute to lesion classification.
- Can also be adapted for vessels Path opening and closing 20 Effectively captures local structures, based morphological such as “curvy” vessels descriptors filterbank Filterbank of local binary 200 Captures local texture information, patterns descriptors can help achieve distinction between lesion and background or other anatomical structures
- descriptor sets are developed specifically for retinal images, with a focus on low-level image processing. Measures of local image properties alongside with some retinal fundus image specific measures at multiple scales can be used.
- Each of the descriptors listed below can be computed on scaled images I s 0 , I s 1 . . . I s n . In one embodiment, the ratio between different scales is set to 0.8 and 10 scales are used. Examples of multi-scale descriptors that can be used for lesion localization and/or screening at each interest pixel (x int , y int ) are listed above in Table 3. The following provides information about one or more descriptors that may be used.
- a morphological filter can be applied to the image with the morphological filter computed over circles, squares, or regular polygons or different sizes. For example, circles of different radii can be used.
- the median filtering is used as the said morphological filter.
- the median normalized RGB images A Norm,r j s k are computed (for example, using Equation 1) with medians computed within circles of different values of radius r j , such that r j >r j-1 .
- a diff,j-1 s k A Norm,r j s k ⁇ A Norm,r j-1 s k
- median filterbank descriptor is A diff,j-1 s k (x int ,y int ) for all values of j.
- the morphological filterbank descriptors are computed employing the following: generating a first morphological filtered image using the retinal image, with a the said morphological filter computed over a first geometric shape; generating a second morphological filtered image using the retinal image, with a morphological filter computed over a second geometric shape, the second geometric shape having one or more of a different shape or different size from the first geometric shape; generating a difference image by computing a difference between the first morphological filtered image and the second median filtered image; and assigning the difference image pixel values as a descriptor value each corresponding to given pixel location of the said retinal image.
- the morphological filter employed is a median filter.
- these descriptors are evaluated on a set of images obtained by progressively resizing the original image up and/or down by a set of scale-factors, so as to obtain a number or a vector of numbers for each scale (“multi-scale analysis”), which are then concatenated to make a composite vector of numbers (“multi-scale descriptors”).
- the oriented morphological filtered images are computed using structuring elements (geometric shapes) that resemble elongated structures, such as rectangles, ellipse, or the like. These filters are applied at different orientations representing angular steps of ⁇ .
- Two different parameters of the structuring element for example, length and width in case of a rectangular structuring element
- Taking the difference of these two images gives us the quantity of interest at each pixel, which then forms part of the said oriented morphological filterbank descriptors.
- median filters are used as the said morphological filter to obtain.
- I diff s k I Norm,R s k ⁇ I Norm,C s k
- Oriented median filterbank descriptor is I diff s k (x int ,y int ) at the different orientations. These descriptors can distinguish elongated structures from blob-like structures.
- the maximum or minimum value of the filterbank vector is identified and the vector elements are rearranged by shifting each element by P positions until the said maximum or minimum value is in the first position, while the elements going out of the vector boundary are pulled back into the first position sometimes referred to as circular shifting.
- the oriented morphological filterbank descriptors are computed employing the following:
- the maximum or minimum value of the oriented morphological filterbank descriptor vector is identified and the vector elements are rearranged by shifting each element by P positions until the said maximum or minimum value is in the first position, while the elements going out of the vector boundary are pulled back into the first position (“circular shifting”).
- these descriptors are evaluated on a set of images obtained by progressively resizing the original image up and/or down by a set of scale-factors, so as to obtain a number or a vector of numbers for each scale (“multi-scale analysis”), which are then concatenated to make a composite vector of numbers (“multi-scale descriptors”).
- Median normalized difference image is computed with radii r h and r l , such that r h >r l at each scale s k .
- I diff s k I Norm,r h s k ⁇ I Norm,r l s k
- This difference image I diff s k is then filtered using Gaussian filters G.
- F 0 I diff s k *G
- the image after filtering with second derivative of the Gaussian is also computed.
- F 2 F 0
- the Gaussian derivative descriptors are then F 0 (x int ,y int ) and F 2 (x int ,y int ). These descriptors are useful in capturing circular and ring shaped lesions (for example, microaneurysms).
- Median normalized difference image with bright vessels is computed with radii r h and r l , such that r h >r l at each scale s k .
- I diff s k I Norm,r l s k ⁇ I Norm,r h s k
- Hessian H is computed at each pixel of the difference image I diff s k .
- of the difference image I diff s k is the map of the determinant of Hessian H at each pixel.
- the sum modified Laplacian is computed to describe the local image focus. Vesselness and structureness may be computed, for example, as shown in FIG. 22 .
- the Eigen values ⁇ 1 and ⁇ 2 of H such that
- the Hessian based descriptor vector is collated from these values at the interest pixel locations (x int ,y int ). These describe local image characteristics of blobs and tubes, such as local sharpness.
- the region properties listed in are measured at each blob.
- the interest pixels within a particular blob region are assigned with the same blob statistics descriptor.
- Table 4 is one embodiment of blob properties used as descriptors.
- Average color is measured in a square block of length l centered at the pixel of interest.
- the color in RGB space is used as the color descriptor for the pixel.
- the natural logarithm of the Fourier transform magnitude and first derivative of Fourier transform phase of a patch of image B centered at the pixel of interest at various frequencies are computed. These descriptors are invariant to rotation and scaling and can survive print and scanning.
- the natural logarithm of Fourier transform magnitude of the image patch can be computed as follows:
- F 1 ⁇ ( ⁇ ) ln ⁇ ( ⁇ F ⁇ ⁇ ( B ) ⁇ )
- F 2 ⁇ ( ⁇ ) d ( ⁇ ⁇ ( F ⁇ ⁇ ( B ) ) ) d ⁇
- F 1 ( ⁇ ) and F 2 ( ⁇ ) are the fourier spectral descriptors
- F ⁇ is the fourier transform operation at frequency ⁇ and ⁇ denotes phase.
- Gabor jets are multi resolution Gabor features, constructed from responses of multiple Gabor filters at several frequencies and orientations. Gabor jet descriptors are computed as follows:
- x ′ x ⁇ ⁇ cos ⁇ ( ⁇ ) + y ⁇ ⁇ sin ⁇ ( ⁇ )
- y ′ - x ⁇ ⁇ sin ⁇ ( ⁇ ) + y ⁇ ⁇ cos ⁇ ( ⁇ )
- ⁇ is the wavelength of the sinusoidal factor
- ⁇ is the orientation of the normal to the striping of the Gabor function
- ⁇ is the phase offset
- ⁇ is the standard deviation of the Gaussian envelope
- ⁇ is the spatial aspect ratio.
- Gaussian filter is used as a kernel for multi-resolution match filtering.
- Gaussian filters of a range of sigmas are used as the filterbank as follows:
- Path opening and closing based morphological descriptors use flexible line segments as structuring elements during morphological operations. Since these structuring elements are adaptable to local image structures, these descriptors may be suitable to describe structures such as vessels.
- LBP Local binary patterns capture texture information in images.
- a histogram with 20 bins to describe the LBP images is used.
- a support vector machine is used for lesion classification.
- classifiers such as k-nearest neighbor, naive Bayes, Fisher linear discriminant, deep learning, or neural networks can be used.
- multiple classifiers can be used together to create an ensemble of classifiers.
- four classifiers one classifier for each of cottonwoolspots, exudates, hemorrhages, and microaneurysms—are trained and tested.
- ground truth data with lesion annotations on 100 images is used for all lesions, plus more than 200 images for microaneurysms.
- the annotated dataset is split in half into training and testing datasets, and interest region detector is applied on the training dataset images.
- the detected pixels are sampled such that the ratio of the number of pixels of a particular category of lesion in the training dataset to those labeled otherwise remains a constant referred to as the balance factor B.
- interest region detector is applied on the testing dataset images.
- the detected pixels are classified using the 4 different lesion classifiers noted above.
- Each pixel then has 4 decision statistics associated with it.
- a decision statistic for a particular pixel is generated by computing the distance of the given element from the given lesion classification hyper plane defined by the support vectors in the embodiment using SVM for lesion classification or in the embodiment using Fisher linear discriminant or the like.
- the class probability for lesion class and non-lesion class are computed and are used as the decision statistic.
- a biologically-inspired framework is employed for joint segmentation and recognition in order to localize lesions.
- Segmentation of interest region detector outputs the candidate lesion or non-lesion blobs.
- the decision statistic output from pixel-level classifiers can provide evidence to enable recognition of these lesions.
- These decision statistics from different pixels and different lesion types are pooled within each blob to arrive at a blob-level recognition.
- the pooling process may include computing the maximum, minimum or the average of decision statistics for a given lesion type for all the pixels in a given blob. This process can be repeated iteratively, although in some embodiments, a single iteration can be sufficient.
- FIG. 26A shows an example embodiment of microaneurysm localization.
- FIG. 26B shows an example embodiment of hemorrhages localization.
- FIG. 26C shows an example of exudates localization.
- FIG. 27 illustrates one embodiment of a graph that quantifies the performance of lesion detection.
- Secondary descriptors can be one or more of the following:
- These aggregated descriptors can then be used to train blob-level lesion classifiers and can be used to recognize and/or segment lesions. These descriptors can also be used for screening.
- Some embodiments pertain to computation of lesion dynamics, which quantifies changes in the lesions over time.
- FIG. 28 shows various embodiments of a lesion dynamics analysis system and process.
- the patient 289000 is imaged by an operator 289016 using an image capture device 289002 .
- the image capture device is depicted as a retinal camera.
- the current image captured 289010 is sent to the computer or computing device 289004 .
- Images from previous visits 289100 can be obtained from a datacenter 289104 .
- Lesion dynamics analysis 289110 is performed on the same computer or computing device 289004 , on the cloud 289014 , a different computer or computing device 289004 , a mobile device 289008 , or the like.
- the results are received by computer 289004 and then sent to a healthcare professional 289106 who can interpret the results and report the diagnosis to the patient.
- the patient 289000 can take the image 289012 himself using an image capture device 289006 , for example, a retinal camera attachment for a mobile device 289008 .
- the images from previous visits 289102 are downloaded to the mobile device from the datacenter 289104 .
- Lesion dynamics analysis is performed on the mobile device, on the cloud 289014 , or a computer or computing device 289004 , on a different mobile device, or the like.
- the results of the analysis are provided to the mobile device 289008 , which performs an initial interpretation of the results and presents a diagnosis report to the patient.
- the mobile device 289008 can also notify the health professional if the images contain any sign of disease or items of concern.
- FIG. 29A depicts an example of one embodiment of a user interface of the tool for lesion dynamics analysis depicting persistent, appeared, and disappeared lesions.
- the user can load the images from a database by inputting a patient identifier and range of dates for analysis.
- FIG. 29B when the user clicks on “View turnover,” the plots of lesion turnover for the chosen lesions are displayed.
- FIG. 29C when the toggle element to change from using the analysis to viewing the overlaid images is utilized, longitudinal images for the selected field between the selected two visits are shown. The user can change the transparency of each of the image using the vertical slider.
- longitudinal retinal fundus images are registered to the baseline image as described in the section above entitled “Image Registration”.
- lesions are localized as described in the section above entitled “Lesion Localization”.
- characterizing dynamics of lesions such as exudates (EX) and microaneurysms (MA) may be of interest.
- EX exudates
- MA microaneurysms
- the appearance and disappearance of MA also referred to as MA turnover is considered.
- the first image in the longitudinal series is referred to as the baseline image I b and any other registered longitudinal image is denoted as I l .
- FIG. 30 illustrates an embodiment used in evaluating lesion dynamics.
- the blocks shown here can be implemented on the cloud 289014 , a computer or computing device 289004 , a mobile device 289008 , or the like as, for example, shown in FIG. 28 .
- the input source image 308 and destination image 314 refer to a patient's retinal data, single or multidimensional, that has been captured at two different times using a retinal imaging device, such as cameras for color image capture, fluorescein angiography (FA), adaptive optics, optical coherence tomography (OCT), hyperspectral imaging, scanning laser ophthalmoscope (SLO), wide-field imaging or ultra-wide-field imaging.
- Image 100 is input into the lesion localization module 112 .
- FIG. 13A illustrates an embodiment of the image registration block 310 .
- Lesion dynamics module 500 computes changes in lesions across retinal images imaged at different times. Lesion changes can include appearance, disappearance, change in size, location, or the like.
- binary images B b and B l with lesions of interest marked out are created for the baseline and longitudinal images.
- Lesion locations are labeled in B b and compared to the corresponding regions in B l with a tolerance that can, for example, be specified by maximum pixel displacement due to registration errors.
- the labeled lesion is marked as persistent if the corresponding region contains a MA, else it is marked as a disappearing MA. Labeling individual lesions in B l and comparing them to corresponding regions in B b gives a list of newly appeared lesions.
- FIGS. 31A , 31 B, 31 C and 31 D depict embodiments and examples of longitudinal images for comparison to identify persistent, appeared and disappeared lesions. The images are zoomed to view the lesions.
- FIG. 31A shows the baseline image.
- FIG. 31B shows the registered longitudinal image.
- FIG. 31C shows labeled MAs in the baseline image with persistent MAs indicated by ellipses and non-persistent MAs by triangles.
- FIG. 31D shows labeled MAs in the longitudinal image with persistent MAs indicated by ellipses. Counting the newly appeared lesions and disappeared lesions over the period of time between the imaging sessions allows computation of lesion turnover rates, or MA turnover if the lesion under consideration is MA.
- the baseline image I b and registered longitudinal image I l are used rather than the registered binary lesion maps.
- Potential lesion locations are identified using the interest region detector as, for example, described in the section above entitled “Interest Point Detection”.
- these pixels are then classified using lesion classifier, for example, as described in the lesion localization section using, for example, descriptors listed in Table 3.
- the regions with high certainty of including lesions in I b as expressed by the decision statistics computed over the pixels, are labeled.
- these regions are then matched with corresponding regions in I l with a tolerance, for example, as specified by maximum pixel displacement which may be due to registration errors using decision statistics.
- regions with matches to the labeled lesions with high confidence are then considered to be persistent lesions, and labeled regions with no matches are considered to be disappeared lesions.
- Newly appearing lesions can be found by labeling image I l and comparing those regions to corresponding regions in I b to identify newly appearing lesions.
- a system that gracefully degrades when faced with the above confounding factors is desirable.
- the probability that a blob is classified as an MA or the probability that two blobs are marked as matched MAs and hence persistent is estimated.
- a blob includes a group of pixels with common local image properties and chosen by the interest region detector.
- FIG. 32A shows a patch of retina with microaneurysms.
- FIG. 32B shows the ground truth labelling for microaneurysms in the image patch shown in FIG. 32A .
- FIG. 32C shows the detected MAs marked by disks with the corresponding confidence levels indicated by the brightness of the disk.
- An estimated range for MA turnover is computed rather than a single number. A larger range may represent some uncertainty in the turnover computation, nevertheless it can provide the clinician with useful diagnostic information. In one embodiment, one or more of the following is performed when confounding factors are present.
- the range for turnover numbers is then assessed from the blob level probabilities and persistent MA pair probabilities using thresholds identified from the ground truth.
- Medical and retinal images captured during a given visit of a given patient are typically captured using the same imaging set-up.
- the set of these images is termed an encounter (of that patient on that date).
- the analysis of the images in a given encounter can be performed jointly using data from all the images. For example, the presence or absence of lesions in one eye of a given patient can be determined after examining all the images captured of that eye.
- a method for detection of regions with abnormality in medical (particularly retinal) images using one or at least two or more images obtained from the same patient in the same visit (“encounter”) can include one or more of the following:
- a vector of numbers (“primary descriptors”) at each of the pixels identified in (b) using one or at least two or more types from (i) median filterbank descriptors, (ii) oriented median filterbank descriptors, (iii) Hessian based descriptors, (iv) Gaussian derivatives descriptors, (vi) blob statistics descriptors, (vii) color descriptors, (viii) matched filter descriptors, (ix) path opening and closing based morphological descriptors, (x) local binary pattern descriptors, (xi) local shape descriptors, (xii) local texture descriptors, (xiii) local Fourier spectral descriptors, (xiv) localized Gabor jets descriptors, (xv) edge flow descriptors, (xvi) edge descriptors such as difference of Gaussians, (xvii) focus measure descriptors
- pixel-level classifier decision statistic (a number quantifying the distance from the classification boundary) using supervised learning utilizing the primary descriptors computed in (c) using one or more of (i) support vector machine, (ii) support vector regression, (iii) k-nearest neighbor, (iv) naive Bayes, (v) Fisher linear discriminant, (vi) neural network, (vii) deep learning, (viii) convolution networks, or (ix) an ensemble of one or more classifiers including from (i)-(viii), with or without bootstrap aggregation;
- image-level descriptors For each image identified in (a), computing a vector of numbers (“image-level descriptors”) by using one or least two or more types from:
- supervised learning techniques including but not limited to: (i) support vector machine, (ii) support vector regression, (iii) k-nearest neighbor, (iv) naive Bayes, (v) Fisher linear discriminant, (vi) neural network, (vii) deep learning, (viii) convolution networks, or (ix) an ensemble of one or more classifiers including from (i)-(vii
- the combining image-level descriptors into encounter-level descriptors for the images of the patient visit (encounter) identified in (a) is achieved using operations that include but are not limited to averaging, maximum, minimum or the like across each index of the descriptor vector, so that the said encounter-level descriptors are of the same length as the image-level descriptors.
- the combining image-level descriptors for the images of the patient visit (encounter) identified in (a) to obtain encounter-level descriptors is achieved using a method including: (i) combining image-level descriptors to form either the image field-of-view (identified from meta data or by using position of optic nerve head and macula)-specific or eye (identified from meta data or by using position of optic nerve head and macula)-specific descriptors, or (ii) concatenating the field-specific or eye-specific descriptors into the encounter level descriptors.
- Images in an encounter can be identified to be lens shot images, using, for example, the method described in the section above entitled “Lens Shot Image Classification.” These lens shot images can be ignored and excluded from further processing and analysis since they may not provide significant retinal information. The images that are not retinal fundus images are ignored in this part of the processing.
- Images in an encounter can be identified as having poor quality using, for example, the method described in the section above entitled “Image Quality Assessment.” These poor quality images can be excluded from further processing and analysis since the results obtained from such images with poor quality are not reliable. If a given encounter does not have the required number of adequate/good quality images then the patient is flagged to be re-imaged.
- Encounter-level descriptors can be obtained by combining image-level primary descriptors, many of which are described in the sections above entitled “Processing That Can Be Used To Locate The Lesions.” and “Features that can be used for this type of automatic detection”.
- the image level descriptors include one or more types from:
- the encounter-level descriptors can be evaluated as the maximum value across all the image level descriptors for the images that belong to an encounter or created by concatenating eye level descriptors.
- the computation of encounter-level descriptors for the images of the patient visit (encounter) is achieved using a method comprising (i) combining image-level descriptors to form either the image field-of-view, specific descriptors (identified from metadata or by using position of ONH as described in the section above entitled “Optic Nerve Head Detection” or by using the position of the ONH and macula) or eye-specific descriptors (identified from metadata or position of ONH and macula or the vector from the focus to the vertex of the parabola that approximates the major vascular arch) using operations such as maximum, average, minimum or the like, and (ii) concatenating the field-specific or eye-specific descriptors into the encounter level descriptors.
- encounter-level descriptors can then be classified, for example, using classifiers described in the section below entitled “Diabetic Retinopathy Screening” to obtain the encounter-level decisions. Combination of image level descriptors to form encounter level descriptors is discussed in further detail in section “Multi-Level Descriptors For Screening”.
- Encounter-level decisions can also be made by combining image-level decision statistics histograms using average, maximum, and minimum operations, or the like.
- Methods, systems and techniques described can also be used to automate screening for various medical conditions or diseases, which can help reduce the backlog of medical images that need to be screened.
- One or more of the techniques described earlier or in the following sections may be used to implement automated screening; however, using these techniques is not required by for every embodiment of automated screening.
- FIG. 35 shows one embodiment of scenarios in which disease screening can be applied.
- the patient 359000 is imaged by an operator 359016 using an image capture device 359002 .
- the image capture device is a retinal camera.
- the images captured are sent to a computer or computing device 359004 for further processing or transmission.
- all captured images 359010 from the computer or computing device are sent for screening analysis either on the cloud 359014 , on a computer or computing device 359004 , on a mobile device 359008 , or the like.
- only good quality images 359010 from the computer or computing device are sent for screening analysis either on the cloud 359014 , on the computer or computing device 359004 , on the mobile device 359008 , or the like.
- the screening results are sent to a healthcare professional 359106 who interprets the results and reports the diagnosis to the patient.
- the patient 359000 takes the image himself using an image capture device 359006 , which in this case is shown as a retinal camera attachment for a mobile device 359008 . All images or just good quality images 359012 from the mobile phone are sent for screening analysis.
- the results of the analysis are returned to the mobile device, which performs an initial interpretation of the results and presents a diagnosis report to the patient.
- the mobile device also notifies the health professional if the images contain any signs of disease or other items of concern.
- FIG. 36 depicts an example of embodiments of the user interface of the tool for screening.
- FIG. 36A and FIG. 36B describe the user interface for single encounter processing whereas FIG. 36C and FIG. 36D describe the user interface for batch processing of multiple encounters.
- FIG. 36A a single encounter is loaded for processing and when the user clicks on “Show Lesions,” the detected lesions are overlaid on the image, as shown in FIG. 36B .
- FIG. 36C An embodiment of a user interface of the tool for screening for multiple encounters is shown in FIG. 36C , and the detected lesions overlaid on the image are displayed when the user clicks on “View Details,” as shown in FIG. 36B .
- the embodiments described above are adaptable to different embodiments for screening of different retinal diseases. Additional embodiments are described in the sections below related to image screening for screening for diabetic retinopathy and image screening for screening for cytomegalovirus retinitis.
- FIG. 37 discloses one embodiment of an architecture for descriptor computation at various levels of abstraction.
- the illustrated blocks may be implemented on the cloud 19014 , a computer or computing device 19004 , or a mobile device 19008 , or the like, as shown in FIG. 1 .
- Pixel level descriptors 3400 are computed, using for example the process described in the section above entitled “Lesion Classification”. Lesion classifiers for microaneurysms, hemorrhages, exudates, or cottonwoolspots are used to compute a decision statistic for each of these lesions using the pixel level descriptors.
- Pixels are grouped into blobs based on local image properties, and the lesion decision statistics for a particular lesion category of all the pixels in a group are averaged to obtain blob-level decision statistic 3402 .
- Histograms of pixel-level and blob averaged decision statistics for microaneurysms, hemorrhages, exudates, or cottonwoolspots are concatenated to build image level descriptors 3404 .
- image level descriptors also include bag of words (BOW) descriptors, using for example the process described in the section above entitled “Description With Dictionary of Primary Descriptors”.
- Eye-level descriptors 3406 are evaluated as the maximum value across all the image level descriptors for the images that belong to an eye. Images that belong to a particular eye can be either identified based on metadata, inferred from file position in an encounter or deduced from the image based on relative positions of ONH and macula. Encounter-level descriptors 3408 are evaluated as the maximum value across all the image level descriptors for the images that belong to an encounter. Alternatively, encounter-level descriptors can be obtained by concatenating eye-level descriptors. Lesion dynamics computed for a particular patient from multiple encounters can be used to evaluate patient level descriptors 3410 .
- Ground truth labels for retinopathy and maculopathy can indicate various levels of severity, for example R0, R1, M0 and so on. This information can be used to build different classifiers for separating the various DR levels.
- improved performance can be obtained for classification of R0M0 (no retinopathy, no maculopathy) cases from other disease cases on Messidor dataset by simply averaging the decision statistics of the no-retinopathy-and-no-maculopathy (“R0M0”) versus the rest classifier, and no-or-mild-retinopathy-and-no-maculopathy (“R0R1M0”) versus the rest classifier.
- One or more of the following operations may be applied with the weights w t on each training element initialized to the same value on each of the classifier h t obtained. In some embodiments, the operations are performed sequentially.
- w t+1 ( i ) w t ( i )exp ⁇ t (2( y i ⁇ h t ( x i )) ⁇ 1) where, x i ,y i are the classifier inputs and the corresponding labels.
- the output weights ⁇ t are used to weight the output of each of the classifiers to obtain a final classification decision statistic.
- ensemble classifiers are employed, which are a set of classifiers whose individual predictions are combined in a way that provides more accurate classification than the individual classifiers that make them up.
- a technique called stacking is used, where an ensemble of classifiers, at base level, are generated by applying different learning algorithms to a single dataset, and then stacked by learning a combining method. Their good performance is proved by the two top performers at the Netflix competition using, for example, techniques disclosed in Joseph Sill et al., Feature-Weighted Linear Stacking, arXiv e-print, Nov. 3, 2009.
- the individual weak classifiers at the base level, may be learned by using algorithms such as decision tree learning, na ⁇ ve Bayes, SVM, or multi response linear regression. Then, at the meta level, effective multiple-response model trees are used for stacking these classifier responses.
- the system employs biologically plausible, deep artificial neural network architectures, which have matched human performance on challenging problems such as recognition of handwritten digits, including, for example, techniques disclosed in Dan Cire an, Ueli Meier, and Juergen Schmidhuber, Multi - Column Deep Neural Networks for Image Classification , arXiv e-print, Feb. 13, 2012.
- traffic signs, or speech recognition are employed, using, for example, techniques disclosed in M. D. Zeiler et al., “On Rectified Linear Units for Speech Processing,” 2013.
- shallow architectures for example, SVM, deep learning is not affected by the curse of dimensionality and can effectively handle large descriptors.
- the system uses convolution networks, sometimes referred to as cony-nets, based classifiers, which are deep architectures that have been shown to generalize well for visual inputs.
- the system allows screening of patients to identify signs of diabetic retinopathy (DR).
- DR diabetic retinopathy
- a similar system can be applied for screening of other retinal diseases such as macular degeneration, hypertensive retinopathy, retinopathy or prematurity, glaucoma, as well as many others.
- two DR detection scenarios are often of interest: (i) detecting any signs of DR, even for example a single microaneurysm (MA) since the lesions are often the first signs of retinopathy or (ii) detecting DR onset as defined by the Diabetes Control and Complications Trial Control and Group, that is, the presence of at least three MAs or the presence of any other DR lesions.
- MA microaneurysm
- CSME clinically significant macular edema
- the screening system when testing for this Messidor dataset, uses >5 MAs or >0 Hemorrhages (HMs) as criteria for detecting DR onset.
- HMs Hemorrhages
- the goal is to quantify working on cross-dataset testing, training on a completely different data, or on a 50-50 test-train split of the dataset.
- FIG. 38 depicts one embodiment of a pipeline used for DR screening.
- the illustrated blocks may be implemented either on the cloud 19014 , a computer or computing device 19004 , a mobile device 19008 , or the like, as shown in FIG. 1 .
- the image 100 refers in general to the retinal data, single or multidimensional, that has been captured using a retinal imaging device, such as cameras for color image capture, fluorescein angiography (FA), adaptive optics, optical coherence tomography (OCT), hyperspectral imaging, scanning laser ophthalmoscope (SLO), wide-field imaging or ultra-wide-field imaging.
- Image 100 is input to fundus mask generation block 102 and image gradability computation block 104 and image enhancement module 106 if the image is of sufficient quality.
- Interest region identification block 108 and descriptor set computation block 110 feed into lesion localization block 112 which determines the most likely label and/or class of the lesion and extent of the lesion. This output can be used for multiple purposes such as abnormality screening, diagnosis, or the like.
- DR screening block 114 determines whether a particular fundus image includes abnormalities indicative of diabetic retinopathy such that the patient should be referred to an expert.
- two approaches can be used in the system: one for the 50-50 train/test split and the other for the cross-dataset testing with training on one dataset and testing on another.
- One embodiment uses the Messidor dataset and the DEI dataset (kindly provided by Doheny Eye Institute) which comprises 100 field 2 images with four lesions diligently annotated pixel-wise (MA, HM, EX and CW), and 125 field 2 images with MAs marked.
- MA, HM, EX and CW annotated pixel-wise
- 125 field 2 images with MAs marked.
- the annotations performed precisely, often verifying the annotations using the corresponding fluorescein angiography (FA) images. This precise annotation sets high standards for the automated lesion localization algorithms, especially at lesion-level.
- a dictionary of low-level features is computed by unsupervised learning of interesting datasets, referred to as codewords.
- the dictionary may be computed by technology disclosed in J. Sivic and A. Zisserman, “Video Google: A Text Retrieval Approach to Object Matching in Videos,” in 9 th IEEE International Conference on Computer Vision, 2003, 1470-1477. Then an image is represented using a bag of words description, for example a histogram of codewords found in the image. This may be performed by finding the codeword that is closest to the descriptor under consideration. The descriptors for an image are processed in this manner and contribute to the histogram.
- a 50-50 split implies that training is done with half the dataset and testing is done on the other half.
- the computation of the dictionary can be an offline process that happens once before the system or method is deployed.
- the unsupervised learning dataset is augmented with descriptors from lesions.
- the descriptors from lesions locations annotated on the DEI dataset are used.
- the total number of descriptors computed is N DEI and N Mess , for DEI and Messidor datasets, respectively.
- N Mess ⁇ mN DEI where m ⁇ 1.0 can be any real number, with each Messidor training image contributing equally to the N Mess descriptor count.
- m is set to 1 and in another embodiment it is set to 5.
- the random sampling of interesting locations allows signatures from non-lesion areas to be captured.
- the computed N Mess +N DEI descriptors are pooled together and clustered into K partitions using K-means clustering, the centroids of which give K-codewords representing the dictionary.
- K-means clustering may be performed using techniques disclosed in James MacQueen, “Some Methods for Classification and Analysis of Multivariate Observations,” in Proceedings of the Fifth Berkeley Symposium on Mathematical Statistics and Probability , vol. 1, 1967, 14.
- the bag of words based (BOW) secondary descriptors are computed.
- the lesion descriptors 110 are computed.
- each descriptor is assigned a corresponding codeword from the previously computed dictionary.
- the vector quantization may be performed using techniques disclosed in Allen Gersho and Robert M. Gray, Vector Quantization and Signal Compression (Kluwer Academic Publishers, 1992). This assignment can be based on which centroid or codeword is closest in terms of Euclidean distance to the descriptor.
- a normalized K-bin histogram is then computed representing the frequency of codeword occurrences in the image. The histogram computation does not need to retain any information regarding the location of the original descriptor and therefore the process is referred to as “bagging” of codewords.
- These descriptors are referred to as bag of words (BOW) descriptors.
- Table 5 is comparison of embodiments of the screening methods.
- the results for one embodiment is provided for reference alone, noting that the other results are not cross dataset.
- “NA” in the table indicates the non-availability of data.
- the column labelled “Quellec” provides results when applying the method described in Gwénodia Joc et al., “A Multiple-Instance Learning Framework for Diabetic Retinopathy Screening,” Medical Image Analysis 16, no. 6 (March 2012): 1228-1240, the column labelled “Sanchez” shows results when applying the method described in C. I. Sanchez et al., “Evaluation of a Computer-Aided Diagnosis System for Diabetic Retinopathy Screening on Public Data,” Investigative Ophthalmology & Visual Science 52, no.
- the BOW descriptors after the BOW descriptors have been computed for the images, they are subjected to term frequency—inverse document frequency (tf-idf) weighting, using, for example, techniques disclosed in Christopher D. Manning, Prabhakar Raghavan, and Hinrich Schiitze, Introduction to Information Retrieval , vol. 1 (Cambridge University Press Cambridge, 2008). This is done to scale down the impact of codewords that occur very frequently in a given dataset and that are empirically less informative than codewords that occur in a small fraction of the training dataset, which might be the case with “lesion” codewords.
- the inverse document frequency (idf) computation is done using the BOW descriptors of the training dataset images.
- a document may be considered if the raw codeword frequency in it is above a certain threshold T df .
- T df a certain threshold
- the tf-idf weighting factors computed on training dataset are stored and reused on the BOW descriptors computed on the images in the test split of Messidor dataset during testing.
- the system adds a histogram of the decision statistics (for example, the distance from classifier boundaries) for pixel level MA and HM classifiers.
- This combined representation may be used to train a support vector machine (SVM) classifier using the 50-50 test/train split.
- SVM support vector machine
- a histogram of blob-level decision statistics that is computed using one or more of the following operations is added: (i) computation of the blobs in the image at various scales using the detected pixels, (ii) computation of the average of the decision statistics to obtain one number per blob, (iii) training of one or more another classifiers for lesions using the blob-level decision statistics as the feature vector and use the new decision statistic, or (iv) computation of one or more histograms of these decision statistics to form a blob-level histogram(s) descriptor.
- these histogram descriptors are normalized to sum to 1 so as to mathematically look like a probability distribution.
- descriptor types may be combined in various embodiments, this does not preclude the use of any individual descriptor type, or an arbitrary combination of a subset of descriptor types.
- the method or system could be applied to a cross-dataset scenario.
- cross-dataset testing is applied on all 1200 Messidor images without any training on this dataset.
- the system uses the decision statistics computed for the various lesions. These statistics are the distances from classifier boundaries, with the classifier being trained on the expert-annotated images.
- 225 images from the DEI dataset are employed.
- the ROC curves for this example implementation, shown in FIG. 40 demonstrate an impressive cross-dataset testing performance, especially for detecting DR onset (AUROC of 0.91).
- Table 5 presents a comparison of screening performance of some embodiments with various competing approaches on the Messidor dataset, clearly showing superior diagnostic efficacy of the disclosed embodiments.
- Table 6 compares the results from the two approaches. Table 6 provides screening results (AUROC) for the two embodiments of screening system on Messidor dataset.
- Cytomegalovirus retinitis is a treatable infection of the retina affecting HIV and AIDS patients, and is a leading cause of blindness in many developing countries.
- methods and systems for screening of Cytomegalovirus retinitis using retinal fundus photographs is described.
- Visual inspection of the images from CMVR patients reveals that, images with CMVR typically have large sub-foveal irregular patches of retinal necrosis appearing as a white, fluffy lesion with overlying retinal hemorrhages as seen in FIGS. 41C and 41D . These lesions have severely degraded image quality, for example, focus, contrast, normal color, when compared with images of normal retina, as shown in FIGS. 41A and 41B .
- the image quality descriptors are adapted to the problem of CMVR screening, providing a new use of the image quality descriptors described herein.
- the image analysis engine automatically processes the images and extracts novel quality descriptors, using, for example, the process described in the section above entitled “Lens Shot Image Classification”. These descriptors are then subjected to principal component analysis (PCA) for dimensionality reduction. They can then be used to train a support vector machine (SVM) classifier in a 5-fold cross-validation framework, using images that have been pre-graded for Cytomegalovirus retinitis by experts, for example, into two categories: normal retina, and retina with CMVR. In one embodiment, images graded by experts at UCSF and Chiang Mai University Medical Centre, Thailand are employed. The system produces a result of refer for a patient image from category retina with CMVR, and no refer for a patient image from category normal retina.
- PCA principal component analysis
- SVM support vector machine
- FIG. 42 depicts a process for one embodiment of CMVR screening.
- the illustrated blocks may be implemented either on the cloud 19014 , or a computer or computing device 19004 , a mobile device 19008 or the like, as shown in FIG. 1 .
- the image 100 refers in general to the retinal data, single or multidimensional, that has been captured using a retinal imaging device, such as cameras for color image capture, fluorescein angiography (FA), adaptive optics, optical coherence tomography (OCT), hyperspectral imaging, scanning laser ophthalmoscope (SLO), wide-field imaging or ultra-wide-field imaging.
- Image 100 is input to the image enhancement module 106 and then input to interest region identification block 108 and descriptor set computation block 110 .
- the descriptors are input to CMVR screening block 900 to determine whether a particular fundus image includes abnormalities indicative of Cytomegalovirus infection and that the patient needs to be referred to an expert.
- One embodiment was tested using 211 images graded for CMVR, by randomly splitting them into 40 different training-testing datasets. In each split, 75% of the images were used for training and the other 25% were reserved for testing. As expected, the lesion degraded, poor quality images were flagged to be positive for CMVR by the system with an average accuracy of 85%, where average area under ROC curve (AUROC) was 0.93.
- AUROC average area under ROC curve
- the quality of the image is first analyzed using a “gradability assessment” module.
- This module will flag blurry, saturated or under exposed images to be of poor quality and unsuitable for reliable screening.
- the actual CMVR screening would then be performed on images that have passed this quality module.
- Both system could use the same descriptors, but one can use a support vector regressor engine trained to assess quality, and the other a support vector classifier trained to screen for CMVR.
- additional descriptors are included, such as texture, color layout, and/or other descriptors to the CMVR screening setup to help distinguish the lesions better.
- AD Alzheimer's disease
- the retinal arterioles may narrow as a result of chronic hypertension and this may predict stroke and other cardiovascular diseases independent of blood pressure level as discussed in Tien Yin Wong, Ronald Klein, A. Richey Sharrett, David J. Couper, Barbara E. K. Klein, Duan-Ping Liao, Larry D. Hubbard, Thomas H. Mosley, “Cerebral white matter lesion, retinopathy and risk of clinical stroke: The Atherosclerosis Risk in the Communities Study”. JAMA 2002; 288:67-74.
- the system may also be used to screen for strokes.
- the retinal arterioles may narrow as a result of chronic hypertension and this may predict stroke and other cardiovascular diseases independent of blood pressure level, as discussed in Tien Y. Wong, Wayne Rosamond, Patricia P. Chang, David J. Couper, A. Richey Sharrett, Larry D. Hubbard, Aaron R. Folsom, Ronald Klein, “Retinopathy and risk of congestive heart failure”. JAMA 2005; 293:63-69.
- the system may be used to screen for cardiovascular diseases.
- retinopathy of prematurity can be analyzed by automated retinal image analysis tools for screening.
- Lesions may also indicate macular degeneration as discussed in A. C. Bird et al., “An International Classification and Grading System for Age-Related Maculopathy and Age-Related Macular Degeneration,” Survey of Ophthalmology 39, no. 5 (March 1995): 367-374.
- lesions such as drusen bodies can be detected and localized using the lesion localization system described in the section above entitled “Lesion Localization” and this disease can be screened for using a similar setup as described in the section “Diabetic retinopathy screening”.
- systems and methods may be implemented in a variety of architectures including telemedicine screening, cloud processing, or using other modalities.
- the system includes a flexible application programming interface (API) for integration with existing or new telemedicine, systems, programs, or software.
- the Picture Archival and Communication System (PACS) is used as an example telemedicine service to enable such an integration.
- Block diagram of one embodiment of such a system is shown in FIGS. 43A and 43B .
- the system includes an API allowing coding of one or more of patients' metadata 1306 , de-identifying images 1307 to anonymize patients for analysis and protect privacy, analyzing image quality 1312 , initiating reimaging as needed 1316 , updating patient metadata, storing images and analysis results in database 1314 , inputting 1310 , and/or outputting 1308 transmission interfaces.
- the Image Analysis System comprises one or more of the following: input 1318 and output 1328 transmission interfaces for communication with the PACS system, a database updater 1320 , a quality assessment block 1322 to assess image gradability 1324 , an analysis engine 1326 that can include a combination of one or more of the following tools: disease screening, lesion dynamics analysis, or vessel dynamics analysis.
- the PACS and/or the IAS system could be hosted on remote or local server or other computing system, and in another embodiment, they could be hosted or cloud infrastructure.
- the API is designed to enable seamless inter-operation of the IAS with a telemedicine service, such as PACS, though any telemedicine system, software, program, or service could be used.
- a telemedicine service such as PACS
- An interface for one embodiment is presented in FIG. 43A .
- the API includes one or more of the following features:
- IAS initiates the transfer of results to PACS.
- PACS would not have a control over when it would receive the results.
- the transfer may include one or more of the following:
- PACS initiates the transfer of results to its system.
- PACS can choose when to retrieve the analysis results from IAS server. This circumvents the possibility of data leaks, since the screening results are sent from IAS upon request.
- the transfer may include one or more of the following:
- Table 7 presents one embodiment of technical details of an interface with telemedicine and error codes for a Telemedicine API.
- the design includes considerations directed to security, privacy, data handling, error conditions, and/or independent server operation.
- the PACS API key to obtain “write” permission to IAS server would be decided during initial integration, along with the IAS API key to obtain “write” permission to PACS.
- the API URL such as https://upload.eyepacs.com/eyeart_analysis/upload, for IAS to transfer results to PACS could either be set during initial registration or communicated each time during the POST request to https://api.eyenuk.com/eyeart/upload.
- Table 8 shows one embodiment of details of an IAS and PACS API. One embodiment of error codes are described in Table 7. The URLs uses in the table are for illustrative purposes only.
- URL 1 https://api.eyenuk.com/eyeart/upload API key, multi-part/form content type with HTTP 200 1, 3, 4, User ID images, unique id for identifying 6, 7 images of a particular patient, dictionary containing the retinal image fields for each image.
- URL 2 https://upload.eyepacs.com/eyeart_analysis/upload API Key JSON object with unique id, HTTP 200 2, 3, 4, Structure with DR screening 6, 7 analysis details, Structure with quality analysis details.
- URL 3 https://api.eyenuk.com/eyeart/status API key, multi-part/form content type with HTTP 200 3, 4, 6, 7 User ID unique ids for images.
- URL 4 https://api.eyenuk.com/eyeart/result API key, AJAX request (possibly jQuery HTTP 200 3, 4, 6, 7 User ID $.get) with callbacks for success and failure.
- Image processing and analysis can be performed on the cloud, including by using systems or computing devices in the cloud. Large-scale retinal image processing and analysis may not be feasible on normal desktop computers or mobile devices. Producing results in near constant time irrespective of the size of the input dataset is possible if the retinal image analysis solutions are to be scaled.
- This section describes the retinal image acquisition and analysis systems and methods according to some embodiments, as well as the cloud infrastructure used to implement those systems and methods.
- FIG. 44 shows an embodiment of a retinal image acquisition and analysis system.
- Diabetic retinopathy patients, and patients with other vision disorders visit diagnostic clinics for imaging of their retina.
- multiple images of the fundus are collected from various fields and from both the eyes for each patient.
- photographs of the lens are also added to the patient encounter images. These images are acquired by clinical technicians or trained operators, for example, on color fundus cameras or portable cellphone based cameras.
- the patient 449000 image refers to the retinal data, single or multidimensional, captured from the patient using a retinal imaging device, such as cameras for color image capture, fluorescein angiography (FA), adaptive optics, optical coherence tomography (OCT), hyperspectral imaging, scanning laser ophthalmoscope (SLO), wide-field imaging or ultra-wide-field imaging.
- a retinal imaging device such as cameras for color image capture, fluorescein angiography (FA), adaptive optics, optical coherence tomography (OCT), hyperspectral imaging, scanning laser ophthalmoscope (SLO), wide-field imaging or ultra-wide-field imaging.
- the acquired images are stored on the local computer or computing device 449004 , or mobile device 449008 and then transmitted to a central data center 449104 .
- Operators at the data center can then use traditional server-based or computing device-based 449500 , desktop-based 449004 , or mobile-based 449008 clients to push these images to the cloud 449014 for further analysis and processing.
- the cloud infrastructure generates patient-level diagnostic reports which can trickle back to the patients, for example, through the same pipeline, in reverse.
- the imaging setup can communicate with the cloud, as indicated by dotted lines in FIG. 44 .
- the images can be pushed to the cloud following acquisition.
- the diagnostic results are then obtained from the cloud, typically within minutes, enabling the clinicians or ophthalmologists to discuss the results with the patients during their imaging visit. It also enables seamless re-imaging in cases where conclusive results could not be obtained using the initial images.
- data centers store images from thousands of patients 449500 .
- the data may have been collected as part of a clinical study for either disease research or discovery of drugs or treatments.
- the patient images may have been acquired, in preparation for the study, and then pushed to the cloud for batch-processing.
- the images could also be part of routine clinical workflow where the analysis is carried out in batch mode for several patients.
- the cloud infrastructure can be scaled to accommodate the large number of patient encounters and perform retinal analysis on the encounters. The results can be presented to the researchers in a collated fashion enabling effective statistical analysis for the study.
- FIG. 45 shows one embodiment of the cloud infrastructure 19014 used for retinal image processing and analysis.
- the client can be server-based or computing device-based 459500 , desktop-based 459004 , or mobile-based 459008 .
- the client may be operated by a human operator 459016 .
- the workflow can include one or more of the following:
- the cloud operation described above has been implemented using Amazon Web ServicesTM infrastructure, and the cloud storage is implemented using Simple Storage Service (S3).
- the input and output message queues may be implemented with Simple Queue Service (SQS).
- the web-server is hosted on a t1-micro Elastic Cloud Compute (EC2) instance.
- the database is implemented with the Relational Database Service (RDS) running a MySQL database instance.
- Each worker machine is a c3.8xlarge EC2 instance with 32-processors and 60 GB of RAM.
- the cloud metrics are obtained using Cloud Watch.
- the scaling of EC2 capacity (automatic creation and termination of worker machines) is done using Amazon Auto Scaling.
- the software that runs on each of the worker machines is stored as an Amazon Machine Image (AMI).
- AMI Amazon Machine Image
- Widefield and ultra-widefield retinal images capture fields of view of the retina in a single image that are larger than 45-50 degrees typically captured in retinal fundus images. These images are obtained either by using special camera hardware or by creating a montage using retinal images of different fields.
- the systems and methods described herein can apply to widefield and ultra-widefield images.
- Fluorescein angiography involves injection of a fluorescent tracer dye followed by an angiogram that measures the fluorescence emitted by illuminating the retina with light of wavelength 490 nanometers. Since the dye is present in the blood, fluorescein angiography images highlight the vascular structures and lesions in the retina. The systems and methods described herein can apply to fluorescein angiography images.
- Scanning laser retinal imaging uses horizontal and vertical mirrors to scan a region of the retina that is illuminated by laser while adaptive optics scanning laser imaging uses adaptive optics to mitigate optical aberrations in scanning laser images.
- the systems and methods described herein can apply to scanning laser and adaptive optics images.
- the process of imaging is performed by a computing system 8000 such as that disclosed in FIG. 46 .
- the computing system 5000 includes one or more computing devices, for example, a personal computer that is IBM, Macintosh, Microsoft Windows or Linux/Unix compatible or a server or workstation.
- the computing device comprises a server, a laptop computer, a smart phone, a personal digital assistant, a kiosk, or a media player, for example.
- the computing device includes one or more CPUS 5005 , which may each include a conventional or proprietary microprocessor.
- the computing device further includes one or more memory 5030 , such as random access memory (“RAM”) for temporary storage of information, one or more read only memory (“ROM”) for permanent storage of information, and one or more mass storage device 5020 , such as a hard drive, diskette, solid state drive, or optical media storage device.
- RAM random access memory
- ROM read only memory
- mass storage device 5020 such as a hard drive, diskette, solid state drive, or optical media storage device.
- the modules of the computing device are connected to the computer using a standard based bus system.
- the standard based bus system could be implemented in Peripheral Component Interconnect (PCI), Microchannel, Small Computer System Interface (SCSI), Industrial Standard Architecture (ISA) and Extended ISA (EISA) architectures, for example.
- PCI Peripheral Component Interconnect
- SCSI Small Computer System Interface
- ISA Industrial Standard Architecture
- EISA Extended ISA
- the functionality provided for in the components and modules of computing device may be combined into fewer components and modules or further separated into additional components and
- the computing device is generally controlled and coordinated by operating system software, such as Windows XP, Windows Vista, Windows 7, Windows 8, Windows Server, Embedded Windows, Unix, Linux, Ubuntu Linux, SunOS, Solaris, iOS, Blackberry OS, Android, or other compatible operating systems.
- operating system software such as Windows XP, Windows Vista, Windows 7, Windows 8, Windows Server, Embedded Windows, Unix, Linux, Ubuntu Linux, SunOS, Solaris, iOS, Blackberry OS, Android, or other compatible operating systems.
- the operating system may be any available operating system, such as MAC OS X.
- the computing device may be controlled by a proprietary operating system.
- Conventional operating systems control and schedule computer processes for execution, perform memory management, provide file system, networking, I/O services, and provide a user interface, such as a graphical user interface (GUI), among other things.
- GUI graphical user interface
- the exemplary computing device may include one or more commonly available I/O interfaces and devices 5010 , such as a keyboard, mouse, touchpad, touchscreen, and printer.
- the I/O interfaces and devices 5010 include one or more display devices, such as a monitor or a touchscreen monitor, that allows the visual presentation of data to a user. More particularly, a display device provides for the presentation of GUIs, application software data, and multimedia presentations, for example.
- the computing device may also include one or more multimedia devices 5040 , such as cameras, speakers, video cards, graphics accelerators, and microphones, for example.
- the I/O interfaces and devices 5010 provide a communication interface to various external devices.
- the computing device is electronically coupled to a network 5060 , which comprises one or more of a LAN, WAN, and/or the Internet, for example, via a wired, wireless, or combination of wired and wireless, communication link 5015 .
- the network 5060 communicates with various computing devices and/or other electronic devices via wired or wireless communication links.
- images to be processed according to methods and systems described herein may be provided to the computing system 5000 over the network 5060 from one or more data sources 5076 .
- the data sources 5076 may include one or more internal and/or external databases, data sources, and physical data stores.
- the data sources 5076 may include databases storing data to be processed with the imaging system 5050 according to the systems and methods described above, or the data sources 5076 may include databases for storing data that has been processed with the imaging system 5050 according to the systems and methods described above.
- one or more of the databases or data sources may be implemented using a relational database, such as Sybase, Oracle, CodeBase, MySQL, SQLite, and Microsoft® SQL Server, as well as other types of databases such as, for example, a flat file database, an entity-relationship database, and object-oriented database, NoSQL database, and/or a record-based database.
- a relational database such as Sybase, Oracle, CodeBase, MySQL, SQLite, and Microsoft® SQL Server
- other types of databases such as, for example, a flat file database, an entity-relationship database, and object-oriented database, NoSQL database, and/or a record-based database.
- the computing system 5000 includes an imaging system module 5050 that may be stored in the mass storage device 5020 as executable software codes that are executed by the CPU 5005 .
- These modules may include, by way of example, components, such as software components, object-oriented software components, class components and task components, processes, functions, attributes, procedures, subroutines, segments of program code, drivers, firmware, microcode, circuitry, data, databases, data structures, tables, arrays, and variables.
- the computing system 5000 is configured to execute the imaging system module 5050 in order to perform, for example, automated low-level image processing, automated image registration, automated image assessment, automated screening, and/or to implement new architectures described above.
- module refers to logic embodied in hardware or firmware, or to a collection of software instructions, possibly having entry and exit points, written in a programming language, such as, for example, Python, Java, Lua, C and/or C++.
- a software module may be compiled and linked into an executable program, installed in a dynamic link library, or may be written in an interpreted programming language such as, for example, BASIC, Perl, or Python. It will be appreciated that software modules may be callable from other modules or from themselves, and/or may be invoked in response to detected events or interrupts.
- Software modules configured for execution on computing devices may be provided on a computer readable medium, such as a compact disc, digital video disc, flash drive, or any other tangible medium.
- Such software code may be stored, partially or fully, on a memory device of the executing computing device, such as the computing system 5000 , for execution by the computing device.
- Software instructions may be embedded in firmware, such as an EPROM.
- hardware modules may be comprised of connected logic units, such as gates and flip-flops, and/or may be comprised of programmable units, such as programmable gate arrays or processors.
- the block diagrams disclosed herein may be implemented as modules.
- the modules described herein are preferably implemented as software modules, but may be represented in hardware or firmware. Generally, the modules described herein refer to logical modules that may be combined with other modules or divided into sub-modules despite their physical organization or storage.
- Each of the processes, methods, and algorithms described in the preceding sections may be embodied in, and fully or partially automated by, code modules executed by one or more computer systems or computer processors comprising computer hardware.
- the code modules may be stored on any type of non-transitory computer-readable medium or computer storage device, such as hard drives, solid state memory, optical disc, and/or the like.
- the systems and modules may also be transmitted as generated data signals (for example, as part of a carrier wave or other analog or digital propagated signal) on a variety of computer-readable transmission mediums, including wireless-based and wired/cable-based mediums, and may take a variety of forms (for example, as part of a single or multiplexed analog signal, or as multiple discrete digital packets or frames).
- the processes and algorithms may be implemented partially or wholly in application-specific circuitry.
- the results of the disclosed processes and process steps may be stored, persistently or otherwise, in any type of non-transitory computer storage such as, for example, volatile or non-volatile storage
- a tangible computer readable medium is a data storage device that can store data that is readable by a computer system. Examples of computer readable mediums include read-only memory, random-access memory, other volatile or non-volatile memory devices, CD-ROMs, magnetic tape, flash drives, and optical data storage devices.
Abstract
Description
and if the intensity at the first pixel location is not lower, then set a value at the first pixel location in the enhanced image to a sum of around the middle of the minimum and the maximum intensity value for the medical retinal image, Cmid, and (Cmid−1) scaled by a ratio of a difference of intensity of the median filtered image from intensity of the medical retinal original image to a difference of intensity of the median filtered image from a maximum possible intensity value Cmax, expressed as
wherein the enhanced image is used to infer or further analyze, a medical condition of the subject.
-
- In an additional embodiment, a computer-implemented method for enhancing a retinal image is disclosed. The method may include, as implemented by one or more computing devices configured with specific executable instructions, accessing a medical retinal image for enhancement, the medical retinal image related to a subject; computing a median filtered image IBack,S with a median computed over a geometric shape, at single or multiple scales; determining whether intensity at a first pixel location in the medical retinal image I(x,y) is lower than intensity at a same position in the median filtered image IBack,S(x,y) for generating an enhanced image; if the intensity at the first pixel location is lower, then setting a value at the first pixel location in the enhanced image to a value around a middle of a minimum and a maximum intensity value for the medical retinal image Cmid scaled by a ratio of intensity at medical retinal image to intensity in the median filtered image as expressed by
and if the intensity at the first pixel location is not lower, then setting a value at the first pixel location in the enhanced image to a sum of around the middle of the minimum and the maximum intensity value for the medical retinal image, Cmid, and (Cmid−1) scaled by a ratio of a difference of intensity of the median filtered image from intensity of the medical retinal original image to a difference of intensity of the median filtered image from a maximum possible intensity value Cmax, expressed as
using the enhanced image to infer or further analyze, a medical condition of the subject.
-
- In a further embodiment, non-transitory computer storage that stores executable program instructions is disclosed. The non-transitory computer storage may include instructions that, when executed by one or more computing devices, configure the one or more computing devices to perform operations including: accessing a medical retinal image for enhancement, the medical retinal image related to a subject; computing a median filtered image IBack,S with a median computed over a geometric shape, at single or multiple scales; determining whether intensity at a first pixel location in the medical retinal image I(x,y) is lower than intensity at a same position in the median filtered image IBack,S(x,y) for generating an enhanced image; if the intensity at the first pixel location is lower, then setting a value at the first pixel location in the enhanced image to a value around a middle of a minimum and a maximum intensity value for the medical retinal image Cmid scaled by a ratio of intensity at medical retinal image to intensity in the median filtered image as expressed by
and if the intensity at the first pixel location is not lower, then setting a value at the first pixel location in the enhanced image to a sum of around the middle of the minimum and the maximum intensity value for the medical retinal image, Cmid, and (Cmid−1) scaled by a ratio of a difference of intensity of the median filtered image from intensity of the medical retinal original image to a difference of intensity of the median filtered image from a maximum possible intensity value Cmax, expressed as
using the enhanced image to infer or further analyze, a medical condition of the subject.
-
- Seamlessly connecting primary care facilities with image reading centers, so that an expert is not needed at the point of care;
- Re-prioritizing expert appointments, so patients at greater risk can be seen immediately by ophthalmologists;
- Allowing primary care physicians and optometrists to use the tools to make informed decisions regarding disease care; or
- Improving patient awareness through visualization tools based on lesion detection and localization.
where f and g are the spatial and intensity weighting functions respectively, which are typically Gaussian. In one embodiment, the parameters of the bilateral filter have been chosen to induce the smoothing effect so as not to miss small lesions such as microaneurysms.
C. Encounter-Level Processing
where Laa(x, y) is second partial derivative in the a direction and Lab(x, y) is the mixed partial second derivative in the a and b directions. Determinant of Hessian map L|H| of the difference image Idiff s
- 1. Mask M that marks red pixels in the scaled image Is
k is generated as follows.
- 2. Image with just red (or bright) pixels Icol s
k is generated by using mask M.
I col sk (x,y)=I diff sk (x,y)M(x,v) - 3. Mask Pdoh containing the local peaks in determinant of Hessian L|H| is generated.
- 4. The maximum value imax sin Icol s
k is found, and the pixels marked by mask Pdoh are set to imax sx +1.
- 5. The resultant image Icol s
k is hysteresis thresholded with the high threshold thi and low threshold tlo to obtain mask Gcol sk . In one embodiment, thi is set to the larger of 97 percentile of Icol sk or 3, and tlo is set to the larger of 92 percentile of Icol sk or 2. - 6. The resulting mask Gcol s
k is applied on determinant of Hessian map L|H| to obtain L|H|,col.
L |H|,col(x,y)=L |H|(x,y)G col sk (x,y) - 7. Mask Pdoh,col containing the local peaks in determinant of Hessian L|H|,col is generated.
- 8. Pixels in Icol s
k marked by mask Pdoh,col are set to imax sk +1.
I col sk (x,y|P doh,col(x,y)=1)=i max sk +1 - 9. Icol s
k then masked with Gcol sk .
I col,masked sk (x,y)=I col sk (x,y)G col sk x,y) - 10. The resultant image Icol,masked s
k is hysteresis thresholded with the high threshold thi and low threshold tlo to obtain mask Fcol sk . In one embodiment, thi is set to the larger of imax sk or 3, and tlo is set to the larger of 92 percentile of Icol sk or 2. - 11. Locations with area larger than maxs
k are removed from this mask Fcol sk . Similarly locations with area smaller than minsk are also removed. The locations indicated by the resulting pruned mask Zcol sk are interesting regions scaled by sk.
-
- i. describing landmark points for automated image registration (as described in the section below entitled “Detection And Description Of Landmark Points”),
- ii. evaluating the quality of images (as described in the section below entitled “Descriptors That Can Be Used For Quality Assessment”),
- iii. lesion localization (as described in the section below entitled “Processing That Can Be Used To Locate The Lesions”).
-
- Vector of normalized intensity values (from the green channel);
- Vector of normalized vesselness values;
- Histogram of vessel radius values from the defined patch at locations with high vesselness, for example, greater than 90 percentile vesselness over the image. (Using locations with high vesselness can ensure that locations with erroneous radius estimates are not used.)
- Oriented median descriptors (OMD): Vector of difference in responses between an oriented median filter and median filtered image
These descriptors can provide reliable matches across longitudinal images with varying average intensities.
- 1. Hypothesize: Randomly select minimal sample sets (MSS) from the input dataset (the size of the MSS, k, can be the smallest number of data points sufficient to estimate the model). Compute the model parameters using the MSS.
- 2. Test: For the computed model, classify the other data points (outside the MSS) into inliers and outliers. Inliers can be data points within a distance threshold t of the model. The set of inliers constitutes the consensus set (CS).
-
- Instead of using a fixed threshold for the probability of finding a better CS, the threshold is updated after each iteration of the algorithm.
- For two iterations producing CS of the same size, the CS with lower residue or estimation error (as defined by the algorithm used for model estimation), is retained.
-
- Checking for collinearity of three or more points by computing the area of the triangle formed by the three points and checking if it is less than a predefined threshold, for example, 2 pixel-squared;
- Choosing distances between the chosen points greater than a threshold, for example, 32 pixels; or
- Preserving the order of points after transformation, for example, using techniques discussed in Pablo Marquez-Neila et al., “Speeding-up Homography Estimation in Mobile Devices,” Journal of Real-Time Image Processing (Jan. 9, 2013).
The SRE can be used to form and validate the CS.
where Ψ([x y]T) is [x2 xy y2 x y 1]T. Unlike RST, affine, or homography models, the quadratic model may not be invertible. In one embodiment, the model can have 12 parameters and 6 keypoint correspondences for estimation, that is, the size of MSS is k=6. The above equation can be rewritten in the standard least squares form Aθ=b, where the parameter vector θ=[θ1, θ2, . . . , θ12]T, A is a matrix of size 12×12, and b is a vector of size 12×1 for the six point correspondences. θ can be estimated using least squares.
| TABLE 1 | ||
| Descriptor Name | Length | How it contributes |
| Local sum-modified |
20 | Captures the degree of local |
| focus/blur in an image | ||
| Local saturation descriptor | 20 × 2 | Captures the # pixels with |
| “right” exposure | ||
| |
20 | Captures the local contrast |
| in an image | ||
| R, G, |
20 × 3 | Captures the degree of local |
| focus/blur in an image | ||
| |
20 | Captures the local texture |
| Local |
20 | Captures the local texture |
| Local noise |
20 × 3 | Captures the local noise |
The local saturation measure at location (x,y) is then determined as:
where D is a neighborhood of pixels about the location (x,y). In one embodiment, D is a circular patch of radius r pixels. In one embodiment, the following values can be used for an 8-bit image: Slo=40, Shi=240, r=16. A normalized histogram is then computed over ISat to generate the saturation measure descriptors. In one embodiment, the computed descriptor has a length of 20 for each channel. In addition to the saturation measure for the green channel, the inclusion of saturation measure for the blue channel was empirically found to improve the quality assessment.
where Imin and Imax are the minimum and maximum pixel intensities in a neighborhood D. In one embodiment, D is a circular patch of radius r pixels. A normalized histogram is then computed over IMC to obtain the contrast descriptors. In one embodiment, the computed descriptor has a length of 20.
where (x,y) is the pixel location in the image. The resulting Dmin image has high intensity values for noise pixels. In one embodiment, a 20-bin normalized histogram of this image can be used as a noise metric descriptor. The descriptor can be computed for the three channels of the input retinal image.
| TABLE 2 | ||||
| Accuracy (%) | ||||
| EyeTrace | Human | AUROC | |||
| DRIVE | 95.3% | 94.7% | 0.932 | ||
| STARE | 95.6% | 93.5% | 0.914 | ||
| TABLE 3 | ||
| Descriptor Name | Length | How it contributes |
| Median filterbank | 90 | Bandpass median filter responses at |
| multiple scales. | ||
| Robustly characterizes interesting | ||
| pixels | ||
| Oriented median | 120 | Robustly distinguish elongated |
| filterbank | structures from blob-like structures | |
| Hessian based descriptors | 70 | Describes local image characteristics |
| of blobs and tubes, such as local | ||
| sharpness | ||
| Blob statistics descriptors | 80 | Detects blob like structures with |
| statistics on blob shape, | ||
| size, and color | ||
| Gaussian derivative | 20 | Useful in extracting structures such as |
| | ||
| Color descriptor | ||
| 30 | Average color in RGB space in a local | |
| neighborhood | ||
| Filterbank of |
20 | Extracts edge layout and local |
| spectral descriptors | textures, independent of | |
| local intensity | ||
| Localized |
400 | Extracts local spectral information |
| descriptors | concerning form and texture | |
| without sacrificing information about | ||
| global spatial relationships | ||
| Filterbank of matched | 80 | Allows localization of small lesions |
| filters | such as microaneurysms. Can also | |
| be adapted for vessels | ||
| Path opening and closing | 20 | Effectively captures local structures, |
| based morphological | such as “curvy” vessels | |
| descriptors filterbank | ||
| Filterbank of local binary | 200 | Captures local texture information, |
| patterns descriptors | can help achieve distinction between | |
| lesion and background or other | ||
| anatomical structures | ||
A diff,j-1 s
In one embodiment, median filterbank descriptor is Adiff,j-1 s
I diff s
I diff s
This difference image Idiff s
F 0 =I diff s
The image after filtering with second derivative of the Gaussian is also computed.
F 2 =F 0
The Gaussian derivative descriptors are then F0(xint,yint) and F2(xint,yint). These descriptors are useful in capturing circular and ring shaped lesions (for example, microaneurysms).
I diff s
Then, Hessian H is computed at each pixel of the difference image Idiff s
| TABLE 4 | |
| Blob property | Description |
| Area | Number of pixels in the blob region |
| Filled Area | Number of pixels in the filled region |
| Perimeter | Perimeter of the blob which approximates the |
| contour as a line through the centers of border | |
| pixels using a 4-connectivity | |
| Extent | Ratio of pixels in the blob region to pixels in the |
| total bounding box for the blob | |
| Eccentricity | Eccentricity of the ellipse that has the same |
| second-moments as the region. | |
| Maximum intensity | Value of greatest intensity in the blob region |
| Minimum intensity | Value of lowest intensity in the blob region |
| Average intensity | Value of mean intensity in the blob region |
where F1(ω) and F2(ω) are the fourier spectral descriptors, Fω is the fourier transform operation at frequency ω and φ denotes phase.
where,
λ is the wavelength of the sinusoidal factor, θ is the orientation of the normal to the striping of the Gabor function, ψ is the phase offset, σ is the standard deviation of the Gaussian envelope and γ is the spatial aspect ratio.
-
- i. Handling quality variations in input image: The quality of the input images can vary as they are images at different time, possibly using different imaging systems and by different operators. The quality of the image can be inferred locally. The quality of the sections of the image can be used as a weight to infer confidence in MA detection along with the classifier decision statistic.
- ii. Local registration refinement for global image alignment error correction: Registration errors can occur due to lack of matching keypoints between images. Local refinement of registration using a small image patch centered on the putative microaneurysm can be used to correct these errors.
FIG. 33A shows baseline andMonth 6 images registered and overlaid. Misalignment causes persistent MA to be wrongly identified as disappeared and appeared.FIG. 33B shows the baseline image, as grayscale image of the enhanced green channel only. The dotted box shows region centered around the detected MA, with inset showing zoomed version.FIG. 33C showsMonth 6 image, as grayscale image of the enhanced green channel only. The dotted region around MA inFIG. 33B is correlated with the image shown inFIG. 33C to refine the registration. The dotted box inFIG. 33C corresponds with the box inFIG. 33B , and the solid box inFIG. 33C indicates the new location after refinement. MA is now correctly identified as persistent. When the local patches are aligned, the putative microaneurysms are then matched to evaluate persistent MAs. - iii. Robust persistent microaneurysm classification: Probabilities can be used to represent the classification of a given blob into microaneurysm or otherwise. Persistent MAs are marked in the ground truth representation and will describe pairs of blobs with the histogram decision statistics of the pixels in the blobs along with similarity of the blobs. The labeled persistent MAs can be used to train a SVM classifier. Given a pair of putative blobs in the neighborhood after local registration refinement, the probability that these blobs are a persistent MA pair is computed.
-
- i. histogram of pixel-level classifier decision statistics computed in (d);
- ii. descriptors based on dictionary of codewords of pixel-level descriptors (primary descriptors) computed in (c) aggregated at image level; or
- iii. histogram of blob-level decision statistic numbers (one number per blob) computed as mean, median, maximum, or minimum of pixel-level classifier decision statistics computed in (d) for all pixels belonging to the blob;
-
- i. histogram of pixel-level classifier decision statistics computed;
- ii. descriptors based on dictionary of codewords of pixel-level descriptors (primary descriptors) aggregated at image level; or
- iii. histogram of blob-level decision statistic numbers (one number per blob) computed as mean, median, maximum, or minimum of pixel-level classifier decision statistics computed for pixels belonging to the blob.
2. The weight distribution wt+1 on the input training set for the next classifier is computed as below:
w t+1(i)=w t(i)expαt(2(y i ≠h t(x i))−1)
where, xi,yi are the classifier inputs and the corresponding labels.
| TABLE 5 | |||||
| System | System | ||||
| embodiment | Embodiment | ||||
| one | two | Quellec. . . | Sanchez. . . | Barriga. . . | ||
| AUROC | 0.915 | 0.857 | 0.881 | 0.876 | 0.860 |
| sensitivity | specificity | 95% | 88% | 92% | 92 | NA | |
| 50% | |||||||
| 75% | 88% | 82% | 86% | 83% | NA | ||
| specificity | sensitivity | 70% | 39% | 66% | 55% | NA | |
| 90% | |||||||
| 85% | 82% | 62% | 75% | 65% | NA | ||
| TABLE 6 | ||
| Method | Refer any retinopathy | Refer > 5 MAs |
| System embodiment one | 0.915 | 0.943 |
| System embodiment two | 0.857 | 0.910 |
-
- Image data sent to IAS server: Once a patient is imaged, relevant metadata, like retinal image field, is added, a unique control number or identifier (id) is generated for the case, and the patient image is de-identified by PACS. The id along with the de-identified images and metadata is then sent to IAS, for
example block 1300 and URL 1 (https://api.eyenuk.com/eyeart/upload), using a secure protocol such as the secure hypertext transfer protocol (HTTPS) POST request with multi-part/form content type, which also includes authentication from PACS and/or the user. - Ack sent back to PACS: Once the POST request is received by the IAS server, the input data is validated, and the application and user sending the data are authenticated. After authenticating the request, an acknowledgment is sent back.
- Image Analysis on IAS Analysis Engine: IAS image analysis engine, for
example block 1302, updates the database with the patient images, associated data and unique id, and proceeds to analyze the images. The images are assessed for their gradability in multiple threads. If the images are of gradable quality, the screening results are estimated.
- Image data sent to IAS server: Once a patient is imaged, relevant metadata, like retinal image field, is added, a unique control number or identifier (id) is generated for the case, and the patient image is de-identified by PACS. The id along with the de-identified images and metadata is then sent to IAS, for
-
- Image analysis results sent to PACS: For images of gradable quality, the corresponding screening results are embedded as JSON (JavaScript Object Notation) data and sent in a new HTTPS POST request to the PACS server using protocols discussed in https://upload.eyepacs.com/eyeart_analysis/upload. Ungradable images are indicated as such.
- Ack sent back to IAS server: After receiving the results, PACS server validates the received data and sends an acknowledgment back,
block 1304.
-
- PACS queries for result status: Similar to the initial POST request, the PACS server uses HTTPS POST request with multi-part/form content type, to transmit the image ids for which it wants to know the status of image analysis using, for example, protocols disclosed in https://api.eyenuk.com/eyeart/status.
- Ack sent back to PACS: Once the POST request is received by the IAS server, the input id is validated, and the application and user sending the data are authenticated. An acknowledgment is then sent back along with the status of the result, (for example, “In Queue” or “Processing” or “Done”) for the requested id or ids.
- PACS queries for results: The PACS server sends an AJAX request (for example, jQuery $.get) to asynchronously, in the background, retrieve the results from the IAS server using, for example, protocols disclosed in https://api.eyenuk.com/eyeart/result. The appropriate AJAX callbacks are set for handling events such as processing of results once it is received, handling failure of the request, or the like.
- Posting results to PACS: Once the processing is done, for images of gradable quality, the corresponding screening results are embedded as JSON data and sent as a response to the authenticated PACS server AJAX request. If images are ungradable they are indicated as such in the response. This response, triggers the corresponding callback (set during the request) at the PACS server, which could process the results and add them to the patient database, for
example block 1304.
| TABLE 7 | ||
| | Description | |
| 1 | No images specified |
| 2 | No quality structure specified |
| 3 | General upload |
| 4 | Unique ID not specified |
| 5 | |
| 6 | Invalid API key |
| 7 | Insufficient permissions |
| TABLE 8 | |||
| Success | Error | ||
| Authentication | Arguments | response | Codes |
| URL 1: https://api.eyenuk.com/eyeart/upload |
| API key, | multi-part/form content type with | | 1, 3, 4, |
| User ID | images, unique id for identifying | 6, 7 | |
| images of a particular patient, | |||
| dictionary containing the retinal | |||
| image fields for each image. |
| URL 2: https://upload.eyepacs.com/eyeart_analysis/upload |
| API Key | JSON object with unique id, | | 2, 3, 4, |
| Structure with | 6, 7 | ||
| analysis details, Structure with | |||
| quality analysis details. |
| URL 3: https://api.eyenuk.com/eyeart/status |
| API key, | multi-part/form content type with | | 3, 4, 6, 7 |
| User ID | unique ids for images. |
| URL 4: https://api.eyenuk.com/eyeart/result |
| API key, | AJAX request (possibly | HTTP | 200 | 3, 4, 6, 7 |
| User ID | $.get) with callbacks for success and | |||
| failure. | ||||
B. Processing on the Cloud
-
- First, the client logs-in to the web-
server 459400 and requests credentials for using the cloud infrastructure. Following this authorization action, the client can access the various components of the cloud infrastructure. - During authorization, the client can send the number of encounters or images it plans to process in a run. Based on this number, the web-server initializes the components of the cloud, for example,
-
Input 459404 andoutput 459408 message queues: These queues are fast, reliable and scalable message queuing services which act as an interface between client and the cloud. Messages in input queue indicate which encounters are ready for analysis, while those in output queue indicate which encounters have been analyzed on the cloud. - Cloud storage 459406: Can comprise a distributed network of hard disks (magnetic or solid-state), concurrently accessible via high-bandwidth connections to the worker machines. They can provide high security features, such as data encryption and firewalls, to guard against unauthorized access. They can also provide reliability, by, for example, redundant data storage across the network, against hardware and data failures allowing for disaster recovery.
- Auto scaling group 459412: Can comprise of a group of worker machines or computing devices which can process the images in an encounter. For example, each
worker machine 459414 can comprise of 32 or more, multi-core, 64-bit processors with high computing power and access to high-speed random access memory (RAM). The number of worker machines in the group is automatically scaled, that is, new machines are created or old ones terminated, depending on the cloud metrics. - Worker machine image 459416: Software that powers each worker machine. New machines created 459418 can be loaded with a machine image to transform them into
worker machines 459414 - Cloud metrics 459410: Component that monitors the number of encounters being processed by the existing machines, the number of encounters waiting to be processed in the input queue, and the current load on the worker machines. Auto scaling group uses this information to scale the number of worker machines.
-
- After authorization, the client can perform some preliminary processing of the retinal images, which may include resizing or image enhancement.
- The pre-processed images from an encounter are then uploaded to cloud storage, a corresponding encounter entry, which may contain image metadata, is made in the
database 459402, and a message object is pushed to the input message queue to let the worker machines know that the encounter is ready for processing. In batch-processing mode, the images are pushed to the cloud in multiple software threads for faster uploads. After pushing the messages to the input queue, the client polls the output message queue for encounters that have been processed. - Once started, the worker machines poll the input message queue in anticipation of encounters to process. Once a message appears in the queue, they delete the message, access the database entry corresponding to that encounter, and download the images for that encounter to local memory. They then start processing and analyzing the images for retinal diseases. Each worker machine, can process multiple images or encounters simultaneously depending on the number of processor cores it has. During processing, the worker machines can save intermediate data to the cloud storage. Depending on the load each machine is handling and the number of messages, or encounters, waiting to be processed in the input message queue, the
auto scaling component 459412 can automatically start new worker machines, load the required machine image, and initialize them to start pulling messages from the input queue and to start processing the encounters. The auto scaling component can also terminate machines if it thinks that computing power is left idle, in view of the volume of the new messages in the input queue. - After processing the images from an encounter, the worker process writes necessary data or images back to cloud storage, updates the corresponding encounter entry in the database with diagnostic results, and pushes a message to the output queue to let the client know that an encounter has been processed. If an error occurs during processing of an encounter, the encounter updates the database encounter entry indicating the error, and re-pushes the message back to the input queue, for another worker process to process the encounter. However, if the message has been re-pushed more than a couple of times, indicating that the encounter data itself has some problem, the worker process can delete the message from the input queue and push it to the output queue after updating the corresponding database entry.
- Once a message appears in the output queue, the client deletes it from the queue and accesses the corresponding entry in the database to know the analysis results, or errors, if any, for an encounter. The results are then formatted and presented to the client. In batch-processing mode, the results for the encounters in the run can be collated into a spreadsheet for subsequent analysis by the client.
- First, the client logs-in to the web-
Claims (24)
Priority Applications (7)
| Application Number | Priority Date | Filing Date | Title |
|---|---|---|---|
| US14/266,688 US8885901B1 (en) | 2013-10-22 | 2014-04-30 | Systems and methods for automated enhancement of retinal images |
| US14/507,777 US20150110370A1 (en) | 2013-10-22 | 2014-10-06 | Systems and methods for enhancement of retinal images |
| US15/242,303 US20170039689A1 (en) | 2013-10-22 | 2016-08-19 | Systems and methods for enhancement of retinal images |
| US16/039,268 US20190042828A1 (en) | 2013-10-22 | 2018-07-18 | Systems and methods for enhancement of retinal images |
| US16/731,837 US20200257879A1 (en) | 2013-10-22 | 2019-12-31 | Systems and methods for enhancement of retinal images |
| US17/121,739 US20210350110A1 (en) | 2013-10-22 | 2020-12-14 | Systems and methods for enhancement of retinal images |
| US17/838,103 US20230036134A1 (en) | 2013-10-22 | 2022-06-10 | Systems and methods for automated processing of retinal images |
Applications Claiming Priority (2)
| Application Number | Priority Date | Filing Date | Title |
|---|---|---|---|
| US201361893885P | 2013-10-22 | 2013-10-22 | |
| US14/266,688 US8885901B1 (en) | 2013-10-22 | 2014-04-30 | Systems and methods for automated enhancement of retinal images |
Related Child Applications (1)
| Application Number | Title | Priority Date | Filing Date |
|---|---|---|---|
| US14/507,777 Continuation US20150110370A1 (en) | 2013-10-22 | 2014-10-06 | Systems and methods for enhancement of retinal images |
Publications (1)
| Publication Number | Publication Date |
|---|---|
| US8885901B1 true US8885901B1 (en) | 2014-11-11 |
Family
ID=51798266
Family Applications (12)
| Application Number | Title | Priority Date | Filing Date |
|---|---|---|---|
| US14/266,688 Active US8885901B1 (en) | 2013-10-22 | 2014-04-30 | Systems and methods for automated enhancement of retinal images |
| US14/266,746 Active US9002085B1 (en) | 2013-10-22 | 2014-04-30 | Systems and methods for automatically generating descriptions of retinal images |
| US14/266,749 Active US8879813B1 (en) | 2013-10-22 | 2014-04-30 | Systems and methods for automated interest region detection in retinal images |
| US14/266,753 Active US9008391B1 (en) | 2013-10-22 | 2014-04-30 | Systems and methods for processing retinal images for screening of diseases or abnormalities |
| US14/500,929 Abandoned US20150110348A1 (en) | 2013-10-22 | 2014-09-29 | Systems and methods for automated detection of regions of interest in retinal images |
| US14/507,777 Abandoned US20150110370A1 (en) | 2013-10-22 | 2014-10-06 | Systems and methods for enhancement of retinal images |
| US15/238,674 Abandoned US20170039412A1 (en) | 2013-10-22 | 2016-08-16 | Systems and methods for automated detection of regions of interest in retinal images |
| US15/242,303 Abandoned US20170039689A1 (en) | 2013-10-22 | 2016-08-19 | Systems and methods for enhancement of retinal images |
| US16/039,268 Abandoned US20190042828A1 (en) | 2013-10-22 | 2018-07-18 | Systems and methods for enhancement of retinal images |
| US16/731,837 Abandoned US20200257879A1 (en) | 2013-10-22 | 2019-12-31 | Systems and methods for enhancement of retinal images |
| US17/121,739 Abandoned US20210350110A1 (en) | 2013-10-22 | 2020-12-14 | Systems and methods for enhancement of retinal images |
| US17/838,103 Abandoned US20230036134A1 (en) | 2013-10-22 | 2022-06-10 | Systems and methods for automated processing of retinal images |
Family Applications After (11)
| Application Number | Title | Priority Date | Filing Date |
|---|---|---|---|
| US14/266,746 Active US9002085B1 (en) | 2013-10-22 | 2014-04-30 | Systems and methods for automatically generating descriptions of retinal images |
| US14/266,749 Active US8879813B1 (en) | 2013-10-22 | 2014-04-30 | Systems and methods for automated interest region detection in retinal images |
| US14/266,753 Active US9008391B1 (en) | 2013-10-22 | 2014-04-30 | Systems and methods for processing retinal images for screening of diseases or abnormalities |
| US14/500,929 Abandoned US20150110348A1 (en) | 2013-10-22 | 2014-09-29 | Systems and methods for automated detection of regions of interest in retinal images |
| US14/507,777 Abandoned US20150110370A1 (en) | 2013-10-22 | 2014-10-06 | Systems and methods for enhancement of retinal images |
| US15/238,674 Abandoned US20170039412A1 (en) | 2013-10-22 | 2016-08-16 | Systems and methods for automated detection of regions of interest in retinal images |
| US15/242,303 Abandoned US20170039689A1 (en) | 2013-10-22 | 2016-08-19 | Systems and methods for enhancement of retinal images |
| US16/039,268 Abandoned US20190042828A1 (en) | 2013-10-22 | 2018-07-18 | Systems and methods for enhancement of retinal images |
| US16/731,837 Abandoned US20200257879A1 (en) | 2013-10-22 | 2019-12-31 | Systems and methods for enhancement of retinal images |
| US17/121,739 Abandoned US20210350110A1 (en) | 2013-10-22 | 2020-12-14 | Systems and methods for enhancement of retinal images |
| US17/838,103 Abandoned US20230036134A1 (en) | 2013-10-22 | 2022-06-10 | Systems and methods for automated processing of retinal images |
Country Status (3)
| Country | Link |
|---|---|
| US (12) | US8885901B1 (en) |
| EP (2) | EP4057215A1 (en) |
| WO (1) | WO2015060897A1 (en) |
Cited By (14)
| Publication number | Priority date | Publication date | Assignee | Title |
|---|---|---|---|---|
| US20150110370A1 (en) * | 2013-10-22 | 2015-04-23 | Eyenuk, Inc. | Systems and methods for enhancement of retinal images |
| CN105069803A (en) * | 2015-08-19 | 2015-11-18 | 西安交通大学 | Classifier for micro-angioma of diabetes lesion based on colored image |
| US20160063695A1 (en) * | 2014-08-29 | 2016-03-03 | Samsung Medison Co., Ltd. | Ultrasound image display apparatus and method of displaying ultrasound image |
| US20170154415A1 (en) * | 2015-11-30 | 2017-06-01 | Disney Enterprises, Inc. | Saliency-weighted video quality assessment |
| WO2018200840A1 (en) | 2017-04-27 | 2018-11-01 | Retinopathy Answer Limited | System and method for automated funduscopic image analysis |
| CN109447935A (en) * | 2018-11-16 | 2019-03-08 | 哈工大机器人(山东)智能装备研究院 | Infrared Image Processing Method, device, computer equipment and readable storage medium storing program for executing |
| US10886029B2 (en) | 2017-11-08 | 2021-01-05 | International Business Machines Corporation | 3D web-based annotation |
| CN112750074A (en) * | 2021-04-06 | 2021-05-04 | 南京智莲森信息技术有限公司 | Small sample image feature enhancement method and system and image classification method and system |
| US11024013B2 (en) | 2019-03-08 | 2021-06-01 | International Business Machines Corporation | Neural network based enhancement of intensity images |
| WO2021188463A1 (en) * | 2020-03-19 | 2021-09-23 | Digital Diagnostics Inc. | Image retention and stitching for minimal-flash eye disease diagnosis |
| WO2021243246A1 (en) * | 2020-05-29 | 2021-12-02 | University Of Florida Research Foundation | A machine learning system and method for predicting alzheimer's disease based on retinal fundus images |
| US11205103B2 (en) | 2016-12-09 | 2021-12-21 | The Research Foundation for the State University | Semisupervised autoencoder for sentiment analysis |
| US20230359910A1 (en) * | 2017-08-30 | 2023-11-09 | P Tech, Llc | Artificial intelligence and/or virtual reality for activity optimization/personalization |
| US11894125B2 (en) | 2018-10-17 | 2024-02-06 | Google Llc | Processing fundus camera images using machine learning models trained using other modalities |
Families Citing this family (249)
| Publication number | Priority date | Publication date | Assignee | Title |
|---|---|---|---|---|
| WO2010101660A2 (en) | 2009-03-06 | 2010-09-10 | Bio-Tree Sytems, Inc. | Vascular analysis methods and apparatus |
| SG187736A1 (en) | 2010-08-17 | 2013-03-28 | Ambrx Inc | Modified relaxin polypeptides and their uses |
| JP5665655B2 (en) * | 2011-05-24 | 2015-02-04 | 株式会社日立製作所 | Image processing apparatus and method |
| JP6184964B2 (en) * | 2011-10-05 | 2017-08-23 | シレカ セラノスティクス エルエルシー | Methods and systems for analyzing biological samples with spectral images. |
| US9042630B2 (en) | 2011-10-26 | 2015-05-26 | Definiens Ag | Biomarker evaluation through image analysis |
| US20150021228A1 (en) | 2012-02-02 | 2015-01-22 | Visunex Medical Systems Co., Ltd. | Eye imaging apparatus and systems |
| US9351639B2 (en) | 2012-03-17 | 2016-05-31 | Visunex Medical Systems Co. Ltd. | Eye imaging apparatus with a wide field of view and related methods |
| KR20150043312A (en) * | 2012-07-12 | 2015-04-22 | 주식회사 듀얼어퍼처인터네셔널 | Gesture-based user interface |
| US9798918B2 (en) * | 2012-10-05 | 2017-10-24 | Cireca Theranostics, Llc | Method and system for analyzing biological specimens by spectral imaging |
| CN105103188A (en) * | 2013-03-28 | 2015-11-25 | 汤姆逊许可公司 | Method and apparatus of creating a perceptual harmony map |
| JP6415433B2 (en) * | 2013-06-18 | 2018-10-31 | キヤノン株式会社 | Tomosynthesis imaging control device, imaging device, imaging system, control method, and program for causing computer to execute the control method |
| EP2865323B1 (en) * | 2013-10-23 | 2022-02-16 | Canon Kabushiki Kaisha | Retinal movement tracking in optical coherence tomography |
| JP6588462B2 (en) * | 2013-12-23 | 2019-10-09 | アールエスビーブイ,リミティド ライアビリティ カンパニー | Wide-field retinal image acquisition system and method |
| US20170140528A1 (en) * | 2014-01-25 | 2017-05-18 | Amir Aharon Handzel | Automated histological diagnosis of bacterial infection using image analysis |
| US9237847B2 (en) | 2014-02-11 | 2016-01-19 | Welch Allyn, Inc. | Ophthalmoscope device |
| US9211064B2 (en) | 2014-02-11 | 2015-12-15 | Welch Allyn, Inc. | Fundus imaging system |
| US10043112B2 (en) * | 2014-03-07 | 2018-08-07 | Qualcomm Incorporated | Photo management |
| CN110811691B (en) * | 2014-03-20 | 2022-08-05 | 深圳迈瑞生物医疗电子股份有限公司 | Method and device for automatically identifying measurement items and ultrasonic imaging equipment |
| EP3129955B1 (en) * | 2014-04-07 | 2020-07-08 | Mimo AG | Method for the analysis of image data representing a three-dimensional volume of biological tissue |
| JP6547739B2 (en) * | 2014-05-02 | 2019-07-24 | ソニー株式会社 | IMAGE PROCESSING APPARATUS, IMAGE PROCESSING METHOD, AND PROGRAM |
| JP6282942B2 (en) * | 2014-06-18 | 2018-02-21 | キヤノンメディカルシステムズ株式会社 | Ultrasonic diagnostic apparatus, image processing apparatus, and image processing program |
| US9986908B2 (en) | 2014-06-23 | 2018-06-05 | Visunex Medical Systems Co. Ltd. | Mechanical features of an eye imaging apparatus |
| JP6324828B2 (en) * | 2014-07-07 | 2018-05-16 | 株式会社日立製作所 | Medicinal effect analysis system and medicinal effect analysis method |
| US9953425B2 (en) | 2014-07-30 | 2018-04-24 | Adobe Systems Incorporated | Learning image categorization using related attributes |
| US9536293B2 (en) * | 2014-07-30 | 2017-01-03 | Adobe Systems Incorporated | Image assessment using deep convolutional neural networks |
| CA2951600C (en) * | 2014-08-04 | 2022-12-06 | Ventana Medical Systems, Inc. | Image analysis system using context features |
| US10325176B2 (en) | 2014-08-25 | 2019-06-18 | Agency For Science, Technology And Research | Methods and systems for assessing retinal images, and obtaining information from retinal images |
| EP3192051B1 (en) * | 2014-09-08 | 2021-12-08 | The Cleveland Clinic Foundation | Automated analysis of angiographic images |
| US10835213B2 (en) * | 2014-09-11 | 2020-11-17 | Koninklijke Philips N.V. | Quality metric for multi-beat echocardiographic acquisitions for immediate user feedback |
| US9576218B2 (en) * | 2014-11-04 | 2017-02-21 | Canon Kabushiki Kaisha | Selecting features from image data |
| US11546527B2 (en) * | 2018-07-05 | 2023-01-03 | Irisvision, Inc. | Methods and apparatuses for compensating for retinitis pigmentosa |
| US9349178B1 (en) * | 2014-11-24 | 2016-05-24 | Siemens Aktiengesellschaft | Synthetic data-driven hemodynamic determination in medical imaging |
| US9378688B2 (en) * | 2014-11-24 | 2016-06-28 | Caterpillar Inc. | System and method for controlling brightness in areas of a liquid crystal display |
| US9824189B2 (en) * | 2015-01-23 | 2017-11-21 | Panasonic Intellectual Property Management Co., Ltd. | Image processing apparatus, image processing method, image display system, and storage medium |
| CN107708524A (en) | 2015-01-26 | 2018-02-16 | 威盛纳斯医疗系统公司 | Disposable separation sleeve for eye imaging devices and associated method |
| US10299117B2 (en) * | 2015-02-25 | 2019-05-21 | Screenovate Technologies Ltd. | Method for authenticating a mobile device and establishing a direct mirroring connection between the authenticated mobile device and a target screen device |
| US10799115B2 (en) | 2015-02-27 | 2020-10-13 | Welch Allyn, Inc. | Through focus retinal image capturing |
| US11045088B2 (en) | 2015-02-27 | 2021-06-29 | Welch Allyn, Inc. | Through focus retinal image capturing |
| EP3065086A1 (en) * | 2015-03-02 | 2016-09-07 | Medizinische Universität Wien | Computerized device and method for processing image data |
| US9721186B2 (en) * | 2015-03-05 | 2017-08-01 | Nant Holdings Ip, Llc | Global signatures for large-scale image recognition |
| EP3265842A1 (en) * | 2015-03-05 | 2018-01-10 | CrystalView Medical Imaging Limited | Clutter suppression in ultrasonic imaging systems |
| US10115194B2 (en) * | 2015-04-06 | 2018-10-30 | IDx, LLC | Systems and methods for feature detection in retinal images |
| CA2985097A1 (en) * | 2015-05-05 | 2016-11-10 | Wolfgang Fink | Smartphone-based handheld ophthalmic examination devices |
| WO2016177722A1 (en) | 2015-05-05 | 2016-11-10 | Medizinische Universität Wien | Computerized device and method for processing image data |
| US10275876B2 (en) | 2015-06-12 | 2019-04-30 | International Business Machines Corporation | Methods and systems for automatically selecting an implant for a patient |
| CN104915934B (en) * | 2015-06-15 | 2017-10-27 | 电子科技大学 | A kind of grayscale image enhancement method based on retinal mechanisms |
| US9734567B2 (en) | 2015-06-24 | 2017-08-15 | Samsung Electronics Co., Ltd. | Label-free non-reference image quality assessment via deep neural network |
| CN107735136B (en) * | 2015-06-30 | 2021-11-02 | 瑞思迈私人有限公司 | Mask sizing tool using mobile applications |
| US10136804B2 (en) | 2015-07-24 | 2018-11-27 | Welch Allyn, Inc. | Automatic fundus image capture system |
| US10755810B2 (en) | 2015-08-14 | 2020-08-25 | Elucid Bioimaging Inc. | Methods and systems for representing, storing, and accessing computable medical imaging-derived quantities |
| US10722115B2 (en) * | 2015-08-20 | 2020-07-28 | Ohio University | Devices and methods for classifying diabetic and macular degeneration |
| US10314473B2 (en) * | 2015-09-09 | 2019-06-11 | New York University | System and method for in vivo detection of fluorescence from an eye |
| DE102015217429A1 (en) * | 2015-09-11 | 2017-03-16 | Siemens Healthcare Gmbh | Diagnostic system and diagnostic procedure |
| EP3142040A1 (en) * | 2015-09-11 | 2017-03-15 | Canon Kabushiki Kaisha | Information processing apparatus, method of controlling the same, and program |
| JP6775343B2 (en) | 2015-09-11 | 2020-10-28 | キヤノン株式会社 | Information processing device and its control method and program |
| US10182097B2 (en) | 2015-09-23 | 2019-01-15 | Board Of Regents, The University Of Texas System | Predicting a viewer's quality of experience |
| US10127654B2 (en) * | 2015-10-07 | 2018-11-13 | Toshiba Medical Systems Corporation | Medical image processing apparatus and method |
| US10779733B2 (en) | 2015-10-16 | 2020-09-22 | At&T Intellectual Property I, L.P. | Telemedicine application of video analysis and motion augmentation |
| WO2017070107A1 (en) * | 2015-10-19 | 2017-04-27 | The Charles Stark Draper Laboratory Inc. | System and method for the selection of optical coherence tomography slices |
| US10772495B2 (en) | 2015-11-02 | 2020-09-15 | Welch Allyn, Inc. | Retinal image capturing |
| US10130250B2 (en) * | 2015-11-02 | 2018-11-20 | Nidek Co., Ltd. | OCT data processing apparatus and OCT data processing program |
| US10810240B2 (en) * | 2015-11-06 | 2020-10-20 | RedShred LLC | Automatically assessing structured data for decision making |
| WO2018094381A1 (en) * | 2016-11-21 | 2018-05-24 | Tecumseh Vision, Llc | System and method for automatic assessment of disease condition using oct scan data |
| KR102564476B1 (en) * | 2015-11-30 | 2023-08-07 | 삼성전자주식회사 | Method and apparatus for aligning object in image |
| US10235608B2 (en) | 2015-12-22 | 2019-03-19 | The Nielsen Company (Us), Llc | Image quality assessment using adaptive non-overlapping mean estimation |
| NL2016013B1 (en) * | 2015-12-23 | 2017-07-03 | Easyscan B V | Eye examination system comprising a fundus camera and an analyzing system. |
| US9931033B2 (en) | 2015-12-28 | 2018-04-03 | Canon Kabushiki Kaisha | System and method for controlling a fundus imaging apparatus |
| US9886647B1 (en) * | 2015-12-30 | 2018-02-06 | Snap Inc. | Image segmentation for object modeling |
| US10413179B2 (en) | 2016-01-07 | 2019-09-17 | Welch Allyn, Inc. | Infrared fundus imaging system |
| EP3411755A4 (en) * | 2016-02-03 | 2019-10-09 | Sportlogiq Inc. | Systems and methods for automated camera calibration |
| WO2017136696A1 (en) * | 2016-02-05 | 2017-08-10 | Murali Archana | Methods and apparatus for processing opthalmic biomarkers |
| PL3417401T3 (en) * | 2016-02-19 | 2022-05-16 | Optovue, Inc. | Method for reducing artifacts in oct using machine learning techniques |
| JP7193343B2 (en) | 2016-02-19 | 2022-12-20 | オプトビュー,インコーポレーテッド | Method and apparatus for reducing artifacts in OCT angiography using machine learning techniques |
| US9760690B1 (en) | 2016-03-10 | 2017-09-12 | Siemens Healthcare Gmbh | Content-based medical image rendering based on machine learning |
| US9779492B1 (en) * | 2016-03-15 | 2017-10-03 | International Business Machines Corporation | Retinal image quality assessment, error identification and automatic quality correction |
| US10366792B2 (en) * | 2016-05-02 | 2019-07-30 | Bio-Tree Systems, Inc. | System and method for detecting retina disease |
| US10346949B1 (en) * | 2016-05-27 | 2019-07-09 | Augmented Pixels, Inc. | Image registration |
| EP3463045B1 (en) | 2016-05-29 | 2022-07-06 | Nova-Sight Ltd. | Display system and method |
| CN106101540B (en) * | 2016-06-28 | 2019-08-06 | 北京旷视科技有限公司 | Focus point determines method and device |
| WO2018017097A1 (en) * | 2016-07-21 | 2018-01-25 | Flagship Biosciences Inc. | Computerized methods for cell based pattern recognition |
| US20180042577A1 (en) * | 2016-08-12 | 2018-02-15 | General Electric Company | Methods and systems for ultrasound imaging |
| DE202017104953U1 (en) | 2016-08-18 | 2017-12-04 | Google Inc. | Processing fundus images using machine learning models |
| WO2018039216A1 (en) * | 2016-08-22 | 2018-03-01 | Iris International, Inc. | System and method of classification of biological particles |
| DE102016216203A1 (en) * | 2016-08-29 | 2017-09-14 | Siemens Healthcare Gmbh | Medical imaging system |
| US10878293B2 (en) * | 2016-08-30 | 2020-12-29 | Memorial Sloan Kettering Cancer Center | System, method and computer-accessible medium for quantification of blur in digital images |
| JP6615723B2 (en) * | 2016-09-07 | 2019-12-04 | 株式会社ソニー・インタラクティブエンタテインメント | Information processing apparatus and object recognition method |
| US10602926B2 (en) | 2016-09-29 | 2020-03-31 | Welch Allyn, Inc. | Through focus retinal image capturing |
| US10321818B2 (en) | 2016-10-31 | 2019-06-18 | Brainscope Company, Inc. | System and method for ocular function tests |
| US10169872B2 (en) | 2016-11-02 | 2019-01-01 | International Business Machines Corporation | Classification of severity of pathological condition using hybrid image representation |
| EP3424406A1 (en) | 2016-11-22 | 2019-01-09 | Delphinium Clinic Ltd. | Method and system for classifying optic nerve head |
| US20190261938A1 (en) * | 2016-11-23 | 2019-08-29 | Koninklijke Philips N.V. | Closed-loop system for contextually-aware image-quality collection and feedback |
| CN106558031B (en) * | 2016-12-02 | 2018-12-28 | 北京理工大学 | A kind of image enchancing method of the colored eyeground figure based on imaging model |
| US20180157928A1 (en) * | 2016-12-07 | 2018-06-07 | General Electric Company | Image analytics platform for medical data using expert knowledge models |
| US10163241B2 (en) * | 2016-12-09 | 2018-12-25 | Microsoft Technology Licensing, Llc | Automatic generation of fundus drawings |
| JP7054787B2 (en) * | 2016-12-22 | 2022-04-15 | パナソニックIpマネジメント株式会社 | Control methods, information terminals, and programs |
| DE102016226230B4 (en) * | 2016-12-27 | 2018-07-12 | Siemens Healthcare Gmbh | Automated image inspection in X-ray imaging |
| US11106809B2 (en) | 2016-12-28 | 2021-08-31 | Samsung Electronics Co., Ltd. | Privacy-preserving transformation of continuous data |
| CN106725292B (en) * | 2016-12-30 | 2018-07-24 | 深圳市新产业眼科新技术有限公司 | Multispectral fundus imaging remote diagnosis system and its operation method |
| US10663711B2 (en) | 2017-01-04 | 2020-05-26 | Corista, LLC | Virtual slide stage (VSS) method for viewing whole slide images |
| US10740880B2 (en) * | 2017-01-18 | 2020-08-11 | Elucid Bioimaging Inc. | Systems and methods for analyzing pathologies utilizing quantitative imaging |
| US10140709B2 (en) * | 2017-02-27 | 2018-11-27 | International Business Machines Corporation | Automatic detection and semantic description of lesions using a convolutional neural network |
| US10607393B2 (en) | 2017-03-10 | 2020-03-31 | Siemens Healthcare Gmbh | Consistent 3D rendering in medical imaging |
| US10135822B2 (en) * | 2017-03-21 | 2018-11-20 | YouaretheID, LLC | Biometric authentication of individuals utilizing characteristics of bone and blood vessel structures |
| US11374929B2 (en) | 2017-03-21 | 2022-06-28 | Global E-Dentity, Inc. | Biometric authentication for an augmented reality or a virtual reality device |
| US10475165B2 (en) * | 2017-04-06 | 2019-11-12 | Disney Enterprises, Inc. | Kernel-predicting convolutional neural networks for denoising |
| GB201705876D0 (en) * | 2017-04-11 | 2017-05-24 | Kheiron Medical Tech Ltd | Recist |
| GB201705911D0 (en) | 2017-04-12 | 2017-05-24 | Kheiron Medical Tech Ltd | Abstracts |
| CN108172291B (en) * | 2017-05-04 | 2020-01-07 | 深圳硅基智能科技有限公司 | Diabetic retinopathy recognition system based on fundus images |
| CN107330873B (en) * | 2017-05-05 | 2019-12-10 | 浙江大学 | Stereo image quality objective evaluation method based on multi-scale binocular fusion and local feature extraction |
| AU2018269372B2 (en) * | 2017-05-18 | 2020-08-06 | Welch Allyn, Inc. | Fundus image capturing |
| CN109348732A (en) * | 2017-05-30 | 2019-02-15 | 正凯人工智能私人有限公司 | Image processing method and system |
| US10657415B2 (en) * | 2017-06-02 | 2020-05-19 | Htc Corporation | Image correspondence determining method and apparatus |
| WO2018227325A1 (en) | 2017-06-12 | 2018-12-20 | Beijing Didi Infinity Technology And Development Co., Ltd. | Systems and methods for determining an estimated time of arrival |
| AU2018289501B2 (en) * | 2017-06-20 | 2022-09-15 | University Of Louisville Research Foundation, Inc. | Segmentation of retinal blood vessels in optical coherence tomography angiography images |
| JP6821519B2 (en) * | 2017-06-21 | 2021-01-27 | 株式会社トプコン | Ophthalmic equipment, ophthalmic image processing methods, programs, and recording media |
| CN107330269A (en) * | 2017-06-29 | 2017-11-07 | 中国人民解放军63796部队 | More than 4 kinds even information minimum range selection methods |
| FR3069359B1 (en) | 2017-07-21 | 2019-08-23 | Dental Monitoring | METHOD FOR ANALYZING AN IMAGE OF A DENTAL ARCADE |
| FR3069361B1 (en) | 2017-07-21 | 2019-08-23 | Dental Monitoring | METHOD FOR ANALYZING AN IMAGE OF A DENTAL ARCADE |
| FR3069360B1 (en) * | 2017-07-21 | 2022-11-04 | Dental Monitoring | METHOD FOR ANALYZING AN IMAGE OF A DENTAL ARCH |
| FR3069355B1 (en) * | 2017-07-21 | 2023-02-10 | Dental Monitoring | Method for training a neural network by enriching its learning base for the analysis of a dental arch image |
| FR3069358B1 (en) * | 2017-07-21 | 2021-10-15 | Dental Monitoring | METHOD OF ANALYSIS OF AN IMAGE OF A DENTAL ARCH |
| SG11201912260TA (en) * | 2017-07-28 | 2020-01-30 | Nat Univ Singapore | Method of modifying a retina fundus image for a deep learning model |
| US10699163B1 (en) * | 2017-08-18 | 2020-06-30 | Massachusetts Institute Of Technology | Methods and apparatus for classification |
| CN107452185A (en) * | 2017-09-21 | 2017-12-08 | 深圳市晟达机械设计有限公司 | A kind of effective mountain area natural calamity early warning system |
| WO2019074545A1 (en) * | 2017-10-13 | 2019-04-18 | iHealthScreen Inc. | Image based screening system for prediction of individual at risk of late age-related macular degeneration (amd) |
| WO2019075410A1 (en) * | 2017-10-13 | 2019-04-18 | Ai Technologies Inc. | Deep learning-based diagnosis and referral of ophthalmic diseases and disorders |
| WO2019079647A2 (en) * | 2017-10-18 | 2019-04-25 | Wuxi Nextcode Genomics Usa, Inc. | Statistical ai for advanced deep learning and probabilistic programing in the biosciences |
| WO2019077613A1 (en) * | 2017-10-19 | 2019-04-25 | Aeye Health Llc | Blood vessels analysis methodology for the detection of retina abnormalities |
| WO2019082202A1 (en) * | 2017-10-23 | 2019-05-02 | Artificial Learning Systems India Private Limited | A fundus image quality assessment system |
| WO2019082203A1 (en) * | 2017-10-24 | 2019-05-02 | Artificial Learning Systems India Private Limited | A system and method for detection and classification of retinal disease |
| KR20190046471A (en) * | 2017-10-26 | 2019-05-07 | 삼성전자주식회사 | Method for processing of medical image and medical image processing apparatus thereof |
| JP7178672B6 (en) * | 2017-10-27 | 2022-12-20 | ビュノ インコーポレイテッド | METHOD AND APPARATUS USING THE SAME TO SUPPORT READING OF FUNDUS IMAGE OF SUBJECT |
| US10997727B2 (en) * | 2017-11-07 | 2021-05-04 | Align Technology, Inc. | Deep learning for tooth detection and evaluation |
| CN111344716A (en) * | 2017-11-14 | 2020-06-26 | 奇跃公司 | Full convolution point of interest detection and description via homography transformation adaptation |
| US20190156200A1 (en) * | 2017-11-17 | 2019-05-23 | Aivitae LLC | System and method for anomaly detection via a multi-prediction-model architecture |
| US11062479B2 (en) | 2017-12-06 | 2021-07-13 | Axalta Coating Systems Ip Co., Llc | Systems and methods for matching color and appearance of target coatings |
| US10832808B2 (en) | 2017-12-13 | 2020-11-10 | International Business Machines Corporation | Automated selection, arrangement, and processing of key images |
| EP3730040A4 (en) | 2017-12-20 | 2021-10-06 | Medi Whale Inc. | Method and apparatus for assisting in diagnosis of cardiovascular disease |
| US20220301709A1 (en) * | 2017-12-20 | 2022-09-22 | Medi Whale Inc. | Diagnosis assistance method and cardiovascular disease diagnosis assistance method |
| US10510145B2 (en) | 2017-12-27 | 2019-12-17 | Industrial Technology Research Institute | Medical image comparison method and system thereof |
| US11051693B2 (en) | 2017-12-27 | 2021-07-06 | Eyenk, Inc. | Systems and methods for automated end-to-end eye screening, monitoring and diagnosis |
| US11093770B2 (en) * | 2017-12-29 | 2021-08-17 | Idemia Identity & Security USA LLC | System and method for liveness detection |
| CN108198136A (en) * | 2018-01-05 | 2018-06-22 | 武汉大学 | Smooth boundary map datum multi-scale information derived method based on Fourier's series |
| AU2019207516B2 (en) * | 2018-01-11 | 2024-03-14 | Centre For Eye Research Australia Limited | Method and system for quantifying biomarker of a tissue |
| WO2019142243A1 (en) * | 2018-01-16 | 2019-07-25 | オリンパス株式会社 | Image diagnosis support system and image diagnosis support method |
| WO2019160962A1 (en) | 2018-02-13 | 2019-08-22 | Frank Werblin | Methods and apparatus for contrast sensitivity compensation |
| US11382601B2 (en) * | 2018-03-01 | 2022-07-12 | Fujifilm Sonosite, Inc. | Method and apparatus for annotating ultrasound examinations |
| US10719932B2 (en) * | 2018-03-01 | 2020-07-21 | Carl Zeiss Meditec, Inc. | Identifying suspicious areas in ophthalmic data |
| WO2019172206A1 (en) * | 2018-03-05 | 2019-09-12 | 株式会社ニデック | Ocular fundus image processing device and ocular fundus image processing program |
| US10892050B2 (en) | 2018-04-13 | 2021-01-12 | International Business Machines Corporation | Deep image classification of medical images |
| CN108537282A (en) * | 2018-04-13 | 2018-09-14 | 东北大学 | A kind of diabetic retinopathy stage division using extra lightweight SqueezeNet networks |
| CN108615051B (en) * | 2018-04-13 | 2020-09-15 | 博众精工科技股份有限公司 | Diabetic retina image classification method and system based on deep learning |
| CN108577803B (en) * | 2018-04-26 | 2020-09-01 | 上海鹰瞳医疗科技有限公司 | Fundus image detection method, device and system based on machine learning |
| CN108596895B (en) * | 2018-04-26 | 2020-07-28 | 上海鹰瞳医疗科技有限公司 | Fundus image detection method, device and system based on machine learning |
| AU2019275232A1 (en) | 2018-05-21 | 2021-01-07 | Corista, LLC | Multi-sample whole slide image processing via multi-resolution registration |
| US11096574B2 (en) | 2018-05-24 | 2021-08-24 | Welch Allyn, Inc. | Retinal image capturing |
| CN108921172B (en) * | 2018-05-31 | 2021-01-12 | 清华大学 | Image processing device and method based on support vector machine |
| US10726548B2 (en) * | 2018-06-25 | 2020-07-28 | Bay Labs, Inc. | Confidence determination in a medical imaging video clip measurement based upon video clip image quality |
| US10631791B2 (en) | 2018-06-25 | 2020-04-28 | Caption Health, Inc. | Video clip selector for medical imaging and diagnosis |
| US11050984B1 (en) * | 2018-06-27 | 2021-06-29 | CAPTUREPROOF, Inc. | Image quality detection and correction system |
| CN109002796B (en) * | 2018-07-16 | 2020-08-04 | 阿里巴巴集团控股有限公司 | Image acquisition method, device and system and electronic equipment |
| US10970838B2 (en) * | 2018-07-18 | 2021-04-06 | Case Western Reserve University | Hough transform-based vascular network disorder features on baseline fluorescein angiography scans predict response to anti-VEGF therapy in diabetic macular edema |
| CN108920720B (en) * | 2018-07-30 | 2021-09-07 | 电子科技大学 | Large-scale image retrieval method based on depth hash and GPU acceleration |
| DK3610783T3 (en) * | 2018-08-17 | 2022-12-05 | Optos Plc | IMAGE QUALITY ASSESSMENT |
| US20210327540A1 (en) * | 2018-08-17 | 2021-10-21 | Henry M. Jackson Foundation For The Advancement Of Military Medicine | Use of machine learning models for prediction of clinical outcomes |
| US11288800B1 (en) * | 2018-08-24 | 2022-03-29 | Google Llc | Attribution methodologies for neural networks designed for computer-aided diagnostic processes |
| US11704791B2 (en) * | 2018-08-30 | 2023-07-18 | Topcon Corporation | Multivariate and multi-resolution retinal image anomaly detection system |
| CN110870759A (en) * | 2018-08-31 | 2020-03-10 | 福州依影健康科技有限公司 | Quality control method and system for remote fundus screening and storage device |
| CN109344833B (en) * | 2018-09-04 | 2020-12-18 | 中国科学院深圳先进技术研究院 | Medical image segmentation method, segmentation system and computer-readable storage medium |
| WO2020067994A1 (en) * | 2018-09-26 | 2020-04-02 | Tan Tock Seng Hospital Pte Ltd | System and method for imaging a body part for assessment |
| CN109559285B (en) * | 2018-10-26 | 2021-08-06 | 北京东软医疗设备有限公司 | Image enhancement display method and related device |
| US20210407096A1 (en) * | 2018-10-30 | 2021-12-30 | The Regents Of The University Of California | System for estimating primary open-angle glaucoma likelihood |
| CN109409388B (en) * | 2018-11-07 | 2021-08-27 | 安徽师范大学 | Dual-mode deep learning descriptor construction method based on graphic primitives |
| CN109528155B (en) * | 2018-11-19 | 2021-07-13 | 复旦大学附属眼耳鼻喉科医院 | Intelligent screening system suitable for high myopia complicated with open angle glaucoma and establishment method thereof |
| WO2020106792A1 (en) | 2018-11-21 | 2020-05-28 | University Of Washington | System and method for retina template matching in teleophthalmology |
| CN109544540B (en) * | 2018-11-28 | 2020-12-25 | 东北大学 | Diabetic retina image quality detection method based on image analysis technology |
| US10963757B2 (en) | 2018-12-14 | 2021-03-30 | Industrial Technology Research Institute | Neural network model fusion method and electronic device using the same |
| US11138732B2 (en) | 2018-12-21 | 2021-10-05 | Welch Allyn, Inc. | Assessment of fundus images |
| KR102289277B1 (en) * | 2018-12-21 | 2021-08-13 | 주식회사 인피니트헬스케어 | Medical image diagnosis assistance apparatus and method generating evaluation score about a plurality of medical image diagnosis algorithm |
| US20220122730A1 (en) * | 2019-01-16 | 2022-04-21 | Tecumseh Vision, Llc | Using artificial intelligence and biometric data for serial screening exams for medical conditions |
| US11191492B2 (en) * | 2019-01-18 | 2021-12-07 | International Business Machines Corporation | Early detection and management of eye diseases by forecasting changes in retinal structures and visual function |
| WO2020160606A1 (en) * | 2019-02-07 | 2020-08-13 | Commonwealth Scientific And Industrial Research Organisation | Diagnostic imaging for diabetic retinopathy |
| EP3937753A4 (en) * | 2019-03-13 | 2023-03-29 | The Board Of Trustees Of The University Of Illinois | Supervised machine learning based multi-task artificial intelligence classification of retinopathies |
| US10430946B1 (en) * | 2019-03-14 | 2019-10-01 | Inception Institute of Artificial Intelligence, Ltd. | Medical image segmentation and severity grading using neural network architectures with semi-supervised learning techniques |
| JP2022527571A (en) * | 2019-03-19 | 2022-06-02 | オプティナ・ダイアグノスティクス・インコーポレイテッド | Methods and systems for identifying subjects who may be affected by the medical condition |
| US11094064B2 (en) * | 2019-03-22 | 2021-08-17 | LighTopTech Corp. | Three dimensional corneal imaging with gabor-domain optical coherence microscopy |
| WO2020193337A1 (en) * | 2019-03-23 | 2020-10-01 | British Telecommunications Public Limited Company | Configuring distributed sequential transactional databases |
| US11074479B2 (en) * | 2019-03-28 | 2021-07-27 | International Business Machines Corporation | Learning of detection model using loss function |
| CN109977905B (en) * | 2019-04-04 | 2021-08-06 | 北京百度网讯科技有限公司 | Method and apparatus for processing fundus images |
| EP3719807A1 (en) * | 2019-04-04 | 2020-10-07 | Optos PLC | Predicting a pathological condition from a medical image |
| US20220151490A1 (en) * | 2019-04-26 | 2022-05-19 | Oregon Health & Science University | Detecting avascular and signal reduction areas in retinas using neural networks |
| US11263747B2 (en) | 2019-04-26 | 2022-03-01 | Oregon Health & Science University | Detecting avascular areas using neural networks |
| CN110456960B (en) * | 2019-05-09 | 2021-10-01 | 华为技术有限公司 | Image processing method, device and equipment |
| US11478145B2 (en) * | 2019-05-15 | 2022-10-25 | Aizhong Zhang | Multispectral and hyperspectral meibography |
| US11380115B2 (en) * | 2019-06-04 | 2022-07-05 | Idemia Identity & Security USA LLC | Digital identifier for a document |
| US10855965B1 (en) * | 2019-06-28 | 2020-12-01 | Hong Kong Applied Science and Technology Research Institute Company, Limited | Dynamic multi-view rendering for autostereoscopic displays by generating reduced number of views for less-critical segments based on saliency/depth/eye gaze map |
| TWI702615B (en) * | 2019-07-26 | 2020-08-21 | 長佳智能股份有限公司 | Retinopathy assessment model establishment method and system |
| CN110477850A (en) * | 2019-09-04 | 2019-11-22 | 华厦眼科医院集团股份有限公司 | A kind of AI ophthalmology health detection equipment and its detection method |
| US11253151B2 (en) | 2019-09-08 | 2022-02-22 | Aizhong Zhang | Multispectral and hyperspectral ocular surface evaluator |
| US11710238B2 (en) * | 2019-10-24 | 2023-07-25 | Case Western Reserve University | Plaque segmentation in intravascular optical coherence tomography (OCT) images using deep learning |
| US11087532B2 (en) * | 2019-11-05 | 2021-08-10 | Raytheon Company | Ortho-image mosaic production system |
| CN111242156B (en) * | 2019-11-13 | 2022-02-08 | 南通大学 | Hyperplane nearest neighbor classification method for microangioma medical record images |
| CN111127425B (en) * | 2019-12-23 | 2023-04-28 | 北京至真互联网技术有限公司 | Target detection positioning method and device based on retina fundus image |
| US11769056B2 (en) | 2019-12-30 | 2023-09-26 | Affectiva, Inc. | Synthetic data for neural network training using vectors |
| CN111311561B (en) * | 2020-02-10 | 2023-10-10 | 浙江未来技术研究院(嘉兴) | Automatic operation area photometry method and device based on microsurgery imaging system |
| CN111325727B (en) * | 2020-02-19 | 2023-06-16 | 重庆邮电大学 | Intracranial hemorrhage area three-dimensional segmentation method based on local entropy and level set algorithm |
| US20230068571A1 (en) * | 2020-02-26 | 2023-03-02 | Ibex Medical Analytics Ltd. | System and method of managing workflow of examination of pathology slides |
| CN111353980B (en) * | 2020-02-27 | 2022-05-17 | 浙江大学 | Fundus fluorescence radiography image leakage point detection method based on deep learning |
| US11244754B2 (en) | 2020-03-24 | 2022-02-08 | International Business Machines Corporation | Artificial neural network combining sensory signal classification and image generation |
| US11727568B2 (en) * | 2020-03-24 | 2023-08-15 | JAR Scientific, LLC | Rapid illness screening of a population using computer vision and multispectral data |
| EP3893198A1 (en) * | 2020-04-08 | 2021-10-13 | Siemens Healthcare GmbH | Method and system for computer aided detection of abnormalities in image data |
| JP2023524038A (en) | 2020-05-01 | 2023-06-08 | マジック リープ, インコーポレイテッド | Image descriptor network with hierarchical normalization |
| US11200670B2 (en) * | 2020-05-05 | 2021-12-14 | International Business Machines Corporation | Real-time detection and correction of shadowing in hyperspectral retinal images |
| US11875480B1 (en) * | 2020-05-15 | 2024-01-16 | Verily Life Sciences Llc | Distinguishing artifacts from pathological features in digital images |
| KR102414994B1 (en) * | 2020-06-05 | 2022-06-30 | 자이메드 주식회사 | Method for facilitating validation of vascular disease using fundus image, apparatus therefor and system including the same |
| CN111754486B (en) * | 2020-06-24 | 2023-08-15 | 北京百度网讯科技有限公司 | Image processing method, device, electronic equipment and storage medium |
| CN111739616B (en) * | 2020-07-20 | 2020-12-01 | 平安国际智慧城市科技股份有限公司 | Eye image processing method, device, equipment and storage medium |
| CA3187931A1 (en) | 2020-08-13 | 2022-02-17 | Christopher Kanan | Systems and methods to process electronic images for continuous biomarker prediction |
| US20220054006A1 (en) * | 2020-08-19 | 2022-02-24 | Digital Diagnostics Inc. | Using infrared to detect proper eye alignment before capturing retinal images |
| CN112015936B (en) * | 2020-08-27 | 2021-10-26 | 北京字节跳动网络技术有限公司 | Method, device, electronic equipment and medium for generating article display diagram |
| CN112016626B (en) * | 2020-08-31 | 2023-12-01 | 中科泰明(南京)科技有限公司 | Uncertainty-based diabetic retinopathy classification system |
| CN112651921B (en) * | 2020-09-11 | 2022-05-03 | 浙江大学 | Glaucoma visual field data region extraction method based on deep learning |
| WO2022109771A1 (en) * | 2020-11-24 | 2022-06-02 | Orange | Methods and systems to monitor remote-rendering of transmitted content |
| CN112614090B (en) * | 2020-12-09 | 2021-12-31 | 中国水产科学研究院渔业机械仪器研究所 | Method and system for identifying fish abdominal cavity structural features |
| CN112686932B (en) * | 2020-12-15 | 2024-01-23 | 中国科学院苏州生物医学工程技术研究所 | Image registration method for medical image, image processing method and medium |
| WO2022150294A1 (en) * | 2021-01-05 | 2022-07-14 | Translational Imaging Innovations, Inc. | Apparatus for calibrating retinal imaging systems and related methods |
| WO2022149082A1 (en) * | 2021-01-06 | 2022-07-14 | Aeye Health, Inc. | Retinal imaging quality assessment and filtering method using blood vessel characteristics and visibility |
| JPWO2022157838A1 (en) * | 2021-01-19 | 2022-07-28 | ||
| CN113010996B (en) * | 2021-02-03 | 2022-07-22 | 南华大学 | Method and system for extracting radon concentration abnormity based on entropy-median filtering in sub-region |
| TWI775356B (en) * | 2021-03-19 | 2022-08-21 | 宏碁智醫股份有限公司 | Image pre-processing method and image processing apparatus for fundoscopic image |
| CN113128377A (en) * | 2021-04-02 | 2021-07-16 | 西安融智芙科技有限责任公司 | Black eye recognition method, black eye recognition device and terminal based on image processing |
| US11769224B2 (en) | 2021-04-08 | 2023-09-26 | Raytheon Company | Mitigating transitions in mosaic images |
| US11564568B1 (en) | 2021-05-25 | 2023-01-31 | Agnya Perceptive Solutions, L.L.C. | Eye imaging system and fundus camera positioning device |
| US11887734B2 (en) | 2021-06-10 | 2024-01-30 | Elucid Bioimaging Inc. | Systems and methods for clinical decision support for lipid-lowering therapies for cardiovascular disease |
| US11887713B2 (en) | 2021-06-10 | 2024-01-30 | Elucid Bioimaging Inc. | Non-invasive determination of likely response to anti-diabetic therapies for cardiovascular disease |
| WO2022261513A1 (en) * | 2021-06-10 | 2022-12-15 | Kang Zhang | Methods and systems of detecting and predicting chronic kidney disease and type 2 diabetes using deep learning models |
| US11887701B2 (en) | 2021-06-10 | 2024-01-30 | Elucid Bioimaging Inc. | Non-invasive determination of likely response to anti-inflammatory therapies for cardiovascular disease |
| US11869186B2 (en) | 2021-06-10 | 2024-01-09 | Elucid Bioimaging Inc. | Non-invasive determination of likely response to combination therapies for cardiovascular disease |
| CA3222336A1 (en) * | 2021-06-11 | 2022-12-15 | Colyn MUNN | System and method for detecting and classifying retinal microaneurysms |
| CN113392916B (en) * | 2021-06-23 | 2023-10-17 | 华南农业大学 | Method, system and storage medium for detecting nutrition components of moso bamboo shoots based on hyperspectral image |
| CN113768461B (en) * | 2021-09-14 | 2024-03-22 | 北京鹰瞳科技发展股份有限公司 | Fundus image analysis method, fundus image analysis system and electronic equipment |
| US20230096623A1 (en) * | 2021-09-24 | 2023-03-30 | Intelligentdx Llc | Systems and methods for vision diagnostics |
| KR102580279B1 (en) * | 2021-10-25 | 2023-09-19 | 아주대학교산학협력단 | Method for providing the necessary information for a diagnosis of alzheimer's disease and apparatus for executing the method |
| US20230177715A1 (en) * | 2021-12-03 | 2023-06-08 | Fei Company | Shape invariant method for accurate fiducial finding |
| CN114066889B (en) * | 2022-01-12 | 2022-04-29 | 广州永士达医疗科技有限责任公司 | Imaging quality detection method and device of OCT (optical coherence tomography) host |
| CN114387272B (en) * | 2022-03-23 | 2022-05-24 | 武汉富隆电气有限公司 | Cable bridge defective product detection method based on image processing |
| US20230346216A1 (en) * | 2022-04-28 | 2023-11-02 | Ohio State Innovation Foundation | Methods and systems for quantifying retinal vascular patterns and treatment of disease |
| WO2023229994A1 (en) * | 2022-05-23 | 2023-11-30 | Topcon Corporation | Automated oct capture |
| WO2024023800A1 (en) * | 2022-07-28 | 2024-02-01 | Optina Diagnostics, Inc. | Heatmap based feature preselection for retinal image analysis |
Citations (65)
| Publication number | Priority date | Publication date | Assignee | Title |
|---|---|---|---|---|
| US4584605A (en) * | 1983-11-02 | 1986-04-22 | Gte Communication Systems Corporation | Digital hysteresis for video measurement and processing system |
| US5079698A (en) * | 1989-05-03 | 1992-01-07 | Advanced Light Imaging Technologies Ltd. | Transillumination method apparatus for the diagnosis of breast tumors and other breast lesions by normalization of an electronic image of the breast |
| US5835618A (en) * | 1996-09-27 | 1998-11-10 | Siemens Corporate Research, Inc. | Uniform and non-uniform dynamic range remapping for optimum image display |
| US5878746A (en) | 1993-08-25 | 1999-03-09 | Lemelson; Jerome H. | Computerized medical diagnostic system |
| US6088473A (en) * | 1998-02-23 | 2000-07-11 | Arch Development Corporation | Method and computer readable medium for automated analysis of chest radiograph images using histograms of edge gradients for false positive reduction in lung nodule detection |
| US6226393B1 (en) * | 1997-07-04 | 2001-05-01 | Torsana Osteoporosis Diagnostics A/S | Method for estimating the bone quality or skeletal status of a vertebrate |
| WO2001087145A2 (en) | 2000-05-18 | 2001-11-22 | Michael David Abramoff | Screening system for inspecting a patient's retina |
| WO2002015818A2 (en) | 2000-08-23 | 2002-02-28 | Philadelphia Ophthalmologic Imaging Systems, Inc. | System and method for tele-ophthalmology |
| US6454410B1 (en) | 1999-10-20 | 2002-09-24 | The Trustees Of The University Of Pennsylvania | Mosaicing and enhancement of images for ophthalmic diagnosis and documentation |
| US20020141626A1 (en) | 2000-11-22 | 2002-10-03 | Anat Caspi | Automated registration of 3-D medical scans of similar anatomical structures |
| WO2003020112A2 (en) | 2001-08-30 | 2003-03-13 | Philadelphia Ophthalmic Imaging Systems | System and method for screening patients for diabetic retinopathy |
| WO2003030073A1 (en) | 2001-10-03 | 2003-04-10 | Retinalyze Danmark A/S | Quality measure |
| US20030174872A1 (en) | 2001-10-15 | 2003-09-18 | Insightful Corporation | System and method for mining quantitive information from medical images |
| US6671419B1 (en) * | 1999-07-02 | 2003-12-30 | Intel Corporation | Method for reducing shadows and/or noise in a digital image |
| US20040064057A1 (en) | 2002-07-31 | 2004-04-01 | Massachusetts Institute Of Technology | Measuring circulating blood volume through retinal vasculometry |
| US20040062429A1 (en) * | 2002-09-27 | 2004-04-01 | Kaufhold John Patrick | Method and apparatus for enhancing an image |
| US20040105074A1 (en) | 2002-08-02 | 2004-06-03 | Peter Soliz | Digital stereo image analyzer for automated analyses of human retinopathy |
| US20040126008A1 (en) * | 2000-04-24 | 2004-07-01 | Eric Chapoulaud | Analyte recognition for urinalysis diagnostic system |
| US20060093212A1 (en) * | 2004-10-28 | 2006-05-04 | Eran Steinberg | Method and apparatus for red-eye detection in an acquired digital image |
| US20060257031A1 (en) * | 2005-03-31 | 2006-11-16 | Michael Abramoff | Automatic detection of red lesions in digital color fundus photographs |
| US20070002275A1 (en) * | 2005-07-01 | 2007-01-04 | Siemens Corporate Research Inc. | Method and System For Local Adaptive Detection Of Microaneurysms In Digital Fundus Images |
| US7162073B1 (en) * | 2001-11-30 | 2007-01-09 | Cognex Technology And Investment Corporation | Methods and apparatuses for detecting classifying and measuring spot defects in an image of an object |
| US20070109499A1 (en) * | 2005-10-12 | 2007-05-17 | Siemens Corporate Research Inc | System and Method For Robust Optic Disk Detection In Retinal Images Using Vessel Structure And Radon Transform |
| US20070127795A1 (en) | 2005-11-23 | 2007-06-07 | Lau Denny W | System and method for linking current and previous images based on anatomy |
| US20070211928A1 (en) * | 2005-11-10 | 2007-09-13 | Rosetta Inpharmatics Llc | Discover biological features using composite images |
| US20070258630A1 (en) | 2006-05-03 | 2007-11-08 | Tobin Kenneth W | Method and system for the diagnosis of disease using retinal image content and an archive of diagnosed human patient data |
| US20080031521A1 (en) * | 2006-08-07 | 2008-02-07 | General Electric Company | Automated segmentation of image structures |
| US20080298723A1 (en) * | 2006-10-31 | 2008-12-04 | Brother Kogyo Kabushiki Kaisha | Image processing device |
| US7522745B2 (en) | 2000-08-31 | 2009-04-21 | Grasso Donald P | Sensor and imaging system |
| US20090226063A1 (en) * | 2008-03-06 | 2009-09-10 | Rangwala Hussain S | Image enhancement and application functionality for medical and other uses |
| US20090274358A1 (en) * | 2008-04-30 | 2009-11-05 | Thomas Flohr | Method and tomography scanner for normalizing image data with respect to a contrast in the image data produced by a contrast agent |
| US20090279772A1 (en) * | 2008-05-12 | 2009-11-12 | General Electric Company | Method and System for Identifying Defects in NDT Image Data |
| US20090323022A1 (en) | 2008-06-26 | 2009-12-31 | Canon Kabushiki Kaisha | Medical imaging apparatus |
| US20100061601A1 (en) * | 2008-04-25 | 2010-03-11 | Michael Abramoff | Optimal registration of multiple deformed images using a physical model of the imaging distortion |
| US20100142766A1 (en) * | 2008-12-04 | 2010-06-10 | Alan Duncan Fleming | Image Analysis |
| GB2467840A (en) | 2009-02-12 | 2010-08-18 | Univ Aberdeen | Detecting disease in retinal images |
| US7782464B2 (en) | 2006-05-12 | 2010-08-24 | The General Hospital Corporation | Processes, arrangements and systems for providing a fiber layer thickness map based on optical coherence tomography images |
| US20100249532A1 (en) | 2007-11-09 | 2010-09-30 | Teddy Lee Maddess | Method and Apparatus for Sensory Field Assessment |
| GB2470727A (en) | 2009-06-02 | 2010-12-08 | Univ Aberdeen | Processing retinal images using mask data from reference images |
| US7856135B1 (en) | 2009-12-02 | 2010-12-21 | Aibili—Association for Innovation and Biomedical Research on Light and Image | System for analyzing ocular fundus images |
| WO2011066366A1 (en) | 2009-11-24 | 2011-06-03 | Bioptigen, Inc. | Methods, systems and computer program products for diagnosing conditions using unique codes generated from a multidimensional image of a sample |
| US20110160562A1 (en) | 2009-12-02 | 2011-06-30 | De Oliveira E Ramos Joao Diogo | Methods and Systems for Detection of Retinal Changes |
| US20110182517A1 (en) | 2010-01-20 | 2011-07-28 | Duke University | Segmentation and identification of layered structures in images |
| US20110242306A1 (en) * | 2008-12-19 | 2011-10-06 | The Johns Hopkins University | System and method for automated detection of age related macular degeneration and other retinal abnormalities |
| CA2797725A1 (en) | 2010-04-29 | 2011-11-10 | Massachusetts Institute Of Technology | Method and apparatus for motion correction and image enhancement for optical coherence tomography |
| US20110285911A1 (en) * | 2010-05-21 | 2011-11-24 | Vixs Systems, Inc. | Contrast control device and method therefor |
| US20110285913A1 (en) * | 2010-05-21 | 2011-11-24 | Astrachan Paul M | Enhanced histogram equalization |
| US20110317935A1 (en) * | 2010-06-25 | 2011-12-29 | Fujitsu Limited | Image processing device, method thereof, and a computer readable non transitory storage medium storing an image processing program |
| US20120123232A1 (en) | 2008-12-16 | 2012-05-17 | Kayvan Najarian | Method and apparatus for determining heart rate variability using wavelet transformation |
| US20120140175A1 (en) | 2005-01-21 | 2012-06-07 | Carl Zeiss Meditec, Inc. | Method of motion correction in optical coherence tomography imaging |
| US20120150029A1 (en) | 2008-12-19 | 2012-06-14 | University Of Miami | System and Method for Detection and Monitoring of Ocular Diseases and Disorders using Optical Coherence Tomography |
| US20120177262A1 (en) | 2009-08-28 | 2012-07-12 | Centre For Eye Research Australia | Feature Detection And Measurement In Retinal Images |
| US20120184845A1 (en) | 2010-11-11 | 2012-07-19 | University Of Pittsburgh - Of The Commonwealth System Of Higher Education | Automated macular pathology diagnosis in threedimensional (3d) spectral domain optical coherence tomography (sd-oct) images |
| US20120236259A1 (en) | 2011-01-20 | 2012-09-20 | Abramoff Michael D | Automated determination of arteriovenous ratio in images of blood vessels |
| US20120249959A1 (en) | 2011-03-31 | 2012-10-04 | The Hong Kong Polytechnic University | Apparatus and method for non-invasive diabetic retinopathy detection and monitoring |
| CN101589301B (en) | 2006-08-25 | 2012-11-07 | 通用医疗公司 | Apparatus and methods for enhancing optical coherence tomography imaging using volumetric filtering techniques |
| WO2012149687A1 (en) | 2011-05-05 | 2012-11-08 | 中国科学院自动化研究所 | Method for retinal vessel extraction |
| US8320641B2 (en) * | 2004-10-28 | 2012-11-27 | DigitalOptics Corporation Europe Limited | Method and apparatus for red-eye detection using preview or other reference images |
| US8340437B2 (en) | 2007-05-29 | 2012-12-25 | University Of Iowa Research Foundation | Methods and systems for determining optimal features for classifying patterns or objects in images |
| US8355544B2 (en) | 2011-02-01 | 2013-01-15 | Universidade Da Coruna-Otri | Method, apparatus, and system for automatic retinal image analysis |
| US8515201B1 (en) | 2008-09-18 | 2013-08-20 | Stc.Unm | System and methods of amplitude-modulation frequency-modulation (AM-FM) demodulation for image and video processing |
| US8520916B2 (en) * | 2007-11-20 | 2013-08-27 | Carestream Health, Inc. | Enhancement of region of interest of radiological image |
| US20130230230A1 (en) * | 2010-07-30 | 2013-09-05 | Fundação D. Anna Sommer Champalimaud e Dr. Carlos Montez Champalimaud | Systems and methods for segmentation and processing of tissue images and feature extraction from same for treating, diagnosing, or predicting medical conditions |
| US20130321764A1 (en) * | 2012-05-30 | 2013-12-05 | National University Of Ireland, Galway | Systems and methods for imaging the fundus of the eye |
| US8687862B2 (en) | 2008-04-08 | 2014-04-01 | National University Of Singapore | Retinal image analysis systems and methods |
Family Cites Families (54)
| Publication number | Priority date | Publication date | Assignee | Title |
|---|---|---|---|---|
| US5715334A (en) * | 1994-03-08 | 1998-02-03 | The University Of Connecticut | Digital pixel-accurate intensity processing method for image information enhancement |
| DE69629732T2 (en) * | 1995-01-23 | 2004-07-15 | Fuji Photo Film Co., Ltd., Minami-Ashigara | Device for computer-aided diagnosis |
| US5848189A (en) * | 1996-03-25 | 1998-12-08 | Focus Automation Systems Inc. | Method, apparatus and system for verification of patterns |
| DE19616199B4 (en) * | 1996-04-23 | 2005-02-10 | Siemens Ag | Calculator for a computer tomograph |
| US5799100A (en) * | 1996-06-03 | 1998-08-25 | University Of South Florida | Computer-assisted method and apparatus for analysis of x-ray images using wavelet transforms |
| US7155041B2 (en) * | 2000-02-16 | 2006-12-26 | Fuji Photo Film Co., Ltd. | Anomalous shadow detection system |
| JP2004523178A (en) * | 2001-03-07 | 2004-07-29 | アイ ピー ヴィー リミテッド | How to process video into encoded bitstream |
| US20020154833A1 (en) * | 2001-03-08 | 2002-10-24 | Christof Koch | Computation of intrinsic perceptual saliency in visual environments, and applications |
| US6603882B2 (en) * | 2001-04-12 | 2003-08-05 | Seho Oh | Automatic template generation and searching method |
| US7110604B2 (en) * | 2001-06-26 | 2006-09-19 | Anoto Ab | Processing of digital images |
| TWI278782B (en) * | 2001-08-24 | 2007-04-11 | Toshiba Corp | Personal recognition apparatus |
| DE10146582A1 (en) * | 2001-09-21 | 2003-04-24 | Micronas Munich Gmbh | Device and method for the subband decomposition of image signals |
| CN100530204C (en) * | 2001-10-03 | 2009-08-19 | 雷蒂纳尔兹丹麦公司 | Assessment of lesions in an image |
| AU2002361210A1 (en) * | 2001-12-21 | 2003-07-09 | Sensomotoric Instruments Gmbh | Method and apparatus for eye registration |
| US7123783B2 (en) * | 2002-01-18 | 2006-10-17 | Arizona State University | Face classification using curvature-based multi-scale morphology |
| JP2004135868A (en) * | 2002-10-17 | 2004-05-13 | Fuji Photo Film Co Ltd | System for abnormal shadow candidate detection process |
| US7302096B2 (en) * | 2002-10-17 | 2007-11-27 | Seiko Epson Corporation | Method and apparatus for low depth of field image segmentation |
| US7949169B2 (en) * | 2002-12-04 | 2011-05-24 | Bae Kyongtae T | Method and apparatus for automated detection of target structures from medical images using a 3D morphological matching algorithm |
| EP1782622A1 (en) * | 2004-06-23 | 2007-05-09 | Koninklijke Philips Electronics N.V. | Pixel interpolation |
| US7477794B2 (en) * | 2005-06-30 | 2009-01-13 | Microsoft Corporation | Multi-level image stack of filtered images |
| US20070083114A1 (en) * | 2005-08-26 | 2007-04-12 | The University Of Connecticut | Systems and methods for image resolution enhancement |
| FR2890517A1 (en) * | 2005-09-08 | 2007-03-09 | Thomson Licensing Sas | METHOD AND DEVICE FOR DISPLAYING IMAGES |
| WO2007118079A2 (en) * | 2006-04-03 | 2007-10-18 | University Of Iowa Research Foundation | Methods and systems for optic nerve head segmentation |
| ATE470912T1 (en) * | 2006-04-28 | 2010-06-15 | Toyota Motor Europ Nv | ROBUST DETECTOR AND DESCRIPTOR FOR A POINT OF INTEREST |
| JP4196302B2 (en) * | 2006-06-19 | 2008-12-17 | ソニー株式会社 | Information processing apparatus and method, and program |
| WO2008002839A2 (en) * | 2006-06-26 | 2008-01-03 | California Institute Of Technology | Dynamic motion contrast and transverse flow estimation using optical coherence tomography |
| US7734076B2 (en) * | 2006-12-11 | 2010-06-08 | General Electric Company | Material decomposition image noise reduction |
| US7724933B2 (en) * | 2007-03-28 | 2010-05-25 | George Mason Intellectual Properties, Inc. | Functional dissipation classification of retinal images |
| US8244031B2 (en) * | 2007-04-13 | 2012-08-14 | Kofax, Inc. | System and method for identifying and classifying color regions from a digital image |
| WO2008133951A2 (en) * | 2007-04-24 | 2008-11-06 | Massachusetts Institute Of Technology | Method and apparatus for image processing |
| US20090010500A1 (en) * | 2007-06-05 | 2009-01-08 | Umasankar Kandaswamy | Face Recognition Methods and Systems |
| US8103676B2 (en) * | 2007-10-11 | 2012-01-24 | Google Inc. | Classifying search results to determine page elements |
| US8064678B2 (en) * | 2007-10-22 | 2011-11-22 | Genetix Corporation | Automated detection of cell colonies and coverslip detection using hough transforms |
| US8081808B2 (en) * | 2007-11-08 | 2011-12-20 | Topcon Medical Systems, Inc. | Retinal thickness measurement by combined fundus image and three-dimensional optical coherence tomography |
| US8401276B1 (en) * | 2008-05-20 | 2013-03-19 | University Of Southern California | 3-D reconstruction and registration |
| US8189945B2 (en) * | 2009-05-27 | 2012-05-29 | Zeitera, Llc | Digital video content fingerprinting based on scale invariant interest region detection with an array of anisotropic filters |
| US8233716B2 (en) * | 2008-06-27 | 2012-07-31 | Palo Alto Research Center Incorporated | System and method for finding stable keypoints in a picture image using localized scale space properties |
| CN102186406B (en) * | 2008-10-15 | 2014-10-22 | 欧普蒂布兰德有限责任公司 | Method and apparatus for obtaining an image of an ocular feature |
| US8488863B2 (en) * | 2008-11-06 | 2013-07-16 | Los Alamos National Security, Llc | Combinational pixel-by-pixel and object-level classifying, segmenting, and agglomerating in performing quantitative image analysis that distinguishes between healthy non-cancerous and cancerous cell nuclei and delineates nuclear, cytoplasm, and stromal material objects from stained biological tissue materials |
| JP4909377B2 (en) * | 2009-06-02 | 2012-04-04 | キヤノン株式会社 | Image processing apparatus, control method therefor, and computer program |
| US20110081087A1 (en) * | 2009-10-02 | 2011-04-07 | Moore Darnell J | Fast Hysteresis Thresholding in Canny Edge Detection |
| JP5733962B2 (en) * | 2010-02-17 | 2015-06-10 | キヤノン株式会社 | Ophthalmologic apparatus, ophthalmologic apparatus control method, and program |
| US9311556B2 (en) * | 2010-05-19 | 2016-04-12 | Plf Agritech Pty Ltd | Image analysis for making animal measurements including 3-D image analysis |
| CA2743937A1 (en) * | 2010-06-22 | 2011-12-22 | Queen's University At Kingston | C-arm pose estimation using intensity-based registration of imaging modalities |
| GB2487375B (en) * | 2011-01-18 | 2017-09-20 | Aptina Imaging Corp | Interest point detection |
| KR101165357B1 (en) * | 2011-02-14 | 2012-07-18 | (주)엔써즈 | Apparatus and method for generating image feature data |
| CN103458772B (en) * | 2011-04-07 | 2017-10-31 | 香港中文大学 | Retinal images analysis method and device |
| US8675997B2 (en) * | 2011-07-29 | 2014-03-18 | Hewlett-Packard Development Company, L.P. | Feature based image registration |
| JP6226510B2 (en) * | 2012-01-27 | 2017-11-08 | キヤノン株式会社 | Image processing system, processing method, and program |
| JP6105852B2 (en) * | 2012-04-04 | 2017-03-29 | キヤノン株式会社 | Image processing apparatus and method, and program |
| EP2677464B1 (en) * | 2012-05-16 | 2018-05-02 | IMEC vzw | Feature detection in numeric data |
| WO2014074178A1 (en) * | 2012-11-08 | 2014-05-15 | The Johns Hopkins University | System and method for detecting and classifying severity of retinal disease |
| US9092849B2 (en) * | 2013-06-28 | 2015-07-28 | International Business Machines Corporation | Bidirectional blood vessel segmentation |
| US8885901B1 (en) * | 2013-10-22 | 2014-11-11 | Eyenuk, Inc. | Systems and methods for automated enhancement of retinal images |
-
2014
- 2014-04-30 US US14/266,688 patent/US8885901B1/en active Active
- 2014-04-30 US US14/266,746 patent/US9002085B1/en active Active
- 2014-04-30 US US14/266,749 patent/US8879813B1/en active Active
- 2014-04-30 US US14/266,753 patent/US9008391B1/en active Active
- 2014-04-30 EP EP21202769.2A patent/EP4057215A1/en active Pending
- 2014-04-30 EP EP14855521.2A patent/EP3061063A4/en not_active Withdrawn
- 2014-04-30 WO PCT/US2014/036250 patent/WO2015060897A1/en active Application Filing
- 2014-09-29 US US14/500,929 patent/US20150110348A1/en not_active Abandoned
- 2014-10-06 US US14/507,777 patent/US20150110370A1/en not_active Abandoned
-
2016
- 2016-08-16 US US15/238,674 patent/US20170039412A1/en not_active Abandoned
- 2016-08-19 US US15/242,303 patent/US20170039689A1/en not_active Abandoned
-
2018
- 2018-07-18 US US16/039,268 patent/US20190042828A1/en not_active Abandoned
-
2019
- 2019-12-31 US US16/731,837 patent/US20200257879A1/en not_active Abandoned
-
2020
- 2020-12-14 US US17/121,739 patent/US20210350110A1/en not_active Abandoned
-
2022
- 2022-06-10 US US17/838,103 patent/US20230036134A1/en not_active Abandoned
Patent Citations (71)
| Publication number | Priority date | Publication date | Assignee | Title |
|---|---|---|---|---|
| US4584605A (en) * | 1983-11-02 | 1986-04-22 | Gte Communication Systems Corporation | Digital hysteresis for video measurement and processing system |
| US5079698A (en) * | 1989-05-03 | 1992-01-07 | Advanced Light Imaging Technologies Ltd. | Transillumination method apparatus for the diagnosis of breast tumors and other breast lesions by normalization of an electronic image of the breast |
| US5878746A (en) | 1993-08-25 | 1999-03-09 | Lemelson; Jerome H. | Computerized medical diagnostic system |
| US5835618A (en) * | 1996-09-27 | 1998-11-10 | Siemens Corporate Research, Inc. | Uniform and non-uniform dynamic range remapping for optimum image display |
| US6226393B1 (en) * | 1997-07-04 | 2001-05-01 | Torsana Osteoporosis Diagnostics A/S | Method for estimating the bone quality or skeletal status of a vertebrate |
| US6088473A (en) * | 1998-02-23 | 2000-07-11 | Arch Development Corporation | Method and computer readable medium for automated analysis of chest radiograph images using histograms of edge gradients for false positive reduction in lung nodule detection |
| US6671419B1 (en) * | 1999-07-02 | 2003-12-30 | Intel Corporation | Method for reducing shadows and/or noise in a digital image |
| US6454410B1 (en) | 1999-10-20 | 2002-09-24 | The Trustees Of The University Of Pennsylvania | Mosaicing and enhancement of images for ophthalmic diagnosis and documentation |
| US20040126008A1 (en) * | 2000-04-24 | 2004-07-01 | Eric Chapoulaud | Analyte recognition for urinalysis diagnostic system |
| WO2001087145A2 (en) | 2000-05-18 | 2001-11-22 | Michael David Abramoff | Screening system for inspecting a patient's retina |
| WO2002015818A2 (en) | 2000-08-23 | 2002-02-28 | Philadelphia Ophthalmologic Imaging Systems, Inc. | System and method for tele-ophthalmology |
| US7522745B2 (en) | 2000-08-31 | 2009-04-21 | Grasso Donald P | Sensor and imaging system |
| US20020141626A1 (en) | 2000-11-22 | 2002-10-03 | Anat Caspi | Automated registration of 3-D medical scans of similar anatomical structures |
| EP1427338A2 (en) | 2001-08-30 | 2004-06-16 | Philadelphia Opthalmologic Imaging Systems, Inc. | System and method for screening patients for diabetic retinopathy |
| WO2003020112A2 (en) | 2001-08-30 | 2003-03-13 | Philadelphia Ophthalmic Imaging Systems | System and method for screening patients for diabetic retinopathy |
| WO2003030073A1 (en) | 2001-10-03 | 2003-04-10 | Retinalyze Danmark A/S | Quality measure |
| US20030174872A1 (en) | 2001-10-15 | 2003-09-18 | Insightful Corporation | System and method for mining quantitive information from medical images |
| US7162073B1 (en) * | 2001-11-30 | 2007-01-09 | Cognex Technology And Investment Corporation | Methods and apparatuses for detecting classifying and measuring spot defects in an image of an object |
| US20040064057A1 (en) | 2002-07-31 | 2004-04-01 | Massachusetts Institute Of Technology | Measuring circulating blood volume through retinal vasculometry |
| US20040105074A1 (en) | 2002-08-02 | 2004-06-03 | Peter Soliz | Digital stereo image analyzer for automated analyses of human retinopathy |
| US20040062429A1 (en) * | 2002-09-27 | 2004-04-01 | Kaufhold John Patrick | Method and apparatus for enhancing an image |
| US8320641B2 (en) * | 2004-10-28 | 2012-11-27 | DigitalOptics Corporation Europe Limited | Method and apparatus for red-eye detection using preview or other reference images |
| US20060093212A1 (en) * | 2004-10-28 | 2006-05-04 | Eran Steinberg | Method and apparatus for red-eye detection in an acquired digital image |
| US20120140175A1 (en) | 2005-01-21 | 2012-06-07 | Carl Zeiss Meditec, Inc. | Method of motion correction in optical coherence tomography imaging |
| US20060257031A1 (en) * | 2005-03-31 | 2006-11-16 | Michael Abramoff | Automatic detection of red lesions in digital color fundus photographs |
| US7474775B2 (en) * | 2005-03-31 | 2009-01-06 | University Of Iowa Research Foundation | Automatic detection of red lesions in digital color fundus photographs |
| US8098907B2 (en) * | 2005-07-01 | 2012-01-17 | Siemens Corporation | Method and system for local adaptive detection of microaneurysms in digital fundus images |
| US20070002275A1 (en) * | 2005-07-01 | 2007-01-04 | Siemens Corporate Research Inc. | Method and System For Local Adaptive Detection Of Microaneurysms In Digital Fundus Images |
| US20070109499A1 (en) * | 2005-10-12 | 2007-05-17 | Siemens Corporate Research Inc | System and Method For Robust Optic Disk Detection In Retinal Images Using Vessel Structure And Radon Transform |
| US7524061B2 (en) * | 2005-10-12 | 2009-04-28 | Siemens Corporate Research, Inc. | System and method for robust optic disk detection in retinal images using vessel structure and radon transform |
| US20070211928A1 (en) * | 2005-11-10 | 2007-09-13 | Rosetta Inpharmatics Llc | Discover biological features using composite images |
| US20070127795A1 (en) | 2005-11-23 | 2007-06-07 | Lau Denny W | System and method for linking current and previous images based on anatomy |
| US20070258630A1 (en) | 2006-05-03 | 2007-11-08 | Tobin Kenneth W | Method and system for the diagnosis of disease using retinal image content and an archive of diagnosed human patient data |
| US7782464B2 (en) | 2006-05-12 | 2010-08-24 | The General Hospital Corporation | Processes, arrangements and systems for providing a fiber layer thickness map based on optical coherence tomography images |
| US20080031521A1 (en) * | 2006-08-07 | 2008-02-07 | General Electric Company | Automated segmentation of image structures |
| CN101589301B (en) | 2006-08-25 | 2012-11-07 | 通用医疗公司 | Apparatus and methods for enhancing optical coherence tomography imaging using volumetric filtering techniques |
| US20080298723A1 (en) * | 2006-10-31 | 2008-12-04 | Brother Kogyo Kabushiki Kaisha | Image processing device |
| US8340437B2 (en) | 2007-05-29 | 2012-12-25 | University Of Iowa Research Foundation | Methods and systems for determining optimal features for classifying patterns or objects in images |
| US20100249532A1 (en) | 2007-11-09 | 2010-09-30 | Teddy Lee Maddess | Method and Apparatus for Sensory Field Assessment |
| US8520916B2 (en) * | 2007-11-20 | 2013-08-27 | Carestream Health, Inc. | Enhancement of region of interest of radiological image |
| US20090226063A1 (en) * | 2008-03-06 | 2009-09-10 | Rangwala Hussain S | Image enhancement and application functionality for medical and other uses |
| US8687862B2 (en) | 2008-04-08 | 2014-04-01 | National University Of Singapore | Retinal image analysis systems and methods |
| US20100061601A1 (en) * | 2008-04-25 | 2010-03-11 | Michael Abramoff | Optimal registration of multiple deformed images using a physical model of the imaging distortion |
| US20090274358A1 (en) * | 2008-04-30 | 2009-11-05 | Thomas Flohr | Method and tomography scanner for normalizing image data with respect to a contrast in the image data produced by a contrast agent |
| US20090279772A1 (en) * | 2008-05-12 | 2009-11-12 | General Electric Company | Method and System for Identifying Defects in NDT Image Data |
| US20090323022A1 (en) | 2008-06-26 | 2009-12-31 | Canon Kabushiki Kaisha | Medical imaging apparatus |
| US8515201B1 (en) | 2008-09-18 | 2013-08-20 | Stc.Unm | System and methods of amplitude-modulation frequency-modulation (AM-FM) demodulation for image and video processing |
| US20100142766A1 (en) * | 2008-12-04 | 2010-06-10 | Alan Duncan Fleming | Image Analysis |
| US20120123232A1 (en) | 2008-12-16 | 2012-05-17 | Kayvan Najarian | Method and apparatus for determining heart rate variability using wavelet transformation |
| US20110242306A1 (en) * | 2008-12-19 | 2011-10-06 | The Johns Hopkins University | System and method for automated detection of age related macular degeneration and other retinal abnormalities |
| US20120150029A1 (en) | 2008-12-19 | 2012-06-14 | University Of Miami | System and Method for Detection and Monitoring of Ocular Diseases and Disorders using Optical Coherence Tomography |
| GB2467840A (en) | 2009-02-12 | 2010-08-18 | Univ Aberdeen | Detecting disease in retinal images |
| US20120027275A1 (en) * | 2009-02-12 | 2012-02-02 | Alan Duncan Fleming | Disease determination |
| GB2470727A (en) | 2009-06-02 | 2010-12-08 | Univ Aberdeen | Processing retinal images using mask data from reference images |
| US20120177262A1 (en) | 2009-08-28 | 2012-07-12 | Centre For Eye Research Australia | Feature Detection And Measurement In Retinal Images |
| WO2011066366A1 (en) | 2009-11-24 | 2011-06-03 | Bioptigen, Inc. | Methods, systems and computer program products for diagnosing conditions using unique codes generated from a multidimensional image of a sample |
| US20110160562A1 (en) | 2009-12-02 | 2011-06-30 | De Oliveira E Ramos Joao Diogo | Methods and Systems for Detection of Retinal Changes |
| US8041091B2 (en) | 2009-12-02 | 2011-10-18 | Critical Health, Sa | Methods and systems for detection of retinal changes |
| US7856135B1 (en) | 2009-12-02 | 2010-12-21 | Aibili—Association for Innovation and Biomedical Research on Light and Image | System for analyzing ocular fundus images |
| US20110182517A1 (en) | 2010-01-20 | 2011-07-28 | Duke University | Segmentation and identification of layered structures in images |
| CA2797725A1 (en) | 2010-04-29 | 2011-11-10 | Massachusetts Institute Of Technology | Method and apparatus for motion correction and image enhancement for optical coherence tomography |
| US20110285911A1 (en) * | 2010-05-21 | 2011-11-24 | Vixs Systems, Inc. | Contrast control device and method therefor |
| US20110285913A1 (en) * | 2010-05-21 | 2011-11-24 | Astrachan Paul M | Enhanced histogram equalization |
| US20110317935A1 (en) * | 2010-06-25 | 2011-12-29 | Fujitsu Limited | Image processing device, method thereof, and a computer readable non transitory storage medium storing an image processing program |
| US20130230230A1 (en) * | 2010-07-30 | 2013-09-05 | Fundação D. Anna Sommer Champalimaud e Dr. Carlos Montez Champalimaud | Systems and methods for segmentation and processing of tissue images and feature extraction from same for treating, diagnosing, or predicting medical conditions |
| US20120184845A1 (en) | 2010-11-11 | 2012-07-19 | University Of Pittsburgh - Of The Commonwealth System Of Higher Education | Automated macular pathology diagnosis in threedimensional (3d) spectral domain optical coherence tomography (sd-oct) images |
| US20120236259A1 (en) | 2011-01-20 | 2012-09-20 | Abramoff Michael D | Automated determination of arteriovenous ratio in images of blood vessels |
| US8355544B2 (en) | 2011-02-01 | 2013-01-15 | Universidade Da Coruna-Otri | Method, apparatus, and system for automatic retinal image analysis |
| US20120249959A1 (en) | 2011-03-31 | 2012-10-04 | The Hong Kong Polytechnic University | Apparatus and method for non-invasive diabetic retinopathy detection and monitoring |
| WO2012149687A1 (en) | 2011-05-05 | 2012-11-08 | 中国科学院自动化研究所 | Method for retinal vessel extraction |
| US20130321764A1 (en) * | 2012-05-30 | 2013-12-05 | National University Of Ireland, Galway | Systems and methods for imaging the fundus of the eye |
Non-Patent Citations (72)
| Title |
|---|
| "Automated Detection of Red Lesions from Digital Colour Fundus Photographs," Jaafar et al., 33rd Annual International Conference of the IEEE EMBS Boston, Massachusetts USA, Aug. 30-Sep. 3, 2011, pp. 6232-6235. * |
| "Diabetic Retinopathy Dark Lesion Detection: Preprocessing Phase," Poostchi et al, 2011 1st International eConference on Computer and Knowledge Engineering (ICCKE), Oct. 13-14, 2011, pp. 177-182. * |
| "Observation Model Based Retinal Fundus Image Normalization and Enhancement," Yi et al, 2011 4th International Congress on Image and Signal Processing, 2011, pp. 719-723. * |
| Abdi et al., "Principal component analysis." Wiley Interdisciplinary Reviews: Computational Statistics, 2(4):433459, 1-47, 2010. |
| Abràmoff et al., "Evaluation of a system for automatic detection of diabetic retinopathy from color fundus photographs in a large population of patients with diabetes." Diabetes Care, 31(2), 193-198, Feb. 2008. |
| Aibinu et al., Vascular intersection detection in retina fundus images using a new hybrid approach. Elsevier Computers and Biology and Medicine, 1-34, Nov. 2009. |
| Ausayakhun et al., "Accuracy and reliability of telemedicine for diagnosis of cytomegalovirus retinitis." American Journal of Ophthalmology, 152(6):1053-1058.e1, Dec. 2011. |
| Ausayakhun et al., "Clinical features of newly diagnosed cytomegalovirus retinitis in northern Thailand." American Journal of Ophthalmology, 153(5):923-931.e1, May 2012. |
| Barriga et al., "Automatic system for diabetic retinopathy screening based on AM-FM, partial least squares, and support vector machines.", In 2010 IEEE International Symposium on Biomedical Imaging: From Nano to Macro, pp. 1349-1352, 2010. |
| Belongie et al., Shape matching and object recognition using shape contexts. IEEE Trans. Pattern Analysis and Machine Intelligence (PAMI), 24(4):509-522, Apr. 2005. |
| Berisha et al.,"Retinal Abnormalities in Early Alzheimer's Disease," Investigative Ophthalmology & Visual Science 48, No. 5 (May 1, 2007): 2285-2289. |
| Can et al. "A feature-based technique for joint, linear estimation of high-order image-to-mosaic transformations: mosaicing the curved human retina." IEEE Transactions on Pattern Analysis and Machine Intelligence, 24(3):412-419, 2002. |
| Can et al., "A feature-based, robust, hierarchical algorithm for registering pairs of images of the curved human retina." IEEE Transactions on Pattern Analysis and Machine Intelligence, 24(3):347-364, 2002. |
| Canny, "A computational approach to edge detection." IEEE Transactions on Pattern Analysis and Machine Intelligence, vol. 8, Issue 6 pp. 679-698, 1986. |
| Chum et al., "Randomized RANSAC with td, d test." In Proc. British Machine Vision Conference, vol. 2, pp. 448-457, 2002. |
| Chum et al., Matching with PROSAC-progressive sample consensus. In Computer Vision and Pat-tern Recognition, 2005. CVPR 2005. IEEE Computer Society Conference on, vol. 1, pp. 220-226, 2005. |
| Ciresan et al., "Multi-column deep neural networks for image classification." arXiv e-print 1202.2745, Feb. 2012. CVPR 2012, p. 3642-3649. |
| Diabetes Control and Complications Trial Research Group. Progression of retinopathy with intensive versus conventional treatment in the diabetes control and complications trial. Ophthalmology, PMID:7724182, 102(4):647-661, Apr. 1995. |
| Drucker et al., "Support vector regression machines." Advances in neural information processing systems, pp. 155-161, 1997. |
| Dzeroski et al., "Is combining classifiers better than selecting the best one." In Machine Learning, p. 255273. Morgan Kaufmann, 2004. |
| Frangi et al., "Multiscale vessel enhancement filtering in Medical Image Computing and Computer-Assisted Intervention." MICCAI98, pp. 130-137. Springer, 1998. |
| Giancardo et al., Quality assessment of retinal fundus images using elliptical local vessel density. New Developments in Biomedical Engineering, Ed. Domenico Campolo, INTECH. http://sciyo.com/books/show/title/new-developments-in-biomedical-engineering, 201-224, 2010. |
| Hamman et al., "Prevalence and risk factors of diabetic retinopathy in non-hispanic whites and hispanics with NIDDM": san luis valley diabetes study. Diabetes, 38(10):1231-1237, 1989. |
| Harris et al., "Is the Risk of Diabetic Retinopathy Greater in Non-Hispanic Blacks and Mexican Americans Than in Non-Hispanic Whites With Type 2 Diabetes?": A US population study. Diabetes Care, 21(8):1230-1235, 1998. |
| Hart et al., "Measurement and classification of retinal vascular tortuosity." International Journal of Medical Informatics, 53(23):239-252, Feb. 1999. |
| Hartley et al., "Multiple view geometry in computer vision", vol. 2. Cambridge University Press, 2000. |
| Hashimoto et al., "Referenceless image quality evaluation for whole slide imaging." Journal of pathology informatics, 3:9, 2012. PMID: 22530177. |
| Hoover et al., "Locating blood vessels in retinal images by piecewise threshold probing of a matched filter response." IEEE Transactions on Medical Imaging, 19(3):203-210, 2000. |
| Hubbard et al., "Methods for evaluation of retinal microvascular abnormalities associated with hypertension/sclerosis in the atherosclerosis risk in communities study." Ophthalmology, 106(12):2269-2280,Dec. 1999. PMID: 10599656. |
| Jarrett et al., "What is the best multi-stage architecture for object recognition? In Computer Vision", 2009 IEEE 12th International Conference on, p. 2146-2153, 2009. |
| Karnowski et al., Retina lesion and microaneurysm segmentation using morphological reconstruction methods with groundtruth data. In 30th Annual International Conference of the IEEE Engineering in Medicine and Biology Society, pp. 5433-5436, Aug. 2008. |
| Kauppi et al., Diaretdb1 diabetic retinopathy database and evaluation protocol. In 11th Conference on Medical Image Understanding and Analysis, 2007. |
| Knudtson et al., "Revised formulas for summarizing retinal vessel diameters." Current eye research, 27(3):143-149, Sep. 2003. PMID: 14562179. |
| Kodovsky et al., "Ensemble classifiers for steganalysis of digital media." Information Forensics and Security, IEEE Transactions on, 7(2):432444, 2012. |
| Lalonde et al., "Fast and robust optic disc detection using pyramidal decomposition and Hausdorff-based template matching." IEEE Transactions on Medical Imaging, 20(11):1193-1200, 2001. |
| Lowe et al., Distinctive image features from scale-invariant keypoints. International Journal of Computer Vision, 60(2):91-110, 2004. |
| Ma et al., Netra: A toolbox for navigating large image databases. In IEEE International Conference on Image Processing, vol. 1, pp. 568-571, Oct. 1997. |
| MacQueen, James "Some methods for classification and analysis of multivariate observations." In Proceedings of the fifth Berkeley symposium on mathematical statistics and probability, vol. 1, pp. 281-297, 1967. |
| Manjunath et al., "Texture features for browsing and retrieval of image data." IEEE Trans. Pattern Analysis and Machine Intelligence (Special issue on Digital Libraries), 18(8):837-842, Aug. 1996. |
| Manning et al., "Introduction to information retrieval", vol. 1. Cambridge University Press Cambridge, 2008. |
| Márquez-Neila et al., "Speeding-up homography estimation in mobile devices." Journal of Real-Time Image Processing, Jan. 2013. |
| Merz, Christopher, "Using correspondence analysis to combine classifiers." Machine Learning, 36(1-2):33-58, Jul. 1999. |
| Mo, Lingfei, et al., "Multi-sensor ensemble classifier for activity recognition." A Journal of Software Engineering and Applications,5:113-116, 2012. |
| Moreira-Matias et al., "Text categorization using an ensemble classifier based on a mean co-association matrix." In Machine Learning and Data Mining in Pattern Recognition, p. 525-539. Springer, 2012. |
| Nayar et al., "Shape from focus". IEEE Transactions on Pattern Analysis and Machine Intelligence, 16(8):824-831, 1994. |
| Niemeijer et al., Automated detection and differentiation of drusen, exudates, and cotton-wool spots in digital color fundus photographs for diabetic retinopathy diagnosis. Invest Ophthalmol Vis Sci, 48(5):2260-2267, May 2007. |
| Niemeijer et al., Information fusion for diabetic retinopathy cad in digital color fundus photographs. IEEE Transactions on Medical Imaging, 28(5):775-785, May 2009. |
| Olson et al., Evaluation of a system for automatic detection of diabetic retinopathy from color fundus photographs in a large population of patients with diabetes: response to Abramoff et al. Diabetes Care, 31(8), Aug. 2008. |
| Polikar R., "Ensemble based systems in decision making." IEEE Circuits and Systems Magazine, 6(3):21-45, 2006. |
| Quellec et al., "A multiple-instance learning framework for diabetic retinopathy screening." Medical Image Analysis, 16(6):1228-1240, Aug. 2012. |
| Rokach Lior, "Ensemble-based classifiers". Artificial Intelligence Review, 33(1-2):1-39, Feb. 2010. |
| Sanchez et al., "Evaluation of a computer-aided diagnosis system for diabetic retinopathy screening on public data." Investigative Ophthalmology & Visual Science, 52(7):4866-4871, Apr. 2011. |
| Scotland et al., Costs and consequences of automated algorithms versus manual grading for the detection of referable diabetic retinopathy. Br J Ophthalmol., Dec. 2009. |
| Sethian, J.A., "A fast marching level set method for monotonically advancing fronts." Proceedings of the National Academy of Sciences, 93(4):1591-1595, 1996. |
| Sill et al., "Feature-weighted linear stacking." arXiv e-print 0911.0460, Nov. 2009. |
| Sivic et al., Video google: a text retrieval approach to object matching in videos. In 9th IEEE International Conference on Computer Vision, pp. 1470-1477, 2003. |
| Smola et al., "A tutorial on support vector regression," Statistics and Computing, 14(3):199-222, 2004. |
| Staal et al., "Ridge-based vessel segmentation in color images of the retina." IEEE transactions on medical imaging, 23(4):501-509, Apr. 2004. PMID:15084075. |
| Ting et al., Issues in stacked generalization. Journal of Artificial Intelligence Research,10:271-289, 1999. |
| Tobin et al., "Using a patient image archive to diagnose retinopathy". In 30th Annual International Conference of the IEEE Engineering in Medicine and Biology Society, pp. 5441-5444, Aug. 2008. |
| Tomasi et al., Bilateral filtering for gray and color images. In Computer Vision, 1998. Sixth International Conference on, p. 839846, 1998. |
| Torr et al., "MLESAC: a new robust estimator with application to estimating image geometry." Computer Vision and Image Understanding, 78(1):138-156, 2000. |
| Varma et al., "Prevalence of Diabetic Retinopathy in Adult Latinos: The Los Angeles Latino Eye Study." Ophthalmology, 111(7):1298-1306, Jul. 2004. PMID: 15234129. |
| Weiss, Ben., "Fast Median and Bilateral Filtering," in ACM Transactions on Graphics (TOG), vol. 25, 2006, 519-526. |
| Whiting et al., IDF Diabetes Atlas: Global estimates of the prevalence of diabetes for 2011 and 2030. Diabetes research and clinical practice, 94(3):311-321, Dec. 2011. PMID: 22079683. |
| Wild et al., Global prevalence of diabetes estimates for the year 2000 and projections for 2030. Diabetes Care, 27(5):1047-1053, May 2004. PMID: 15111519. |
| Wolpert, David, Stacked generalization. Neural Networks, 5:241259, 1992. |
| Wong et al., "Cerebral White Matter Lesion, Retinopathy and Risk of Clinical Stroke: The Atherosclerosis Risk in the Communities Study". JAMA 2002;288:67-74, Jul. 2002. |
| Wong et al., "Retinopathy and risk of congestive heart failure". JAMA 2005; 293:63-69, Jan. 2005. |
| Zeiler et al., On rectified linear units for speech processing. 2013. |
| Zhang Harry, The optimality of naive bayes. A A, 1(2):3, 2004. |
| Zuliani, Marco., "RANSAC for dummies." Vision Research Lab, University of California, Santa Barbara, 2009. |
Cited By (20)
| Publication number | Priority date | Publication date | Assignee | Title |
|---|---|---|---|---|
| US20150110370A1 (en) * | 2013-10-22 | 2015-04-23 | Eyenuk, Inc. | Systems and methods for enhancement of retinal images |
| US20160063695A1 (en) * | 2014-08-29 | 2016-03-03 | Samsung Medison Co., Ltd. | Ultrasound image display apparatus and method of displaying ultrasound image |
| CN105069803A (en) * | 2015-08-19 | 2015-11-18 | 西安交通大学 | Classifier for micro-angioma of diabetes lesion based on colored image |
| US20170154415A1 (en) * | 2015-11-30 | 2017-06-01 | Disney Enterprises, Inc. | Saliency-weighted video quality assessment |
| US9922411B2 (en) * | 2015-11-30 | 2018-03-20 | Disney Enterprises, Inc. | Saliency-weighted video quality assessment |
| US10699396B2 (en) * | 2015-11-30 | 2020-06-30 | Disney Enterprises, Inc. | Saliency-weighted video quality assessment |
| US11205103B2 (en) | 2016-12-09 | 2021-12-21 | The Research Foundation for the State University | Semisupervised autoencoder for sentiment analysis |
| WO2018200840A1 (en) | 2017-04-27 | 2018-11-01 | Retinopathy Answer Limited | System and method for automated funduscopic image analysis |
| US10719936B2 (en) | 2017-04-27 | 2020-07-21 | Retinascan Limited | System and method for automated funduscopic image analysis |
| US20230359910A1 (en) * | 2017-08-30 | 2023-11-09 | P Tech, Llc | Artificial intelligence and/or virtual reality for activity optimization/personalization |
| US10896762B2 (en) * | 2017-11-08 | 2021-01-19 | International Business Machines Corporation | 3D web-based annotation |
| US10886029B2 (en) | 2017-11-08 | 2021-01-05 | International Business Machines Corporation | 3D web-based annotation |
| US11894125B2 (en) | 2018-10-17 | 2024-02-06 | Google Llc | Processing fundus camera images using machine learning models trained using other modalities |
| CN109447935A (en) * | 2018-11-16 | 2019-03-08 | 哈工大机器人(山东)智能装备研究院 | Infrared Image Processing Method, device, computer equipment and readable storage medium storing program for executing |
| US11024013B2 (en) | 2019-03-08 | 2021-06-01 | International Business Machines Corporation | Neural network based enhancement of intensity images |
| WO2021188463A1 (en) * | 2020-03-19 | 2021-09-23 | Digital Diagnostics Inc. | Image retention and stitching for minimal-flash eye disease diagnosis |
| US11880976B2 (en) | 2020-03-19 | 2024-01-23 | Digital Diagnostics Inc. | Image retention and stitching for minimal-flash eye disease diagnosis |
| WO2021243246A1 (en) * | 2020-05-29 | 2021-12-02 | University Of Florida Research Foundation | A machine learning system and method for predicting alzheimer's disease based on retinal fundus images |
| CN112750074A (en) * | 2021-04-06 | 2021-05-04 | 南京智莲森信息技术有限公司 | Small sample image feature enhancement method and system and image classification method and system |
| CN112750074B (en) * | 2021-04-06 | 2021-07-02 | 南京智莲森信息技术有限公司 | Small sample image feature enhancement method and system and image classification method and system |
Also Published As
| Publication number | Publication date |
|---|---|
| US20230036134A1 (en) | 2023-02-02 |
| EP3061063A4 (en) | 2017-10-11 |
| US20150110368A1 (en) | 2015-04-23 |
| EP3061063A1 (en) | 2016-08-31 |
| US20170039412A1 (en) | 2017-02-09 |
| US20190042828A1 (en) | 2019-02-07 |
| US20200257879A1 (en) | 2020-08-13 |
| EP4057215A1 (en) | 2022-09-14 |
| WO2015060897A1 (en) | 2015-04-30 |
| US20150110348A1 (en) | 2015-04-23 |
| US20150110372A1 (en) | 2015-04-23 |
| US9002085B1 (en) | 2015-04-07 |
| US9008391B1 (en) | 2015-04-14 |
| US20170039689A1 (en) | 2017-02-09 |
| US20210350110A1 (en) | 2021-11-11 |
| US8879813B1 (en) | 2014-11-04 |
| US20150110370A1 (en) | 2015-04-23 |
Similar Documents
| Publication | Publication Date | Title |
|---|---|---|
| US20230036134A1 (en) | Systems and methods for automated processing of retinal images | |
| Das et al. | A critical review on diagnosis of diabetic retinopathy using machine learning and deep learning | |
| Tang et al. | Splat feature classification with application to retinal hemorrhage detection in fundus images | |
| Zhu et al. | Detection of the optic nerve head in fundus images of the retina using the hough transform for circles | |
| JP2020518915A (en) | System and method for automated fundus image analysis | |
| Mayya et al. | Automated microaneurysms detection for early diagnosis of diabetic retinopathy: A Comprehensive review | |
| WO2012078636A1 (en) | Optimal, user-friendly, object background separation | |
| Valizadeh et al. | Presentation of a segmentation method for a diabetic retinopathy patient’s fundus region detection using a convolutional neural network | |
| Tavakoli et al. | Automated microaneurysms detection in retinal images using radon transform and supervised learning: application to mass screening of diabetic retinopathy | |
| Xiao et al. | Major automatic diabetic retinopathy screening systems and related core algorithms: a review | |
| Ramachandran et al. | A deep learning framework for the detection of Plus disease in retinal fundus images of preterm infants | |
| Mrad et al. | A fast and accurate method for glaucoma screening from smartphone-captured fundus images | |
| Mathews et al. | A comprehensive review on automated systems for severity grading of diabetic retinopathy and macular edema | |
| Karkuzhali et al. | Robust intensity variation and inverse surface adaptive thresholding techniques for detection of optic disc and exudates in retinal fundus images | |
| Zubair et al. | A comprehensive computer-aided system for an early-stage diagnosis and classification of diabetic macular edema | |
| Jana et al. | A semi-supervised approach for automatic detection and segmentation of optic disc from retinal fundus image | |
| Kumar et al. | Deep Learning-assisted Retinopathy of Prematurity (ROP) Screening | |
| Akbar et al. | A Novel Filtered Segmentation-Based Bayesian Deep Neural Network Framework on Large Diabetic Retinopathy Databases. | |
| Rivas-Villar et al. | Joint keypoint detection and description network for color fundus image registration | |
| Chalakkal | Automatic Retinal Image Analysis to Triage Retinal Pathologies | |
| Basreddy et al. | Preprocessing, Feature Extraction, and Classification Methodologies on Diabetic Retinopathy Using Fundus Images | |
| Valizadeh et al. | Research Article Presentation of a Segmentation Method for a Diabetic Retinopathy Patient’s Fundus Region Detection Using a Convolutional Neural Network | |
| Krishna et al. | Convolutional Neural Networks for Automated Diagnosis of Diabetic Retinopathy in Fundus Images | |
| Zhao | Computer-aided diagnosis of colour retinal imaging | |
| Sharma et al. | A comprehensive study of optic disc detection in artefact retinal images using a deep regression neural network for a fused distance-intensity map |
Legal Events
| Date | Code | Title | Description |
|---|---|---|---|
| AS | Assignment |
Owner name: EYENUK, INC., CALIFORNIA Free format text: ASSIGNMENT OF ASSIGNORS INTEREST;ASSIGNOR:SOLANKI, KAUSHAL MOHANLAL;REEL/FRAME:033001/0595 Effective date: 20140527 |
|
| AS | Assignment |
Owner name: EYENUK, INC., CALIFORNIA Free format text: ASSIGNMENT OF ASSIGNORS INTEREST;ASSIGNOR:BHAT KRUPAKAR, SANDEEP;REEL/FRAME:033043/0150 Effective date: 20140527 Owner name: EYENUK, INC., CALIFORNIA Free format text: ASSIGNMENT OF ASSIGNORS INTEREST;ASSIGNOR:AMAI RAMACHANDRA, CHAITHANYA;REEL/FRAME:033042/0558 Effective date: 20140527 |
|
| STCF | Information on status: patent grant |
Free format text: PATENTED CASE |
|
| MAFP | Maintenance fee payment |
Free format text: PAYMENT OF MAINTENANCE FEE, 4TH YR, SMALL ENTITY (ORIGINAL EVENT CODE: M2551) Year of fee payment: 4 |
|
| MAFP | Maintenance fee payment |
Free format text: PAYMENT OF MAINTENANCE FEE, 8TH YR, SMALL ENTITY (ORIGINAL EVENT CODE: M2552); ENTITY STATUS OF PATENT OWNER: SMALL ENTITY Year of fee payment: 8 |