US8768745B2 - System and method of forecasting print job related demand - Google Patents

System and method of forecasting print job related demand Download PDF

Info

Publication number
US8768745B2
US8768745B2 US12/183,154 US18315408A US8768745B2 US 8768745 B2 US8768745 B2 US 8768745B2 US 18315408 A US18315408 A US 18315408A US 8768745 B2 US8768745 B2 US 8768745B2
Authority
US
United States
Prior art keywords
print
forecast model
forecast
time series
data
Prior art date
Legal status (The legal status is an assumption and is not a legal conclusion. Google has not performed a legal analysis and makes no representation as to the accuracy of the status listed.)
Expired - Fee Related, expires
Application number
US12/183,154
Other versions
US20100030617A1 (en
Inventor
John C Handley
Current Assignee (The listed assignees may be inaccurate. Google has not performed a legal analysis and makes no representation or warranty as to the accuracy of the list.)
Xerox Corp
Original Assignee
Xerox Corp
Priority date (The priority date is an assumption and is not a legal conclusion. Google has not performed a legal analysis and makes no representation as to the accuracy of the date listed.)
Filing date
Publication date
Application filed by Xerox Corp filed Critical Xerox Corp
Priority to US12/183,154 priority Critical patent/US8768745B2/en
Assigned to XEROX CORPORATION reassignment XEROX CORPORATION ASSIGNMENT OF ASSIGNORS INTEREST (SEE DOCUMENT FOR DETAILS). Assignors: HANDLEY, JOHN C, ,
Publication of US20100030617A1 publication Critical patent/US20100030617A1/en
Application granted granted Critical
Publication of US8768745B2 publication Critical patent/US8768745B2/en
Expired - Fee Related legal-status Critical Current
Adjusted expiration legal-status Critical

Links

Images

Classifications

    • GPHYSICS
    • G06COMPUTING; CALCULATING OR COUNTING
    • G06QINFORMATION AND COMMUNICATION TECHNOLOGY [ICT] SPECIALLY ADAPTED FOR ADMINISTRATIVE, COMMERCIAL, FINANCIAL, MANAGERIAL OR SUPERVISORY PURPOSES; SYSTEMS OR METHODS SPECIALLY ADAPTED FOR ADMINISTRATIVE, COMMERCIAL, FINANCIAL, MANAGERIAL OR SUPERVISORY PURPOSES, NOT OTHERWISE PROVIDED FOR
    • G06Q10/00Administration; Management
    • G06Q10/06Resources, workflows, human or project management; Enterprise or organisation planning; Enterprise or organisation modelling

Definitions

  • the disclosed embodiments relate generally to a system and method for improving the operability of a print production environment and, more particularly to an improved approach for forecasting print production demand in the print production environment.
  • Document production environments such as print shops, convert printing orders, such as print jobs, into finished printed material.
  • a print shop may process print jobs using resources such as printers, cutters, collators and other similar equipment.
  • resources in print shops are organized such that when a print job arrives from a customer at a particular print shop, the print job can be processed by performing one or more production functions.
  • product variety e.g., the requirements of a given job
  • product variety can be low, and the associated steps for a significant number of jobs might consist of printing, inserting, sorting and shipping.
  • product variety corresponding, for instance, with job size
  • equipment used to process these jobs e.g. continuous feed machines and inserting equipment
  • print demand exhibits a tremendous variety of time series behavior.
  • Forecasting demand for a given large print shop can be useful in, among other things, managing shop resources.
  • traditional approaches of forecasting may be insufficient to suitably forecast demand in large print shops with considerable print job variability.
  • a preference toward using pooled demand forecast (as opposed to forecasting components individually and summing the forecasts to obtain an aggregate forecast) has been expressed. It has been found, however, that pooled demand forecasting can break down in, among other environments, print production environments when the job related demand exhibits relatively high levels of variability.
  • the demand components are derived with a segmentation technique, which technique can be performed with a database attribute (e.g., an attribute, such as job or form type, client, duplex/simplex (i.e., media “plex”); obtained from a data warehouse, by time slice (e.g., Mondays or firsts of the month), or by statistical thresholding (e.g., demand over and under 30,000 prints).
  • a first demand related forecast is generated with a combination of the at least two demand components and a second demand related forecast may be generated with the at least one demand component.
  • the first and second demand related forecasts may be shown or used in an aggregate plot, the aggregate plot being used to obtain forecast demand data for the print production environment.
  • Forecasting with the disclosed approach of the '993 Patent Application is well suited for its intended purpose.
  • use of the disclosed approach can clearly lead to significantly improved forecasting (i.e., reasonably low levels of mean absolute percentage error [MAPE]).
  • MAPE mean absolute percentage error
  • a print demand forecasting system for use with a print production system in which multiple print jobs are processed over a selected time interval.
  • the print demand forecasting system includes: a data collection tool, said data collection tool collecting print demand data for each print job processed during the selected time interval; mass memory for storing the collected print demand data; a computer implemented service manager for processing the stored print demand data to obtain a first time series component and a second time series component, said computer implemented service corresponding the first time series component with a first forecast model and the second time series component with a second forecast model; and a selector process, operating with said computer implemented service manager to select one of the first forecast model and the second forecast model, the selected one of the first forecast model and the second forecast model being used to obtain forecast data for a selected time outside of the selected time interval.
  • a print demand forecasting method for use with a print production system in which multiple print jobs are processed over a selected time interval.
  • the print demand forecasting method includes: collecting print demand data for each print job processed during the selected time interval; storing the collected print demand data in memory; processing the stored print demand data to obtain a first time series component and a second time series component; corresponding the first time series component with a first forecast model and the second time series component with a second forecast model; selecting one of the first forecast model and the second forecast model; and using the selected one of the first forecast model and the second forecast model obtain forecast data for a selected time outside of the selected time interval.
  • FIG. 1 is a block diagram of a data collection/processing architecture, suitable for use with the disclosed embodiments
  • FIG. 2 is a graphical representation of a first time series of impressions for a print production factory
  • FIG. 3 is a graphical representation based on FIG. 2 in which four interleaved processes are shown as being decomposed with database entries;
  • FIG. 4 is a graphical fit (obtained with auto regressive integrated moving average [ARIMA] modeling) for the decomposed time series of FIG. 3 ;
  • FIG. 5 is a graphical representation of the time series of FIG. 2 initially segmented with a robust smoother
  • FIG. 6 is a histogram based on a processed FIG. 5 ;
  • FIG. 7 is a graphical representation of FIG. 2 in which segmenting is performed with thresholds obtained from FIG. 6 ;
  • FIGS. 8A-8D are graphically represented components of FIG. 7 ;
  • FIG. 9 graphically illustrates the four components of FIG. 8A-8D as four categories or processes
  • FIG. 10 is a graphical fit for the decomposed time series of FIG. 7 ;
  • FIG. 11 is a graphical representation of a second time series of impressions
  • FIG. 12 is a graphical representation of the time series of FIG. 11 with loess smoothing
  • FIG. 13 is a histogram computed with the smoothed time series of FIG. 12 ;
  • FIG. 14 is a graphical representation of a partitioned FIG. 12 ;
  • FIG. 15 graphically represents three components of FIG. 14 ;
  • FIG. 16 graphically illustrates the three components of FIG. 15 as three categories or processes
  • FIG. 17 graphically represents a forecast based on ARIMA (3,2,3) ⁇ (2,2,3) 11 ;
  • FIG. 18 graphically represents a forecast obtained in accordance with the disclosed embodiments with the components of FIG. 15 .
  • a network print production system with a data processing center
  • a series of document production centers 10 - 1 through 10 -N communicate with the data processing center 12 by way of a network (such as a wide area network (possibly including the world wide web)) 14 .
  • a network such as a wide area network (possibly including the world wide web)
  • At least one of the document production centers (e.g., document production center 10 - 1 ) includes an output device 16 communicating with a data collection tool (“DCT”) 18 . While particular attention is paid below to document production center 10 - 1 , several of the document production centers 10 may include the combination of at least one output device and a DCT.
  • DCT data collection tool
  • the output device 16 may be used in the context of a print shop with a number of other document processing related devices, as illustrated in U.S. Pat. No. 7,079,266 to Rai et al., the pertinent portions of which are incorporated by reference.
  • the DCT is a programmable subsystem (possibly assuming the form of a suitable application programmable interface) capable of capturing data, including performance or demand related data, from the output device at selected time intervals.
  • the output device could assume a number of forms, such as a handheld device, PDA, or RFID related device.
  • the DCT 18 may communicate with mass memory 20 for short term storage of, among other things, demand related data. Additionally, a wide variety of performance related information from the output device 16 , including information relating to job type, client, duplex/simplex, page counts and impression counts, just to name a few, may be stored in mass memory 20 .
  • the data processing center 12 includes a “service manager” 24 communicating with a “data warehouse” 26 .
  • the service manager comprises a processing platform that is capable of performing the types of forecasting calculations described below.
  • a variety of data from the document production centers 10 including demand data from mass memory 20 , is stored in the data warehouse.
  • the data warehouse may also store job performance related data in the form of a database to facilitate a data segmentation approach, as described below.
  • output of the service manager is placed in a format (e.g., a report including at least one forecast plot) suitable for communication to a network web portal 28 by a report generating application or service 30 .
  • the report in turn, can be used, to the extent necessary, to adjust operation of the document production center to which the report relates.
  • One such adjustment might include ordering inventory based on the report, while another such adjustment might include using the report to control aggregate or capacity planning.
  • FIG. 2 a time series of impressions for a print production factory is shown.
  • FIG. 3 the time series of FIG. 2 , as best understood by the present inventor, has been decomposed as far as it can using database entries (one product type, duplex, client, etc) and yet still exhibits this behavior of what appears to be four interleaved processes, some with different trends. Some of the processes look periodic, which is good for forecasting.
  • the overall process of FIG. 3 could be modeled by seasonal ARIMA [in fact, the best model the present inventor could find is ARIMA (0,0,21) ⁇ (0,0,5) 22 ].
  • FIG. 4 a fit for the decomposed time series is shown.
  • the time series is initially segmented with a robust smoother (such as loess, which is a locally linear smoother that ignores large deviations).
  • a robust smoother such as loess, which is a locally linear smoother that ignores large deviations.
  • An application of loess smoothing can be found in U.S. Patent Application Publication No. 20070078585 to Pomeroy et al. (published Apr. 5, 2007), the pertinent portions of which are incorporated herein by reference.
  • smoothed values are subtracted from the time series values and a histogram ( FIG. 6 ) is computed. The thresholds used to split the histogram of FIG.
  • the thresholds are ⁇ 219, ⁇ 38, and 300.
  • a time series segmentation may be obtained adding these threshold values to the smoothed time series.
  • each component can be modeled separately.
  • FIGS. 8A-8D the four components of FIG. 7 are shown as being modeled respectively with ARIMA (0,1,1), ARIMA(0,1,2) ⁇ (0,0,4) 11 , ARIMA(0,1,1) ⁇ (0,1,1) 5 and ARIMA(2,0,2) ⁇ (1,0,2) 4 . While the respective curves of FIGS. 8A-8D appear to provide reasonably good fits, the four resulting models are very different, with different trends and periods. As will appear, the “glue” that binds these four models together is a selector process S.
  • the process S takes on four categorical values. While these four categories are graphed in FIG. 9 as 1, 2, 3, and 4, the categories could assume the form of four processes.
  • One important aspect of the disclosed embodiments resides in the modeling S. Even though experiments were performed with a variety of methods (including a thresholded version of ARIMA, classification trees, and markov models), none seemed to provide any better results than a multinomial logistic regression. A comprehensive description of the general principles underlying multinomial logistic regression can be found in the following reference: Julian J. Faraway, Extending the Linear Model with R: Generalized Linear, Mixed Effects and Nonparametric Regression Models , Chapman & Hall/CRC, 2005.
  • ⁇ 0 , ⁇ 0 , ⁇ 0 model parameters to be estimated
  • ⁇ T , ⁇ T , ⁇ T model parameters to be estimated
  • X prepresents a co-variate vector (in this case, previous values)
  • FIG. 10 a fit for the decomposed time series of FIG. 7 , using the models of FIGS. 8A-8D along with the above expression for S immediately above, is shown.
  • the median APE is 0.066, which appears significantly better than the median APE (0.242) of the single ARIMA model described above.
  • FIG. 11 a second time series of impressions is shown.
  • loess smoothing may be performed ( FIG. 12 ) and thresholds obtained from a computed histogram ( FIG. 13 ).
  • the smoothed time series may be partitioned ( FIG. 14 ) and then broken out into multiple components—three components in the example of FIG. 15 .
  • FIG. 16 a graphical representation for the S process is provided.
  • the time series data is plotted with the forecasts from the best fitting ARIMA model ARIMA (3,2,3) ⁇ (2,2,3) 11 which has a MAPE of 0.18.
  • ARIMA ARIMA
  • FIG. 18 a forecast obtained with the components of FIG. 15 and the corresponding S process is shown.
  • the MAPE for the second case is 0,01.
  • the models for the second case obtained in accordance with the disclosed embodiments include:
  • time series can be segmented into individual time series that can be modeled well by a popular method like ARIMA, then the individual models can be forecast and the proper forecast used at the right time.
  • the process that chooses among an interleaved time series is a selector process—a random process that takes on categorical variables.
  • the selector process can be suitably obtained through use of multinomial logistic regression.

Abstract

There is provided a print demand forecasting system and method for use with a print production system in which print demand data is collected for each print job processed during a selected time interval. The collected print demand data is stored in memory and then processed to obtain a first time series component and a second time series component. The first and second time series components are corresponded respectively with first and second forecast models. One of the first and second forecast models is selected with an S process, and the selected one of the first and second forecast models is used to obtain forecast data.

Description

BACKGROUND AND SUMMARY
The disclosed embodiments relate generally to a system and method for improving the operability of a print production environment and, more particularly to an improved approach for forecasting print production demand in the print production environment.
Document production environments, such as print shops, convert printing orders, such as print jobs, into finished printed material. A print shop may process print jobs using resources such as printers, cutters, collators and other similar equipment. Typically, resources in print shops are organized such that when a print job arrives from a customer at a particular print shop, the print job can be processed by performing one or more production functions.
In one example of print shop operation, product variety (e.g., the requirements of a given job) can be low, and the associated steps for a significant number of jobs might consist of printing, inserting, sorting and shipping. In another example, product variety (corresponding, for instance, with job size) can be quite high and the equipment used to process these jobs (e.g. continuous feed machines and inserting equipment) can require a high changeover time. Experience working with some very large print shops has revealed that print demand exhibits a tremendous variety of time series behavior.
Forecasting demand for a given large print shop can be useful in, among other things, managing shop resources. However, traditional approaches of forecasting (as found in associated literature) may be insufficient to suitably forecast demand in large print shops with considerable print job variability. For instance, in literature relating to forecasting a preference toward using pooled demand forecast (as opposed to forecasting components individually and summing the forecasts to obtain an aggregate forecast) has been expressed. It has been found, however, that pooled demand forecasting can break down in, among other environments, print production environments when the job related demand exhibits relatively high levels of variability.
In U.S. patent application Ser. No. 11/868,993 to Rai et al. entitled System and Method of Forecasting Print Job Related Demand (filed on Oct. 9, 2007 and published on Apr. 9, 2009 as U.S. Patent Application Publication No. 2009/0094094-A1) demand data is collected for a print production environment and then segmented into a first demand series with at least two demand components and a second demand series with at least one demand component. The demand components are derived with a segmentation technique, which technique can be performed with a database attribute (e.g., an attribute, such as job or form type, client, duplex/simplex (i.e., media “plex”); obtained from a data warehouse, by time slice (e.g., Mondays or firsts of the month), or by statistical thresholding (e.g., demand over and under 30,000 prints). In practice a first demand related forecast is generated with a combination of the at least two demand components and a second demand related forecast may be generated with the at least one demand component. In one approach, the first and second demand related forecasts may be shown or used in an aggregate plot, the aggregate plot being used to obtain forecast demand data for the print production environment.
Forecasting with the disclosed approach of the '993 Patent Application is well suited for its intended purpose. In particular, use of the disclosed approach can clearly lead to significantly improved forecasting (i.e., reasonably low levels of mean absolute percentage error [MAPE]). Nonetheless, it is believed that the approach disclosed and claimed below may, under certain circumstances, result in even lower levels of MAPE.
In one aspect of the disclosed embodiments there is disclosed a print demand forecasting system for use with a print production system in which multiple print jobs are processed over a selected time interval. The print demand forecasting system includes: a data collection tool, said data collection tool collecting print demand data for each print job processed during the selected time interval; mass memory for storing the collected print demand data; a computer implemented service manager for processing the stored print demand data to obtain a first time series component and a second time series component, said computer implemented service corresponding the first time series component with a first forecast model and the second time series component with a second forecast model; and a selector process, operating with said computer implemented service manager to select one of the first forecast model and the second forecast model, the selected one of the first forecast model and the second forecast model being used to obtain forecast data for a selected time outside of the selected time interval.
In another aspect of the disclosed embodiments there is disclosed A print demand forecasting method for use with a print production system in which multiple print jobs are processed over a selected time interval. The print demand forecasting method includes: collecting print demand data for each print job processed during the selected time interval; storing the collected print demand data in memory; processing the stored print demand data to obtain a first time series component and a second time series component; corresponding the first time series component with a first forecast model and the second time series component with a second forecast model; selecting one of the first forecast model and the second forecast model; and using the selected one of the first forecast model and the second forecast model obtain forecast data for a selected time outside of the selected time interval.
BRIEF DESCRIPTION OF THE DRAWINGS
FIG. 1 is a block diagram of a data collection/processing architecture, suitable for use with the disclosed embodiments;
FIG. 2 is a graphical representation of a first time series of impressions for a print production factory;
FIG. 3 is a graphical representation based on FIG. 2 in which four interleaved processes are shown as being decomposed with database entries;
FIG. 4 is a graphical fit (obtained with auto regressive integrated moving average [ARIMA] modeling) for the decomposed time series of FIG. 3;
FIG. 5 is a graphical representation of the time series of FIG. 2 initially segmented with a robust smoother;
FIG. 6 is a histogram based on a processed FIG. 5;
FIG. 7 is a graphical representation of FIG. 2 in which segmenting is performed with thresholds obtained from FIG. 6;
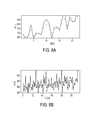
FIGS. 8A-8D are graphically represented components of FIG. 7;
FIG. 9 graphically illustrates the four components of FIG. 8A-8D as four categories or processes;
FIG. 10 is a graphical fit for the decomposed time series of FIG. 7;
FIG. 11 is a graphical representation of a second time series of impressions;
FIG. 12 is a graphical representation of the time series of FIG. 11 with loess smoothing;
FIG. 13 is a histogram computed with the smoothed time series of FIG. 12;
FIG. 14 is a graphical representation of a partitioned FIG. 12;
FIG. 15 graphically represents three components of FIG. 14;
FIG. 16 graphically illustrates the three components of FIG. 15 as three categories or processes;
FIG. 17 graphically represents a forecast based on ARIMA (3,2,3)×(2,2,3)11; and
FIG. 18 graphically represents a forecast obtained in accordance with the disclosed embodiments with the components of FIG. 15.
DESCRIPTION OF DISCLOSED EMBODIMENTS
Referring to FIG. 1, a network print production system, with a data processing center, is shown. In the illustrated approach of FIG. 1, a series of document production centers 10-1 through 10-N (collectively referred to as document production centers 10, some of which may include print shops or production print facilities) communicate with the data processing center 12 by way of a network (such as a wide area network (possibly including the world wide web)) 14. At least one of the document production centers (e.g., document production center 10-1) includes an output device 16 communicating with a data collection tool (“DCT”) 18. While particular attention is paid below to document production center 10-1, several of the document production centers 10 may include the combination of at least one output device and a DCT. Additionally, as should be apparent to those skilled in the art, the output device 16 may be used in the context of a print shop with a number of other document processing related devices, as illustrated in U.S. Pat. No. 7,079,266 to Rai et al., the pertinent portions of which are incorporated by reference.
In one example, the DCT is a programmable subsystem (possibly assuming the form of a suitable application programmable interface) capable of capturing data, including performance or demand related data, from the output device at selected time intervals. It should be appreciated that, consistent with U.S. Pat. No. 7,242,302 to Rai et al., the pertinent portions of which are incorporated herein by reference, the output device could assume a number of forms, such as a handheld device, PDA, or RFID related device. The DCT 18 may communicate with mass memory 20 for short term storage of, among other things, demand related data. Additionally, a wide variety of performance related information from the output device 16, including information relating to job type, client, duplex/simplex, page counts and impression counts, just to name a few, may be stored in mass memory 20.
The data processing center 12 includes a “service manager” 24 communicating with a “data warehouse” 26. In one illustrated embodiment, the service manager comprises a processing platform that is capable of performing the types of forecasting calculations described below. As contemplated, a variety of data from the document production centers 10, including demand data from mass memory 20, is stored in the data warehouse. The data warehouse may also store job performance related data in the form of a database to facilitate a data segmentation approach, as described below. In the illustrated approach of FIG. 1, output of the service manager is placed in a format (e.g., a report including at least one forecast plot) suitable for communication to a network web portal 28 by a report generating application or service 30. The report, in turn, can be used, to the extent necessary, to adjust operation of the document production center to which the report relates. One such adjustment might include ordering inventory based on the report, while another such adjustment might include using the report to control aggregate or capacity planning.
Referring now to FIG. 2, a time series of impressions for a print production factory is shown. Referring to FIG. 3, the time series of FIG. 2, as best understood by the present inventor, has been decomposed as far as it can using database entries (one product type, duplex, client, etc) and yet still exhibits this behavior of what appears to be four interleaved processes, some with different trends. Some of the processes look periodic, which is good for forecasting. The overall process of FIG. 3 could be modeled by seasonal ARIMA [in fact, the best model the present inventor could find is ARIMA (0,0,21)×(0,0,5)22]. Referring to FIG. 4, a fit for the decomposed time series is shown. The fit using the first 90% of the data seems reasonably good, and if the fit is used to forecast the last 10% of the data, a Median Percentage Absolute Error (MAPE) of 0.242 is obtained. Further information about the application of ARIMA, in the context of time series forecasting, is disclosed in U.S. Pat. No. 7,251,589 to Crowe et al., the pertinent portions of which are incorporated herein by reference.
An approach of the disclosed embodiments will now be applied to the time series of FIG. 2. Referring to FIG. 5, the time series is initially segmented with a robust smoother (such as loess, which is a locally linear smoother that ignores large deviations). An application of loess smoothing can be found in U.S. Patent Application Publication No. 20070078585 to Pomeroy et al. (published Apr. 5, 2007), the pertinent portions of which are incorporated herein by reference. Next, smoothed values are subtracted from the time series values and a histogram (FIG. 6) is computed. The thresholds used to split the histogram of FIG. 6 can be found automatically using clustering (k-means) or possibly as a mixture of Gaussians estimated by expectation maximization. In the example of FIG. 6, the thresholds are −219, −38, and 300. Referring to FIG. 7, a time series segmentation may be obtained adding these threshold values to the smoothed time series.
With the time series segmentation of FIG. 7 (including four components separated by curves 34, 36 and 38), each component can be modeled separately. Referring to FIGS. 8A-8D, the four components of FIG. 7 are shown as being modeled respectively with ARIMA (0,1,1), ARIMA(0,1,2)×(0,0,4)11, ARIMA(0,1,1)×(0,1,1)5 and ARIMA(2,0,2)×(1,0,2)4. While the respective curves of FIGS. 8A-8D appear to provide reasonably good fits, the four resulting models are very different, with different trends and periods. As will appear, the “glue” that binds these four models together is a selector process S.
Referring to FIG. 9, the process S, as applied to the time series of FIG. 7, takes on four categorical values. While these four categories are graphed in FIG. 9 as 1, 2, 3, and 4, the categories could assume the form of four processes. One important aspect of the disclosed embodiments resides in the modeling S. Even though experiments were performed with a variety of methods (including a thresholded version of ARIMA, classification trees, and markov models), none seemed to provide any better results than a multinomial logistic regression. A comprehensive description of the general principles underlying multinomial logistic regression can be found in the following reference: Julian J. Faraway, Extending the Linear Model with R: Generalized Linear, Mixed Effects and Nonparametric Regression Models, Chapman & Hall/CRC, 2005.
For the sake of understanding the modeling of S with the multinominal logistic regression, consider a process that takes on four values, {a, b, c, d}, and let the probabilites of the values be pa, pb, pc, and pd, and the sum of the probabilities be 1. The model might then include the following three logistic regression equations (of course, more equations would be formed for additional components:
log ( p b p a ) = α 0 + α T X log ( p c p a ) = β 0 + β T X log ( p d p a ) = γ 0 + γ T X
Where,
α0, β0, γ0=model parameters to be estimated;
αT, βT, γT=model parameters to be estimated; and
X prepresents a co-variate vector (in this case, previous values)
In essence, fitting this model (including solving the above equations) provides a forecaster. It produces an estimator of the probabilities (pa, pb, pc, pd) for a next observation and the best forecast is the one with the highest probability. The above forecaster performs surprisingly well with an error of 2.4%, and has been found to work well as a time series forecaster. Putting the models together operates, in part, as follows:
    • 1) From previous observations x1, . . . , xt, segment a time series to produce series xa, xb, xc, and xd plus selector S.
    • 2) From categorical observations S1, . . . , St, fit a multinomial logistic regression model and use it to forecast St+1.
    • 3) Use the forecasted category to select which model to forecast, e.g., if St+1=c, foreacast model xc. In one example this could be an ARIMA model; in another example this could be exponential smoothing.
    • 4) Report the forecasted value of 3) as the forecast for the process.
It has been found that error in modeling of the forecaster for S (e.g., an error of 10%) can produce inadequate forecasts for the process. For the time series of FIG. 2, the following S was determined with the process described above:
S: Multinom(X23˜X1+ . . . +X22) (i.e., looks back 22 obs to forecast the next one
Referring specifically to FIG. 10, a fit for the decomposed time series of FIG. 7, using the models of FIGS. 8A-8D along with the above expression for S immediately above, is shown. For the exemplary forecast of FIG. 10, the median APE is 0.066, which appears significantly better than the median APE (0.242) of the single ARIMA model described above.
Referring to FIG. 11, a second time series of impressions is shown. Applying the above-described approach of the disclosed embodiments to this time series, loess smoothing may be performed (FIG. 12) and thresholds obtained from a computed histogram (FIG. 13). Using the the thresholds, the smoothed time series may be partitioned (FIG. 14) and then broken out into multiple components—three components in the example of FIG. 15. Referring to FIG. 16, a graphical representation for the S process is provided.
Referring to FIG. 17, the time series data is plotted with the forecasts from the best fitting ARIMA model ARIMA (3,2,3)×(2,2,3)11 which has a MAPE of 0.18. By contrast, referring to FIG. 18, a forecast obtained with the components of FIG. 15 and the corresponding S process is shown. The MAPE for the second case is 0,01. The models for the second case obtained in accordance with the disclosed embodiments include:
Top: ARIMA (5,1,1)×(0,1,0)7;
Middle: ARIMA(0,2,8)×(0,2,1)9;
Bottom: ARIMA(1,2,1)×(1,2,1)6; and
S: Multinom(X12˜X1+ . . . +X11) (i.e., looks back 11 obs to forecast the next one).
The disclosed embodiments demonstrates that if time series can be segmented into individual time series that can be modeled well by a popular method like ARIMA, then the individual models can be forecast and the proper forecast used at the right time. The process that chooses among an interleaved time series is a selector process—a random process that takes on categorical variables. The selector process can be suitably obtained through use of multinomial logistic regression.
The following are some observations regarding the disclosed embodiments:
    • 1) It is believed that the approach disclosed above provides a significant increase in time series forecasting accuracy (at least with respect to the area of demand forecasting) by segmenting a time series into time series components, each of which component can be forecast with relatively high accuracy.
    • 2) Time series components are not necessarily simple, at least in the examples studied. They may possess differing periods and trends.
    • 3) A substantial number of time series cannot be further decomposed by database fields, nor, at least with respect to the examples studied by this inventor, are there identifiable patterns associated with day of the week or month.
    • 4) As an aggregate, a time series may have changing (deceasing or increasing) variance. This confounds many time series models.
    • 5) While the observation that multinomial regression works well with respect to demand forecasting may appear surprising, in a significant number of instances, multinominal regression out-performed other machine-learning methods.
    • 7) The types of time series described above do not appear to be uncommon. For example, out of 78 time series extracted from one exemplary account, 19 of these exhibited a structure toward which the disclosed embodiments are directed.
Based on the above description, the following features of the disclosed embodiments should now be apparent:
    • The above-described print demand forecasting system smoothes print demand data to obtain smoothed values. A histogram may be computed with the smoothed values so that at least one threshold may be obtained, the at least one threshold being used to segment the print demand data. A graphical representation of the segmented print demand data may be used to obtain the above-mentioned S process.
    • The above-described technique uses first and second forecast models, with each of the first forecast model and the second forecast model possibly being selected from one of a plurality of forecast models. In one example, the one of a plurality of forecast models is an ARIMA based model.
    • The selector process may be obtained from one of a plurality of models. In one example, the one of a plurality of models comprises a multinominal regression model. Use of the multinominal logistic model may include solving multiple logistic regression equations, the multiple logistic regression equations varying as a function of first and second time series components.
    • The print demand data may be collected with a data collection tool, wherein the print demand data corresponds with print impressions produced over a selected time interval. In one example, the data collection tool, a computer implemented service manager, and a plurality of document production centers all communicate with one another by way of a network. In practice, forecast data, obtained in accordance with the disclosed embodiments, may be transmitted to the plurality of document production centers.
The claims, as originally presented and as possibly amended, encompass variations, alternatives, modifications, improvements, equivalents, and substantial equivalents of the embodiments and teachings disclosed herein, including those that are presently unforeseen or unappreciated, and that, for example, may arise from applicants/patentees and others.
It will be appreciated that various of the above-disclosed and other features and functions, or alternatives thereof, may be desirably combined into many other different systems or applications. Also that various presently unforeseen or unanticipated alternatives, modifications, variations or improvements therein may be subsequently made by those skilled in the art which are also intended to be encompassed by the following claims. Unless specifically recited in a claim, steps or components of claims should not be implied or imported from the specification or any other claims as to any particular order, number, position, size, shape, angle, color, or material.

Claims (15)

What is claimed is:
1. A print demand forecasting system for use with a print production system in which multiple print jobs are processed over a selected time interval, comprising:
a data collection tool, said data collection tool collecting print demand data for each print job processed during the selected time interval;
mass memory for storing the collected print demand data;
a computer implemented service manager for processing the stored print demand data to obtain a first time series component and a second time series component, said computer implemented service manager corresponding the first time series component with a first forecast model and the second time series component with a second forecast model; and
a selector process, operating with said computer implemented service manager to select one of the first forecast model and the second forecast model by:
solving a plurality of first logistic regression equations associated with the first forecast model to determine a first estimation of one or more probability values for a next observation, wherein the plurality of first logistic regression equations vary as a function of the first time series component,
solving a plurality of second logistic regression equations associated with the second forecast model to determine a second estimation of one or more probability values for a next observation, wherein the plurality of second logistic regression equations vary as a function of the second time series component,
wherein one or more of the first estimation and the second estimation have an error of 2.4% or less, and
selecting one of the first forecast model and the second forecast model whose estimation is associated with a highest probability value,
wherein the selected one of the first forecast model and the second forecast model is used to obtain forecast data forecasting print production demand for a selected time outside of the selected time interval, wherein the selector process is configured to:
smooth the print demand data to obtain smoothed values,
compute a histogram with the smoothed values,
obtain at least one threshold from the histogram, and
use the at least one threshold to segment the print demand data.
2. The print demand forecasting system of claim 1, wherein a graphical representation of the segmented print demand data is used to obtain said selector process.
3. The print demand forecasting system of claim 1, wherein each of the first forecast model and the second forecast model is selected from one of a plurality of forecast models.
4. The print demand forecasting system of claim 3, wherein the one of a plurality of forecasting models is an auto regressive integrated moving average (ARIMA) based model.
5. The print demand forecasting system of claim 1, wherein one of a plurality of models is used to obtain said selector process.
6. The print demand forecasting system of claim 5, wherein the one of a plurality of models comprises a multinomial logistic regression model.
7. The print demand forecasting system of 1, wherein said data collection tool collects data corresponding with print impressions produced over the selected time interval.
8. The print demand forecasting system of claim 1, in which said computer implemented service manager communicates with a plurality of document production centers by way of a network, wherein the forecast data is transmitted to one of more of the plurality of document production centers.
9. A print demand forecasting method for use with a print production system in which multiple print jobs are processed over a selected time interval, comprising:
collecting print demand data for each print job processed during the selected time interval;
storing the collected print demand data in memory;
smoothing the print demand data to obtain smoothed values;
computing a histogram with the smoothed values;
obtaining at least one threshold from the histogram;
using the at least one threshold to segment the print demand data;
processing by a computer implemented service manager comprising a processing platform, the segmented print demand data to obtain a first time series component and a second time series component;
corresponding the first time series component with a first forecast model and the second time series component with a second forecast model;
selecting by the computer implemented service manager comprising the processing platform, one of the first forecast model and the second forecast model by:
solving a plurality of first logistic regression equations associated with the first forecast model to determine a first estimation of one or more probability values for a next observation, wherein the plurality of first logistic regression equations vary as a function of the first time series component,
solving a plurality of second logistic regression equations associated with the second forecast model to determine a second estimation of one or more probability values for a next observation, wherein the plurality of second logistic regression equations vary as a function of the second time series component,
wherein one or more of the first estimation and the second estimation have an error of 2.4% or less, and
selecting one of the first forecast model and the second forecast model whose estimation is associated with a highest probability value; and
using the selected one of the first forecast model and the second forecast model to obtain forecast data forecasting print production demand for a selected time outside of the selected time interval.
10. The print demand forecasting method of claim 9, developing a graphical representation of the segmented print demand data.
11. The print demand forecasting method of claim 10, in which said selecting is performed with a selector process, further comprising using the graphical representation of the segmented print demand data to obtain said selector process.
12. The print demand forecasting method of claim 9, further comprising selecting each of the first forecast model and the second forecast model from a plurality of forecast models.
13. The print demand forecasting method of claim 12, wherein the one of a plurality of forecast models is an auto regressive integrated moving average (ARIMA) based model.
14. The print demand forecasting method of claim 9, in which said selecting is performed with a selector process, further comprising using one of a plurality of models to obtain the selector process.
15. The print demand forecasting method of claim 14, wherein the one of a plurality of models comprises a multinomial logistic regression model.
US12/183,154 2008-07-31 2008-07-31 System and method of forecasting print job related demand Expired - Fee Related US8768745B2 (en)

Priority Applications (1)

Application Number Priority Date Filing Date Title
US12/183,154 US8768745B2 (en) 2008-07-31 2008-07-31 System and method of forecasting print job related demand

Applications Claiming Priority (1)

Application Number Priority Date Filing Date Title
US12/183,154 US8768745B2 (en) 2008-07-31 2008-07-31 System and method of forecasting print job related demand

Publications (2)

Publication Number Publication Date
US20100030617A1 US20100030617A1 (en) 2010-02-04
US8768745B2 true US8768745B2 (en) 2014-07-01

Family

ID=41609283

Family Applications (1)

Application Number Title Priority Date Filing Date
US12/183,154 Expired - Fee Related US8768745B2 (en) 2008-07-31 2008-07-31 System and method of forecasting print job related demand

Country Status (1)

Country Link
US (1) US8768745B2 (en)

Cited By (1)

* Cited by examiner, † Cited by third party
Publication number Priority date Publication date Assignee Title
US20230324896A1 (en) * 2021-06-14 2023-10-12 MakinaRocks Co., Ltd. Method and apparatus for detecting anomaly data

Families Citing this family (9)

* Cited by examiner, † Cited by third party
Publication number Priority date Publication date Assignee Title
US7797189B2 (en) * 2007-10-09 2010-09-14 Xerox Corporation System and method of forecasting print job related demand
US8321280B2 (en) * 2008-10-01 2012-11-27 Yahoo! Inc. Demand forecasting system and method for online advertisements
US9354578B2 (en) 2012-03-12 2016-05-31 Xerox Corporation Systems and methods for forecasting supply or service consumption for a printing device
US10515308B2 (en) * 2015-10-30 2019-12-24 Global Design Corporation Ltd. System, method and cloud-based platform for predicting energy consumption
US10600307B2 (en) 2015-10-30 2020-03-24 Global Design Corporation Ltd. Energy consumption alerting method, energy consumption alerting system and platform
US10510126B2 (en) 2015-10-30 2019-12-17 Global Design Corporation Ltd. Energy consumption alerting system, platform and method
US11537847B2 (en) * 2016-06-17 2022-12-27 International Business Machines Corporation Time series forecasting to determine relative causal impact
US10097726B2 (en) * 2016-11-28 2018-10-09 Kyocera Document Solutions Inc. System and method for requesting a status report after receiving an error alert
US20190057404A1 (en) * 2017-08-15 2019-02-21 Linkedin Corporation Jobs forecasting

Citations (38)

* Cited by examiner, † Cited by third party
Publication number Priority date Publication date Assignee Title
US5970224A (en) * 1997-04-14 1999-10-19 Xerox Corporation Multifunctional printing system with queue management
US20010055123A1 (en) 2000-05-16 2001-12-27 Xerox Corporation Apparatus and method for describing, planning and automatically programming complex finishing tasks
US20020124756A1 (en) 2001-01-23 2002-09-12 Xerox Corporation Method for determining optimal batch sizes for processing print jobs in a printing environment
US20020129081A1 (en) 2001-01-26 2002-09-12 Sudhendu Rai Production server architecture and methods for automated control of production document management
US20030149747A1 (en) 2002-02-01 2003-08-07 Xerox Corporation Method and apparatus for modeling print jobs
US6611726B1 (en) * 1999-09-17 2003-08-26 Carl E. Crosswhite Method for determining optimal time series forecasting parameters
US6650433B1 (en) * 2000-01-25 2003-11-18 Vista Print Usa Inc. Managing print jobs
US20040130745A1 (en) 2003-01-03 2004-07-08 Laser Substrates, Inc. Automatic printer optimization settings
US20040267485A1 (en) 2003-06-30 2004-12-30 Penov Francislav P Test execution framework for automated software testing
US6941013B1 (en) * 2002-04-22 2005-09-06 The United States Of America As Represented By The National Security Agency Method of image binarization using histogram modeling
US7002702B1 (en) 1999-04-09 2006-02-21 Canon Kabushiki Kaisha Data processing apparatus and data processing method for controlling plural peripheral devices to provide function
US7079266B1 (en) 2000-11-03 2006-07-18 Xerox Corporation Printshop resource optimization via the use of autonomous cells
US20060224440A1 (en) 2005-03-31 2006-10-05 Xerox Corporation Systems and methods for determining process cycle efficiency in production environments
US20060226980A1 (en) 2005-03-31 2006-10-12 Xerox Corporation Systems and methods for capturing workflow information
US7125179B1 (en) 2005-07-19 2006-10-24 Xerox Corporation System and method of evaluating print shop consolidation options in an enterprise
US20060241900A1 (en) * 2002-10-11 2006-10-26 Qingmao Hu Statistical data analysis tool
US7152589B2 (en) 2002-06-20 2006-12-26 Alfa Laval Corporate Ab Method and a device for cleaning of crankcase gas
US20070019228A1 (en) 2005-07-20 2007-01-25 Xerox Corporation Print job allocation system and method
US20070078585A1 (en) 2005-09-30 2007-04-05 Pomeroy Bruce D System and method for estimating turbine engine deterioration rate with noisy data
US20070091355A1 (en) 2005-10-26 2007-04-26 Xerox Corporation System and method for dynamically reconfiguring one or more autonomous cells in a print shop environment
US20070092323A1 (en) 2005-10-20 2007-04-26 Xerox Corporation System and method for determining an optimal batch size for a print job
US20070124182A1 (en) 2005-11-30 2007-05-31 Xerox Corporation Controlled data collection system for improving print shop operation
US7230744B2 (en) * 2001-10-13 2007-06-12 Hewlett-Packard Development Company, L.P. Performance of a multi-stage service within an information technology network
US20070177191A1 (en) 2006-01-31 2007-08-02 Xerox Corporation Dynamic offer generation based on print shop machine load
US20070236724A1 (en) 2006-03-30 2007-10-11 Xerox Corporation Print job management system
US20070247657A1 (en) 2006-04-25 2007-10-25 Xerox Corporation Print job management system
US20070247659A1 (en) 2006-04-25 2007-10-25 Xerox Corporation Print job management system
US20070279675A1 (en) 2006-06-02 2007-12-06 Kabushiki Kaisha Toshiba System and method for intelligent management of document processing jobs
US20070293981A1 (en) 2006-05-30 2007-12-20 Xerox Corporation Mail processing system
US20080285067A1 (en) 2007-05-18 2008-11-20 Xerox Corporation System and Method for Improving Throughput In a Print Production Environment
US20090021775A1 (en) 2007-07-18 2009-01-22 Xerox Corporation Workflow scheduling method and system
US20090021773A1 (en) 2007-07-18 2009-01-22 Xerox Corporation System and methods for efficient and adequate data collection in document production environments
US20090021774A1 (en) 2007-07-18 2009-01-22 Xerox Corporation Workflow partitioning method and system
US20090157579A1 (en) 2007-12-12 2009-06-18 Xerox Corporation System and method of forecasting print job related demand
US7562062B2 (en) 2005-03-31 2009-07-14 British Telecommunications Plc Forecasting system tool
US7584116B2 (en) 2002-11-04 2009-09-01 Hewlett-Packard Development Company, L.P. Monitoring a demand forecasting process
US7716022B1 (en) * 2005-05-09 2010-05-11 Sas Institute Inc. Computer-implemented systems and methods for processing time series data
US20100290079A1 (en) 2009-05-15 2010-11-18 Xerox Corporation Capacity planning incorporating job size distribution

Family Cites Families (1)

* Cited by examiner, † Cited by third party
Publication number Priority date Publication date Assignee Title
CN100397918C (en) * 2003-03-24 2008-06-25 捷讯研究有限公司 Methods and apparatus for delivering a message to two or more associated wireless communication devices

Patent Citations (44)

* Cited by examiner, † Cited by third party
Publication number Priority date Publication date Assignee Title
US5970224A (en) * 1997-04-14 1999-10-19 Xerox Corporation Multifunctional printing system with queue management
US7002702B1 (en) 1999-04-09 2006-02-21 Canon Kabushiki Kaisha Data processing apparatus and data processing method for controlling plural peripheral devices to provide function
US6611726B1 (en) * 1999-09-17 2003-08-26 Carl E. Crosswhite Method for determining optimal time series forecasting parameters
US6650433B1 (en) * 2000-01-25 2003-11-18 Vista Print Usa Inc. Managing print jobs
US20010055123A1 (en) 2000-05-16 2001-12-27 Xerox Corporation Apparatus and method for describing, planning and automatically programming complex finishing tasks
US7061636B2 (en) 2000-05-16 2006-06-13 Xerox Corporation Production monitor controller apparatus and method for assembler/finisher systems
US7079266B1 (en) 2000-11-03 2006-07-18 Xerox Corporation Printshop resource optimization via the use of autonomous cells
US20020124756A1 (en) 2001-01-23 2002-09-12 Xerox Corporation Method for determining optimal batch sizes for processing print jobs in a printing environment
US6805502B2 (en) 2001-01-23 2004-10-19 Xerox Corporation Method for determining optimal batch sizes for processing print jobs in a printing environment
US7051328B2 (en) 2001-01-26 2006-05-23 Xerox Corporation Production server architecture and methods for automated control of production document management
US20020129081A1 (en) 2001-01-26 2002-09-12 Sudhendu Rai Production server architecture and methods for automated control of production document management
US7230744B2 (en) * 2001-10-13 2007-06-12 Hewlett-Packard Development Company, L.P. Performance of a multi-stage service within an information technology network
US20030149747A1 (en) 2002-02-01 2003-08-07 Xerox Corporation Method and apparatus for modeling print jobs
US6941013B1 (en) * 2002-04-22 2005-09-06 The United States Of America As Represented By The National Security Agency Method of image binarization using histogram modeling
US7152589B2 (en) 2002-06-20 2006-12-26 Alfa Laval Corporate Ab Method and a device for cleaning of crankcase gas
US20060241900A1 (en) * 2002-10-11 2006-10-26 Qingmao Hu Statistical data analysis tool
US7584116B2 (en) 2002-11-04 2009-09-01 Hewlett-Packard Development Company, L.P. Monitoring a demand forecasting process
US20040130745A1 (en) 2003-01-03 2004-07-08 Laser Substrates, Inc. Automatic printer optimization settings
US20040267485A1 (en) 2003-06-30 2004-12-30 Penov Francislav P Test execution framework for automated software testing
US20060226980A1 (en) 2005-03-31 2006-10-12 Xerox Corporation Systems and methods for capturing workflow information
US20060224440A1 (en) 2005-03-31 2006-10-05 Xerox Corporation Systems and methods for determining process cycle efficiency in production environments
US7242302B2 (en) 2005-03-31 2007-07-10 Xerox Corporation Systems and methods for capturing workflow information
US7562062B2 (en) 2005-03-31 2009-07-14 British Telecommunications Plc Forecasting system tool
US7716022B1 (en) * 2005-05-09 2010-05-11 Sas Institute Inc. Computer-implemented systems and methods for processing time series data
US7125179B1 (en) 2005-07-19 2006-10-24 Xerox Corporation System and method of evaluating print shop consolidation options in an enterprise
US20070019228A1 (en) 2005-07-20 2007-01-25 Xerox Corporation Print job allocation system and method
US20070078585A1 (en) 2005-09-30 2007-04-05 Pomeroy Bruce D System and method for estimating turbine engine deterioration rate with noisy data
US20070092323A1 (en) 2005-10-20 2007-04-26 Xerox Corporation System and method for determining an optimal batch size for a print job
US20070091355A1 (en) 2005-10-26 2007-04-26 Xerox Corporation System and method for dynamically reconfiguring one or more autonomous cells in a print shop environment
US20070124182A1 (en) 2005-11-30 2007-05-31 Xerox Corporation Controlled data collection system for improving print shop operation
US20070177191A1 (en) 2006-01-31 2007-08-02 Xerox Corporation Dynamic offer generation based on print shop machine load
US20070236724A1 (en) 2006-03-30 2007-10-11 Xerox Corporation Print job management system
US7755778B2 (en) 2006-03-30 2010-07-13 Xerox Corporation Print job management system
US20070247659A1 (en) 2006-04-25 2007-10-25 Xerox Corporation Print job management system
US20070247657A1 (en) 2006-04-25 2007-10-25 Xerox Corporation Print job management system
US20070293981A1 (en) 2006-05-30 2007-12-20 Xerox Corporation Mail processing system
US20070279675A1 (en) 2006-06-02 2007-12-06 Kabushiki Kaisha Toshiba System and method for intelligent management of document processing jobs
US20080285067A1 (en) 2007-05-18 2008-11-20 Xerox Corporation System and Method for Improving Throughput In a Print Production Environment
US20090021774A1 (en) 2007-07-18 2009-01-22 Xerox Corporation Workflow partitioning method and system
US20090021773A1 (en) 2007-07-18 2009-01-22 Xerox Corporation System and methods for efficient and adequate data collection in document production environments
US20090021775A1 (en) 2007-07-18 2009-01-22 Xerox Corporation Workflow scheduling method and system
US20090157579A1 (en) 2007-12-12 2009-06-18 Xerox Corporation System and method of forecasting print job related demand
US7953681B2 (en) 2007-12-12 2011-05-31 Xerox Corporation System and method of forecasting print job related demand
US20100290079A1 (en) 2009-05-15 2010-11-18 Xerox Corporation Capacity planning incorporating job size distribution

Non-Patent Citations (6)

* Cited by examiner, † Cited by third party
Title
Crovella et al., "Task Assignment in a Distributed System: Improving Performance by Unbalancing Load", ACM SIGMETRICS Performance Evaluation Review, vol. 26, No. 1, ACM, 1998.
Julian J. Faraway, Extending the Linear Model with R: Generalized Linear, Mixed Effects and Nonparametric Regression Models, Chapman & Hall/CRC, 2005.
Mestha et al., "Control Elements in Production Printing and Publishing Systems: DocuColoriGen3", Conference on Decision and Control , Dec. 2003, Proceedings of the 42nd IEEE.
Potts et al., "Scheduling with batching: A review", European Journal of Operational Research 120 (2000) 228-249.
Schroeder et al., "Evaluation of Task Assignment Policies for Supercomputing Servers: The Case for Load Unbalancing and Fairness", Cluster Computer 7.2 (2004): 151-161.
U.S. Appl. No. 11/868,993 to Rai et al. entitled System and Method of Forecasting Print Job Related Demand (filed on Oct. 9, 2007 and published on Apr. 9, 2009 as U.S. Patent Application Publication No. 20090094094).

Cited By (2)

* Cited by examiner, † Cited by third party
Publication number Priority date Publication date Assignee Title
US20230324896A1 (en) * 2021-06-14 2023-10-12 MakinaRocks Co., Ltd. Method and apparatus for detecting anomaly data
US11803177B1 (en) * 2021-06-14 2023-10-31 MakinaRocks Co., Ltd. Method and apparatus for detecting anomaly data

Also Published As

Publication number Publication date
US20100030617A1 (en) 2010-02-04

Similar Documents

Publication Publication Date Title
US8768745B2 (en) System and method of forecasting print job related demand
US7797189B2 (en) System and method of forecasting print job related demand
US7987106B1 (en) System and methods for forecasting time series with multiple seasonal patterns
You et al. A decision-making framework for precision marketing
US9423989B2 (en) System and method for dynamically reconfiguring one or more autonomous cells in a print shop environment
US8190488B2 (en) Methods and systems for evaluating the impact of consolidating print shops on inventory levels
US7225040B2 (en) Method and system for reducing lead-time in the packaging industry
US7755778B2 (en) Print job management system
US8311903B2 (en) Methods and systems for evaluating the impact of migrating to a dynamic processing environment
US8908201B2 (en) System and method for filtering non-actionable alerts in a managed print service
WO2013105911A2 (en) Recommending production plans
US20110196718A1 (en) System and method for forecasting in the presence of multiple seasonal patterns in print demand
US8306847B2 (en) System and method of forecasting print demand
CN113312343A (en) Business opportunity management method and system based on web crawler tool
Kottakki et al. Customer experience driven assignment logic for online food delivery
CN101140647A (en) Invoices processing method of network tax control system
US8180665B2 (en) Systems and methods for analyzing performance of a print device in a managed print service
US9639306B1 (en) Methods and systems for cell design in a production environment
US7628316B2 (en) Recycled product distribution support apparatus and program
Martínez et al. Order acceptance for revenue management and capacity allocation in make-to-order batch plants
US20200377252A1 (en) Label printing system and method
US8675231B2 (en) Methods and systems for load leveling in a print shop
US8619305B2 (en) Methods and systems for determining sustainability metrics in a print production environment
CN115169859A (en) Intelligent distribution control method based on marketing task
Sriwongsa et al. Digital Transformation on Business Operation and Internal Administration of Printing Houses Focusing on The Problem of Adjustable Work Processes of Employees

Legal Events

Date Code Title Description
AS Assignment

Owner name: XEROX CORPORATION,CONNECTICUT

Free format text: ASSIGNMENT OF ASSIGNORS INTEREST;ASSIGNOR:HANDLEY, JOHN C, ,;REEL/FRAME:021330/0426

Effective date: 20080728

Owner name: XEROX CORPORATION, CONNECTICUT

Free format text: ASSIGNMENT OF ASSIGNORS INTEREST;ASSIGNOR:HANDLEY, JOHN C, ,;REEL/FRAME:021330/0426

Effective date: 20080728

STCF Information on status: patent grant

Free format text: PATENTED CASE

MAFP Maintenance fee payment

Free format text: PAYMENT OF MAINTENANCE FEE, 4TH YEAR, LARGE ENTITY (ORIGINAL EVENT CODE: M1551)

Year of fee payment: 4

FEPP Fee payment procedure

Free format text: MAINTENANCE FEE REMINDER MAILED (ORIGINAL EVENT CODE: REM.); ENTITY STATUS OF PATENT OWNER: LARGE ENTITY

LAPS Lapse for failure to pay maintenance fees

Free format text: PATENT EXPIRED FOR FAILURE TO PAY MAINTENANCE FEES (ORIGINAL EVENT CODE: EXP.); ENTITY STATUS OF PATENT OWNER: LARGE ENTITY

STCH Information on status: patent discontinuation

Free format text: PATENT EXPIRED DUE TO NONPAYMENT OF MAINTENANCE FEES UNDER 37 CFR 1.362

FP Lapsed due to failure to pay maintenance fee

Effective date: 20220701