US7609370B2 - Single detector based dual excitation wavelength spectra display - Google Patents
Single detector based dual excitation wavelength spectra display Download PDFInfo
- Publication number
- US7609370B2 US7609370B2 US12/017,409 US1740908A US7609370B2 US 7609370 B2 US7609370 B2 US 7609370B2 US 1740908 A US1740908 A US 1740908A US 7609370 B2 US7609370 B2 US 7609370B2
- Authority
- US
- United States
- Prior art keywords
- photons
- sample
- spectral
- spectral data
- optical detector
- Prior art date
- Legal status (The legal status is an assumption and is not a legal conclusion. Google has not performed a legal analysis and makes no representation as to the accuracy of the status listed.)
- Active, expires
Links
- 230000005284 excitation Effects 0.000 title claims abstract description 141
- 238000001228 spectrum Methods 0.000 title claims abstract description 88
- 230000009977 dual effect Effects 0.000 title description 4
- 230000003595 spectral effect Effects 0.000 claims abstract description 236
- 239000000835 fiber Substances 0.000 claims abstract description 80
- 230000004044 response Effects 0.000 claims abstract description 12
- 230000003287 optical effect Effects 0.000 claims description 76
- 238000005286 illumination Methods 0.000 claims description 48
- 238000001069 Raman spectroscopy Methods 0.000 claims description 42
- 238000000034 method Methods 0.000 claims description 26
- 238000010183 spectrum analysis Methods 0.000 claims description 13
- 238000013480 data collection Methods 0.000 claims description 11
- 238000004020 luminiscence type Methods 0.000 claims description 9
- 239000013307 optical fiber Substances 0.000 claims description 7
- 230000000295 complement effect Effects 0.000 claims description 4
- 229910044991 metal oxide Inorganic materials 0.000 claims description 4
- 150000004706 metal oxides Chemical class 0.000 claims description 4
- 239000004065 semiconductor Substances 0.000 claims description 4
- 238000012546 transfer Methods 0.000 claims description 2
- 238000004611 spectroscopical analysis Methods 0.000 abstract description 34
- 239000000126 substance Substances 0.000 abstract description 12
- 238000004458 analytical method Methods 0.000 abstract description 7
- 230000000704 physical effect Effects 0.000 abstract description 5
- 238000010835 comparative analysis Methods 0.000 abstract description 4
- 239000000523 sample Substances 0.000 description 108
- 238000001237 Raman spectrum Methods 0.000 description 16
- 239000000463 material Substances 0.000 description 9
- 238000011835 investigation Methods 0.000 description 8
- 238000001506 fluorescence spectroscopy Methods 0.000 description 6
- 238000012545 processing Methods 0.000 description 4
- 238000000701 chemical imaging Methods 0.000 description 3
- 238000012986 modification Methods 0.000 description 3
- 230000004048 modification Effects 0.000 description 3
- 238000013459 approach Methods 0.000 description 2
- 238000010586 diagram Methods 0.000 description 2
- 229910052739 hydrogen Inorganic materials 0.000 description 2
- 239000001257 hydrogen Substances 0.000 description 2
- 238000003384 imaging method Methods 0.000 description 2
- 239000004973 liquid crystal related substance Substances 0.000 description 2
- 230000008569 process Effects 0.000 description 2
- 238000004566 IR spectroscopy Methods 0.000 description 1
- 238000003332 Raman imaging Methods 0.000 description 1
- 238000002441 X-ray diffraction Methods 0.000 description 1
- 230000009286 beneficial effect Effects 0.000 description 1
- 230000008901 benefit Effects 0.000 description 1
- 238000013500 data storage Methods 0.000 description 1
- 238000013461 design Methods 0.000 description 1
- 230000004069 differentiation Effects 0.000 description 1
- 230000007613 environmental effect Effects 0.000 description 1
- 238000002189 fluorescence spectrum Methods 0.000 description 1
- 239000000383 hazardous chemical Substances 0.000 description 1
- 239000012535 impurity Substances 0.000 description 1
- 238000012423 maintenance Methods 0.000 description 1
- 238000013507 mapping Methods 0.000 description 1
- 238000004949 mass spectrometry Methods 0.000 description 1
- 230000007246 mechanism Effects 0.000 description 1
- 230000005855 radiation Effects 0.000 description 1
- 230000035945 sensitivity Effects 0.000 description 1
- 238000000926 separation method Methods 0.000 description 1
Images


Classifications
-
- G—PHYSICS
- G01—MEASURING; TESTING
- G01J—MEASUREMENT OF INTENSITY, VELOCITY, SPECTRAL CONTENT, POLARISATION, PHASE OR PULSE CHARACTERISTICS OF INFRARED, VISIBLE OR ULTRAVIOLET LIGHT; COLORIMETRY; RADIATION PYROMETRY
- G01J3/00—Spectrometry; Spectrophotometry; Monochromators; Measuring colours
- G01J3/02—Details
- G01J3/0205—Optical elements not provided otherwise, e.g. optical manifolds, diffusers, windows
- G01J3/0218—Optical elements not provided otherwise, e.g. optical manifolds, diffusers, windows using optical fibers
-
- G—PHYSICS
- G01—MEASURING; TESTING
- G01J—MEASUREMENT OF INTENSITY, VELOCITY, SPECTRAL CONTENT, POLARISATION, PHASE OR PULSE CHARACTERISTICS OF INFRARED, VISIBLE OR ULTRAVIOLET LIGHT; COLORIMETRY; RADIATION PYROMETRY
- G01J3/00—Spectrometry; Spectrophotometry; Monochromators; Measuring colours
- G01J3/02—Details
- G01J3/10—Arrangements of light sources specially adapted for spectrometry or colorimetry
-
- G—PHYSICS
- G01—MEASURING; TESTING
- G01J—MEASUREMENT OF INTENSITY, VELOCITY, SPECTRAL CONTENT, POLARISATION, PHASE OR PULSE CHARACTERISTICS OF INFRARED, VISIBLE OR ULTRAVIOLET LIGHT; COLORIMETRY; RADIATION PYROMETRY
- G01J3/00—Spectrometry; Spectrophotometry; Monochromators; Measuring colours
- G01J3/12—Generating the spectrum; Monochromators
- G01J3/18—Generating the spectrum; Monochromators using diffraction elements, e.g. grating
- G01J3/1838—Holographic gratings
-
- G—PHYSICS
- G01—MEASURING; TESTING
- G01J—MEASUREMENT OF INTENSITY, VELOCITY, SPECTRAL CONTENT, POLARISATION, PHASE OR PULSE CHARACTERISTICS OF INFRARED, VISIBLE OR ULTRAVIOLET LIGHT; COLORIMETRY; RADIATION PYROMETRY
- G01J3/00—Spectrometry; Spectrophotometry; Monochromators; Measuring colours
- G01J3/28—Investigating the spectrum
- G01J3/2823—Imaging spectrometer
-
- G—PHYSICS
- G01—MEASURING; TESTING
- G01N—INVESTIGATING OR ANALYSING MATERIALS BY DETERMINING THEIR CHEMICAL OR PHYSICAL PROPERTIES
- G01N21/00—Investigating or analysing materials by the use of optical means, i.e. using sub-millimetre waves, infrared, visible or ultraviolet light
- G01N21/62—Systems in which the material investigated is excited whereby it emits light or causes a change in wavelength of the incident light
- G01N21/63—Systems in which the material investigated is excited whereby it emits light or causes a change in wavelength of the incident light optically excited
- G01N21/65—Raman scattering
Definitions
- the present disclosure generally relates to spectroscopy systems and, more particularly, to a single detector based spectroscopy system employing dual illumination sources along with a configurable holographic spectrum analyzer for customizable simultaneous spectral displays.
- Modem spectroscopy systems rely on various optical properties of samples under investigation to elicit information about a sample's chemical and physical structure (e.g., chemical, molecular, or elemental composition), characteristics, and properties.
- a sample's spectrum may provide one or more of such information depending on the spectroscopy method employed for the investigation.
- Some examples of spectroscopy methods include Raman spectroscopy, infrared spectroscopy, fluorescence spectroscopy, mass spectrometry, x-ray diffractometry, etc. Each spectroscopy method may have a different level of specificity or discriminatory power.
- a Raman spectrum generally has higher discriminatory power than a fluorescence spectrum and, hence, Raman spectroscopy is generally considered more specific for the identification of an unknown material.
- Raman scattered signals are typically far weaker than fluorescence emissions and, hence, Raman spectroscopy systems may require more sensitive signal collection optics and more selective data processing techniques to collect and process weaker Raman signals.
- pros and cons of various spectroscopy systems e.g., cost, speed, accuracy, specificity, sensitivity, etc. should be considered prior to selecting a spectroscopy approach for the application at hand.
- FIG. 1 illustrates a prior art fiber array spectral translator (FAST) based spectroscopy system 10 that may be used for Raman spectroscopy.
- an object or sample 12 is shown to receive illumination from an illumination or excitation source 16 (e.g., a monochromatic illumination or laser illumination). Radiation reflected, emitted, or scattered from various illuminated regions in the sample 12 may be collected by collection unit 20 (e.g., a microscope objective) before the collected signal is fed to a two-dimensional ( 2 D) array 22 of optical fibers as indicated by exemplary arrows 18 and 19 depicting optical signal propagation path from the sample 12 to the 2D fiber array 22 .
- an illumination or excitation source 16 e.g., a monochromatic illumination or laser illumination
- 2 D two-dimensional
- the FAST system 10 Three exemplary regions in the sample 12 are indicated by reference numerals 14 A (cross-hatched circle), 14 B (filled circle), and 14 C (a circular ring).
- one end of the fiber bundle i.e., the end receiving optical signals from the collection unit 20
- the other end of the fiber bundle is shown arranged in a one-dimensional (1D) curvilinear array 24 .
- the FAST system 10 may be considered to transform a 2D field of view (FOV) into a ID arrangement at the entrance of a spectrometer slit 27 as shown in FIG. 1 .
- FOV 2D field of view
- each fiber in the 2D fiber bundle 22 may image a certain portion of the sample-as indicated by linking of three exemplary sample regions 14 A- 14 C with corresponding fibers in the 2D fiber bundle-here, fibers numbered “21,”“18,” and “7,” respectively in the exemplary set of thirty fibers (numbered from “1” through “30” in FIG. 1 ) in the 2D fiber bundle 22 .
- the optical data set i.e., photons reflected, emitted, or scattered from the illuminated sample 12
- collected by all the thirty (30) fibers at the 2D end 22 is fed through the 1D curvilinear end 24 into the slit 27 of the spectrograph 26 .
- the spectrograph 26 may be a holographic grating-based spectrometer, which may be coupled to an optical detector 28 (e.g., a charge coupled device or CCD) to store fiber-specific spectral information in the corresponding CCD rows as illustrated by three exemplary highlighted bars 14 A- 14 C in a layout 30 of a CCD output array having an X-Y resolution of 1024 ⁇ 1024 pixels.
- the reference numerals 14 A- 14 C are used to indicate how correspondence is maintained among the similarly-numbered regions of interest in the sample 12 , the corresponding fibers receiving optical data from these regions of interest (i.e., the fibers numbered “21,” “18,” and “7,” respectively), and the CCD rows storing fiber-specific spectral information.
- spectral information from the region 14 A in the sample 12 may be collected by the fiber # 21 (in the exemplary set of 30 fibers shown in FIG. 1 ) and may be stored as corresponding electrical charge in one of the rows in the CCD.
- spectral content from other regions on the sample may also be stored in corresponding CCD rows to obtain a 2D image of the entire illuminated FOV (field of view) of the sample.
- a third dimension for the 2D CCD layout 30 may be defined from the spectral information of the entire illuminated FOV of the sample 12 .
- each row in the CCD layout 30 is numbered from 1 through 30 to correspond with the total number of fibers in the FAST fiber bundle.
- each CCD row represents a fiber-specific output from a fiber associated with that row, and that each fiber-specific output may contain a plurality of wavelengths that may be represented as various “columns” (not shown in the layout 30 in FIG. 1 ) in the CCD output 30 .
- each CCD column can be redefined to a wavelength-specific 2D spatial image corresponding to the fiber bundle architecture and CCD storage mechanism.
- a plurality of such wavelength-specific 2D spatial images 32 - 1 through 32 - n are illustrated in FIG. 1 as forming a hyperspectral image cube 34 formed from the spectral data stored in various CCD “columns” (along the X-axis), wherein, as noted before, each CCD column represents a wavelength-specific spatial (image) information collected by the FAST fibers and stored along the Y-axis.
- the third dimension may represent the individual wavelengths and can be defined by the spectral information of the CCD rows. This spectral information represents the material characteristic information of the illuminated FOV of the sample 12 as is known in the art.
- This spectral information represents the material characteristic information of the illuminated FOV of the sample 12 as is known in the art.
- mapping of spectral data from a sample region of interest across all wavelengths (along the Z-axis) is illustrated by dotted lines linking a spatial location of a region of interest (e.g., the region 14 A) through all the spatial image frames 32 - 1 through 32 - n.
- FIG. 2 depicts an exemplary Raman spectrum 40 collected from a sample 12 by one of the fibers in the FAST system 10 of FIG. 1 .
- this spectrum may represent charge collected at one of the CCD rows corresponding to the fiber at issue.
- the entire CCD may thus contain spectral data from many such fibers—each CCD row may contain information to represent a similar Raman spectrum.
- the spectrum 40 may represent an average of all Raman spectra collected by all FAST fibers in the system 10 .
- the fibers may collect light reflected, emitted, or scattered from the sample 12 . Therefore, the actual spectral data content in the CCD rows may reflect fluorescence data as well as Raman data.
- the spectrum 40 in FIG. 2 is obtained after appropriate removal of the fluorescence portion and after the baseline adjustments are carried out. These procedures are not illustrated or discussed herein for the sake of brevity.
- a “typical” Raman spectrum 40 may include a fingerprint region 42 , a C-H (carbon-hydrogen) stretch region 44 , and a substantially less significant intervening region 46 . It may be desirable to focus on or explore the fingerprint region 42 (which represents more information about chemical and physical characteristic of a sample under investigation), and sometimes the C-H stretch region 44 (which may provide information about carbon-hydrogen bonds in the sample material), in more detail in many spectroscopy applications. It may be further desirable to be able to have the fingerprint region 42 and the C-H stretch region 44 displayed simultaneously on a single display monitor or screen. For additional spectroscopic analysis, it may be also desirable to have simultaneous display of two user-selected spectral regions of interest, which may not necessarily include the fingerprint region 42 or the C-H stretch region 44 .
- sample 12 it may be desirable to devise a system containing multiple illumination sources so that the sample 12 can be illuminated with different laser excitation wavelengths and resulting multiple sample spectra can be comparatively observed for a more fruitful analysis of sample spectral responses (and, hence, sample properties) under different excitations.
- the present disclosure relates to a method that comprises illuminating a sample with first photons having a first excitation wavelength and collecting first spectral data from second photons reflected, scattered, or emitted from the sample when the sample is illuminated with the first photons.
- the first spectral data are collected using a first portion of an optical detector.
- the method also comprises illuminating the sample with third photons having a second excitation wavelength, wherein the second excitation wavelength is different from the first excitation wavelength.
- the method further comprises collecting second spectral data from fourth photons reflected, scattered, or emitted from the sample when the sample is illuminated with the third photons, wherein the second spectral data are collected using a second portion of the optical detector without removing the first spectral data collected by the first portion.
- the present disclosure relates to a method that comprises displaying a first spectrum of a sample obtained when the sample is illuminated with first photons having a first excitation wavelength; displaying a second spectrum of the sample obtained when the sample is illuminated with second photons having a second excitation wavelength, wherein the second excitation wavelength is different from the first excitation wavelength; and allowing a user to select a first spectral region of the first spectrum and a second spectral region of the second spectrum.
- the method also comprises performing the following in response to selection of the first and the second spectral regions by the user; (i) illuminating the sample with the first photons; (ii) configuring a holographic spectrum analyzer to perform the following: receive a portion of third photons reflected, scattered, or emitted from the sample when the sample is illuminated with the first photons, and supply those of the third photons that are associated with only the first spectral region to a first portion of an optical detector; (iii) illuminating the sample with the second photons; and (iv) configuring the holographic spectrum analyzer to further perform the following: receive a portion of fourth photons reflected, scattered, or emitted from the sample when the sample is illuminated with the second photons, and supply those of the fourth photons that are associated with only the second spectral region to a second portion of the optical detector, wherein the first and the second portions of the optical detector are different, and wherein the first and the second portions together constitute the entire
- the present disclosure relates to a system that comprises a first illumination source for illuminating a sample with first photons having a first excitation wavelength; an optical detector having a first portion and a second portion that together constitute the entire spectral data collection surface of the optical detector, wherein the first portion is different from the second portion, and wherein the first portion of the optical detector is configured to collect first spectral data from second photons reflected, scattered, or emitted from the sample when the sample is illuminated with the first photons.
- the system also includes a second illumination source for illuminating the sample with third photons having a second excitation wavelength, wherein the second excitation wavelength is different from the first excitation wavelength; and the second portion of the optical detector that is configured to collect second spectral data from fourth photons reflected, scattered, or emitted from the sample when the sample is illuminated with the third photons, wherein the optical detector is configured to collect the second spectral data without removing the first spectral data collected by the first portion.
- a single detector based spectroscopy system uses FAST (fiber array spectral translator) fibers and two excitation sources in conjunction with a holographic spectrum analyzer (HSA) to obtain simultaneous and selective display of spectroscopic regions of interest.
- FAST fiber array spectral translator
- HSA holographic spectrum analyzer
- the HSA may be configured to focus on user-selected spectral regions of interest from different such spectra and a single CCD detector may be configured to collect spectral data from all selected spectral regions of interest in corresponding portions of the CCD pixel array, thereby allowing subsequent simultaneous display of such selected spectral regions of interest.
- the HSA may also allow simultaneous collection and display of portions of a single spectrum from a single excitation wavelength. A user can perform better comparative analysis when spectral regions of interest are juxtaposed with each other on a single electronic display.
- FIG. 1 illustrates a prior art fiber array spectral translator (FAST) based spectroscopy system that may be used for Raman spectroscopy;
- FAST fiber array spectral translator
- FIG. 2 depicts an exemplary Raman spectrum collected from a sample by one of the fibers in the FAST system of FIG. 1 ;
- FIG. 3 illustrates two exemplary Raman spectra that may be obtained when a sample is illuminated with two different laser excitation wavelengths
- FIG. 4 depicts an exemplary FAST based Raman spectroscopy system according to one embodiment of the present disclosure that is configured to accommodate two illumination light sources and collect spectral portions of interest from both light sources using a single detector in conjunction with a spectral analysis system;
- FIG. 5 illustrates an exemplary display of two spectra representing an average of fingerprint portions of corresponding Raman spectra obtained from optical data collected by the fibers in the FAST fiber bundle in the system in FIG. 4 when the sample is illuminated with respective excitation wavelengths ⁇ ex1 and ⁇ ex2 (wherein ⁇ ex2 > ⁇ ex1 );
- FIG. 6 shows a partial schematic of a modified version of the FAST based Raman spectroscopy system in FIG. 4 according to another embodiment of the present disclosure.
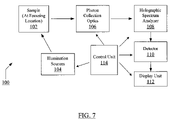
- FIG. 7 illustrates a block diagram of an exemplary Raman and/or fluorescence spectroscopy system according to one embodiment of the present disclosure.
- present disclosure relates to a single detector based spectroscopy system employing dual illumination sources along with a configurable holographic spectrum analyzer for customizable simultaneous spectral displays.
- sample responses to different illumination wavelengths may not be identical.
- An exemplary utility of such selective focusing may be evident from the discussion of FIG. 3 hereinbelow.
- FIG. 3 illustrates two exemplary Raman spectra 47 , 49 that may be obtained when a sample is illuminated with two different laser excitation wavelengths— ⁇ ex1 and ⁇ ex2 .
- the Raman spectrum 47 associated with the second excitation wavelength may have better resolution in the spectroscopic region of interest.
- the fingerprint region 48 from the higher excitation wavelength has better resolution (e.g., closely spaced peaks) than the corresponding fingerprint region 50 from the lower excitation wavelength.
- the spectrum 47 with better resolution may have lower free spectral range (FSR) (i.e., spectral separation between two consecutive passbands or spectral peaks) than the FSR in the spectrum 49 with lower resolution as can be observed from the spectral plots 47 , 49 in FIG. 3 .
- FSR free spectral range
- FIG. 4 depicts an exemplary FAST based Raman spectroscopy system 55 according to one embodiment of the present disclosure that is configured to accommodate two illumination light sources 58 , 60 and collect spectral portions of interest from both light sources using a single detector 73 in conjunction with a spectral analysis system.
- the spectral analysis system includes a holographic spectrum analyzer 70 . It is noted that in the system 10 of FIG. 1 , after the illumination of the FOV, the optical material information will be collected by a fiber bundle and spectrally resolved through the spectrograph 26 and visualized through a 2D CCD detector 28 . However, in contrast with the system 10 in FIG. 1 , the system 55 in FIG.
- HSA holographic spectrum analyzer
- the system 55 may be implemented as part of an imaging spectroscopy apparatus (e.g., a spectral imaging microscope, a Raman chemical or molecular imaging system, a chemical imaging spectrometer, etc.). Similarly, the systems illustrated in FIGS. 6 and 7 (and discussed later hereinbelow) may also be implemented as part of such spectroscopy apparatuses.
- an imaging spectroscopy apparatus e.g., a spectral imaging microscope, a Raman chemical or molecular imaging system, a chemical imaging spectrometer, etc.
- FIGS. 6 and 7 may also be implemented as part of such spectroscopy apparatuses.
- the system 55 may be used in various other spectroscopy applications including, for example, fluorescence spectroscopy, NIR (near infrared) spectroscopy, etc.
- suitable excitation sources 58 , 60 may be selected as is known to one skilled in the art.
- the illumination sources 58 , 60 may provide monochromatic excitation of specific wavelengths ⁇ ex1 and ⁇ ex2 , respectively.
- ⁇ ex2 > ⁇ ex1 .
- the illumination sources 58 , 60 may provide illuminating photons with wavelengths selected from the wavelengths in the ultraviolet (UV) region, visible light region, or the infrared (including NIR and far infrared) region of the electromagnetic spectrum.
- suitable illumination or excitation sources may include, for example, lasers, UV LEDs (light emitting diodes), etc.
- a sample (or object under investigation) 57 is shown to obliquely receive illuminating photons from two different illumination sources 58 , 60 .
- a single illumination source (not shown) capable of providing two or more different excitation wavelengths may also be used.
- a non-oblique illumination e.g., vertical illumination
- Some exemplary samples may includes chemical or biological substances, hazardous materials, bio-chemical materials or objects, etc. Photons reflected, emitted, or scattered from the sample 57 in response to the sample's reception of illuminating photons from one or more excitation sources 58 , 60 may be collected by collection optics in the system 55 .
- photon collection optics may include a lens unit 64 and a FAST fiber bundle having a 2D end 66 and a curvilinear (1D) end 68 as shown by way of illustration in FIG. 4 .
- the lens unit 64 may include one or more optical lenses (e.g., lens assembly of a microscope objective) providing photons collected from the illuminated sample 57 to the 2D array 66 of the fiber bundle.
- the fiber bundle of the FAST system acts as a conduit of optical signals received from the sample 57 .
- FIG. 1 the fiber bundle of the FAST system acts as a conduit of optical signals received from the sample 57 .
- the fiber bundle in the system 55 is shown to be comprised of thirty ( 30 ) exemplary fibers arranged in a 2D array 66 proximate to the lens unit 64 .
- the total number of fibers may be different (e.g., more or less than the 30 fibers shown in FIG. 4 ) in other embodiments.
- the optical signals received by the 2D array of optical fibers 66 are fed to an entrance slit 71 of the holographic spectrum analyzer 70 via the curvilinear (1D) end 68 of the FAST fiber bundle.
- the photon collection optics may provide the received photons to the spectral analysis system to obtain, for example, a spectrum of the sample under investigation to analyze the sample content in more detail.
- the spectral analysis system includes a gratings-based dispersive spectrograph in the form of the holographic spectrum analyzer (HSA) 70 .
- the terms “illumination,” “illuminating,” and “excitation” are used interchangeably as can be evident from the context.
- the terms “illumination source” and “excitation source” are used interchangeably.
- the terms “illuminating photons” and “excitation photons” are also used interchangeably.
- the discussion provided herein is in the context of Raman spectroscopy, various systems described herein may be used for Raman and/or fluorescence spectroscopy or other different spectroscopy applications as desired.
- the terms “optical signal” and “optical data” may be used interchangeably, and the terms “spectral signal” and “spectral data” may also be used interchangeably.
- optical data and “spectral data” sometimes may be used interchangeably because of the essentially optical nature of information collected and processed in the system 55 (and also in systems in FIGS. 6 and 7 ). However, it is understood that, for ease of discussion, the term “optical data” may be used to refer to those optical information containing signals that are not yet processed by the HSA 70 . Optical signals processed by the HSA 70 may be referred to as “spectral data.” However, as noted before, the distinction between the terms “optical data” and “spectral data” is not a rigid one and the interchangeable use of these terms is equally contemplated and made clear from the context of discussion herein.
- the spectral data-containing signals received at the slit 71 of the HSA 70 are dispersed by the spectrometer gratings (not shown) to provide wavelength-specific spectral content of the photons received from the illuminated sample 57 .
- the HSA 70 may provide spectral data to the optical detector 73 for further processing and display as discussed below.
- the detector 73 is a 2D CCD array with 1024 ⁇ 1024 pixel resolution.
- CMOS complementary metal oxide semiconductor
- other similar imaging device may be used instead of the CCD as desired.
- the embodiment in FIG. 1 the embodiment in FIG.
- the holographic spectrum analyzer 70 may be configured to focus on spectral portions of interest as discussed below.
- the holographic spectrum analyzer 70 may be constructed according to the teachings of U.S. Pat. No. 6,839,136 (the '136 patent), the disclosure of which is incorporated herein by reference in its entirety.
- the HSA 70 may separate wavelength information spectrally to allow for focusing on desired portion of the entire spectrum. For example, in an application of the HSA 70 to a Raman spectrum (e.g., the Raman spectrum 40 in FIG. 2 ) from a single illumination source (e.g., when the sample 57 is illuminated by only one of the excitation sources 58 or 60 in FIG. 4 ), if the fingerprint region (e.g., the region 42 in FIG.
- the HSA 70 may be properly configured to provide spectral data for only the selected fingerprint portion to the CCD 73 coupled thereto. Additional spectral data associated with other spectral regions may be blocked from the CCD 73 .
- the HSA 70 may be obtained from Headwall Photonics, Inc., of Fitchburg, Mass., USA.
- the HSA 70 may be configured to provide selected focused spectral data obtained from the first illumination wavelength ( ⁇ ex1 ) to a first portion 75 of the CCD 73 and the other relevant spectral data obtained from the second illumination wavelength ( ⁇ ex2 ) to a second portion 76 of the CCD 73 as illustrated by an exemplary view of a 2D CCD layout or pixel array 74 , wherein storage of such divided content is illustrated by an artificial divider line 78 .
- the divider line 78 is for illustration only. In practice, there may not be any such physical division or splitting of CCD pixels (whether row-wise or column-wise) or divisional marking on the CCD pixel array 74 .
- the division of spectral contents from two different excitation wavelengths may be optically and electronically performed by the HSA 70 without the need for a physical division of the CCD pixel array.
- the storage pixels (not shown) in the CCD array 74 may be considered to have been split row-wise or column-wise to collect corresponding spectral data from the HSA 70 .
- the HSA 70 may be configured to store appropriate spectral data into corresponding portions of the CCD array 74 , which data may be then collected and displayed as discussed below with reference to FIG. 5 .
- the terms “row” or “column” as used herein in the context of a 2D CCD array 74 are for ease of discussion and context of reference only, and should not be construed to rigidly define the CCD pixel geometry in any specific orientations or formats. It is evident that the two CCD portions 75 , 76 may together constitute the entire spectral data collection surface 74 of the CCD 73 as can be seen from the exemplary layout 74 in FIG. 4 . Furthermore, in one embodiment, the pixels constituting the two CCD portions 75 , 76 may be physically non-overlapping.
- more than one excitation wavelength may be used to collect specific spectrally-resolved material information using the HSA 70 and a single, 2D CCD detector 73 .
- the optical signals containing spectrally-resolved material information from the different excitation wavelengths may be collected in a specific CCD region due to a customizable holographic grating architecture of the HSA 70 .
- Raman imaging applications it may be possible to collect scattered light from the illuminated FOV (Raman) of the sample 57 together with emitted light (luminescence).
- the material-specific Raman information may be identical for both excitation wavelengths.
- the spectral information in case of Raman signals from two different excitation wavelengths may be the same except for the spectral resolution; the spectral resolution will be higher with longer wavelength excitation as mentioned earlier.
- the luminescence/fluorescence information may be different for the illuminated FOV of the sample for the different excitation wavelengths. Therefore, the use of more than one excitation wavelength and the customized collection of specific spectrally-resolved optical information (Raman and/or luminescence) with one HSA 70 and a single CCD 73 can allow a user to get material-specific information in a 2D image format with additional environmental information (e.g., the kind and degree of impurities due to the characteristic of the spectrally resolved luminescence information from the sample 57 ).
- the excitations may be applied sequentially.
- the sample 57 may be first illuminated with the laser excitation wavelength ⁇ ex1 and Raman spectral data of the fingerprint region (not shown) collected by the FAST fibers may be focused using the HSA 70 and collected in the appropriate portion 75 of the CCD 73 . Thereafter, the sample 57 may be illuminated with the second laser wavelength ⁇ ex2 and the Raman spectral data of the corresponding fingerprint region (not shown) may be collected in the appropriate portion 76 using the combination of the HSA 70 and CCD 73 as discussed before.
- the gratings (not shown) in the HSA 70 need not be re-aligned.
- the collection of the spectral data in the second portion 76 may be performed without removing the earlier-collected spectral data in the first portion 75 .
- laser excitations 58 , 60 may be applied substantially simultaneously to the sample 57 .
- the sample may be considered as being divided into two non-overlapping sample regions (not shown).
- the first region (not shown) of the sample 57 may be illuminated with the first excitation wavelength ( ⁇ ex1 ) whereas the second, non-overlapping region (not shown) of the sample 57 may be simultaneously illuminated with the second excitation wavelength ( ⁇ ex2 ). It is observed here that all the thirty (30) fibers in the fiber bundle may not receive optical signals from all the regions of the sample in this case.
- half of the fibers in the 2D bundle 66 may receive optical information from a corresponding region of the sample 57 , whereas the other half of the fibers may receive optical data from the other region of the sample when, for example, the sample is considered to be vertically divided into substantially two equal regions (not shown).
- the optical data received from the illuminated sample regions by corresponding fibers may be then processed through the HSA 70 and CCD 73 combination.
- half of the rows in the 2D CCD array 74 may contain spectral data from the corresponding half of the fibers, whereas the other half of the rows may contain spectral data from the remaining half of the fibers.
- the divider line 78 may be considered to be placed horizontally (as opposed to the vertical depiction in FIG. 4 ) dividing the CCD columns into half.
- An exemplary illustration of such division is provided by the divider line 99 in FIG. 6 , which is discussed later hereinbelow.
- the divider line 78 is for illustration only, and should not be considered as implying any rigid physical, electronic, or optical division of CCD pixel array 74 . From the foregoing discussion, it is evident that the combination of the HSA 70 and CCD 73 may be configured to flexibly store spectral data from multiple excitation sources in corresponding portions (row-wise or column-wise) of the 2D CCD array 74 .
- the HSA 70 may be electronically controlled in such a manner that, initially, only one excitation (e.g., at wavelength ⁇ ex1 ) may be applied and the spectral data from each fiber (from the exemplary fiber bundle of thirty fibers numbered “1” through “30” in FIG. 4 ) for the entire Raman spectrum may be collected at the CCD 73 using the entire spectral data collection surface 74 of the CCD 73 . Thereafter, a user may view an average of the collected spectra (from all fibers) to then focus on a portion of the average spectrum that the user wishes to view in more detail.
- only one excitation e.g., at wavelength ⁇ ex1
- the spectral data from each fiber from the exemplary fiber bundle of thirty fibers numbered “1” through “30” in FIG. 4
- the entire Raman spectrum may be collected at the CCD 73 using the entire spectral data collection surface 74 of the CCD 73 .
- a user may view an average of the collected spectra (from all
- the sample 57 may be illuminated again with the same excitation wavelength (here, ⁇ ex1 ) and HSA 70 may be suitably programmed to provide the spectral data for only the relevant fingerprint region (from the first excitation wavelength) to the appropriate portion (e.g., portion 75 ) of the CCD 73 for collection and further analysis.
- HSA 70 may be suitably programmed to provide the spectral data for only the relevant fingerprint region (from the first excitation wavelength) to the appropriate portion (e.g., portion 75 ) of the CCD 73 for collection and further analysis.
- such focused spectral data may be collected by the entire CCD array 74 (i.e., in both of the portions 75 and 76 ).
- the above procedure may be repeated to first enable the user to focus on or select another appropriate spectral region of interest from the second excitation wavelength. Thereafter, the sample 57 may be illuminated again with the same second excitation wavelength (here, ⁇ ex2 ) and HSA 70 may be configured to provide the spectral data for only the second selected spectral region (from the second excitation wavelength) for collection in the corresponding CCD portion (e.g., portion 76 ) without affecting prior collection and storage of the first spectral data in the other CCD portion 75 .
- spectral data for selected. excitation-specific spectral regions of interest may be collected in the 2D CCD pixel array 74 for later simultaneous (juxtaposed) display of corresponding spectral regions as discussed below with reference to FIG. 5 .
- FIG. 5 illustrates an exemplary display 80 of two spectra 82 , 84 representing an average of fingerprint portions of corresponding Raman spectra (e.g., similar to spectra 47 and 49 in FIG. 3 ) obtained from optical data collected by the fibers in the FAST fiber bundle in the system in FIG. 4 when the sample 57 is illuminated with respective excitation wavelengths ⁇ ex1 and ⁇ ex2 (wherein ⁇ ex2 > ⁇ ex1 )
- the simultaneous display of two spectral regions 82 , 84 may be obtained using the system 55 in FIG. 4 to electronically split the CCD rows into two portions to store separate spectral data therein from the HSA 70 as discussed earlier.
- the excitation-specific optical data portions can be then processed and displayed in a juxtaposed manner on an electronic display unit or screen (e.g., a liquid crystal display screen or a computer monitor) (not shown) as illustrated in the exemplary display 80 of FIG. 5 .
- an electronic display unit or screen e.g., a liquid crystal display screen or a computer monitor
- the fingerprint portion 82 associated with a lower excitation wavelength ( ⁇ ex1 ) has less resolution (but, better free spectral range (FSR)) as compared to the fingerprint portion 84 obtained from a higher excitation wavelength ( ⁇ ex2 ).
- the fingerprint portion 82 may be considered an average of corresponding fingerprint regions 50 ( FIG. 3 ), whereas the fingerprint portion 84 may represent an average of corresponding fingerprint regions 48 ( FIG. 3 ).
- the spectrum from a higher excitation wavelength may represent higher spectral groove density, which translates into better resolution.
- the X-axis (or horizontal axis) representing Raman shift may contain different wavenumbers for the different spectral regions of interest.
- the Raman shift scale is depicted to contain wavenumbers in the range of 900 to 2400.
- the fingerprint region 84 is depicted along a different Raman shift scale from 1200 to 2100 wavenumbers.
- their plots may be depicted along different Raman shift scales without the need to truncate any spectra or conform one spectral scale to the other.
- the spectral displays 82 , 84 from two different excitation wavelengths may be depicted independently of each other.
- a combination of spectra obtained from different spectroscopy methods may be simultaneously displayed using the configuration of HSA 70 and CCD 73 in the system 55 of FIG. 4 .
- the first CCD portion 75 may contain Raman spectral data whereas the second portion 76 may contain fluorescence spectral data, or vice versa.
- both CCD portions 75 - 76 may contain luminescence spectral data as opposed to Raman spectral data as discussed hereinbefore.
- Different other spectral data storage configurations may be devised using the teachings of the present disclosure.
- FIG. 6 shows a partial schematic of a modified version of the FAST based Raman spectroscopy system 55 in FIG. 4 according to another embodiment of the present disclosure. Because of substantial similarity between various components in the system 55 ( FIG. 4 ) and the system 90 in FIG. 6 , similar reference numerals are used in FIG. 6 for identical or functionally similar components between the systems in FIGS. 4 and 6 . Furthermore, discussion of components common between the systems in FIGS. 4 and 6 is not repeated herein for the sake of brevity. Also, for ease of illustration, the two illumination sources 58 , 60 , the sample 57 , the lens unit 64 and 2D FAST fiber bundle 66 , are not shown in FIG. 6 even though these components are part of the system 90 .
- HSA holographic spectrum analyzer
- the HSA 96 may include two separate slits 94 , 95 .
- the single slit based HSA 70 may be modified to include two separate slits to selectively receive photons of two different wavelengths (as discussed below with reference to the HSA 96 in FIG. 6 ).
- columns in the 2D CCD pixel array 74 is shown divided into half by an artificial and exemplary divider line 99 . Because of such division, the pixels in the CCD layout 74 may be considered as being partitioned into two portions 97 , 98 .
- the portions 97 , 98 may be physically non-overlapping and may together constitute the spectral data collection surface of the CCD 73 .
- the horizontal division (as shown by the exemplary divider line 99 in FIG. 6 ) of the CCD array 74 may provide better spectral resolution (e.g., along x-axis) than the vertical division (as shown by the exemplary divider line 78 in FIG. 4 ).
- the vertical division in FIG. 4 may provide better spatial resolution (e.g., along y-axis) as compared to the horizontal division in FIG. 6 .
- each CCD portion 97 , 98 may store spectral data from substantially more individual wavelengths in the spectral region of interest selected by the HSA 96 because of availability of the full spectral range of the CCD 73 (e.g., 1024 pixels along the x-axis) to store data received from each optical fiber.
- the CCD 73 e.g., 1024 pixels along the x-axis
- there may be 1024/30 34 (approximately) pixels per fiber line in the embodiment of FIG.
- the spatial resolution per fiber line in the embodiment of FIG. 6 may be approximately half (i.e., 17 pixels) of the spatial resolution in the embodiment of FIG. 4 .
- the sample 57 may be sequentially illuminated by a green laser excitation ( ⁇ ex1 ) 58 followed by a red laser excitation ( ⁇ ex2 ) or vice versa.
- the beam splitter 92 may not split the wavelengths of photons received from the ID fiber bundle 68 because of presence of only one excitation wavelength at a time.
- the beam splitter 92 may be configured to transmit 80% of photons from one excitation wavelength in one direction (e.g., towards the slit 94 ) and transmit 80% of photons from another excitation wavelength in another direction (e.g., towards the slit 95 as indicated by the dotted path) as discussed later below.
- the embodiment in FIG. 6 illustrates that when the sample 57 is illuminated just with the green excitation, photons from all 30 fibers and from all spectral regions of interest (e.g., CH-region, fingerprint region, etc.) may be initially received by the HSA 96 via the slit 94 .
- the LISA 96 may be then configured to provide photons from user-selected spectral portions of interest to the CCD 72 for a simultaneous display of selected spectral portions as per the teachings of one embodiment of the present disclosure.
- the spectral data of the CH region from green excitation is shown collected by the CCD portion 97
- the spectral data of the fingerprint portion from green excitation is shown collected by the CCD portion 98 .
- These spectral regions of interest may be later displayed simultaneously on a single display screen as discussed hereinbefore.
- spectral data from user-desired spectral regions of interest may be collected in different portions of the CCD array 74 .
- the HSA 96 may be configured to first provide spectral data from the green CH and fingerprint regions to portions 97 , 98 , respectively, as discussed before. Thereafter, upon red excitation, the beam splitter 92 may provide photons from all spectral regions of interest (e.g., CH region, fingerprint region, etc.) to the slit 94 . The HSA 96 may be configured to provide photons from one of the user-selected spectral region of interest (e.g., red fingerprint region) to one of the CCD portions 97 , 98 , thereby replacing the earlier stored spectral data therein.
- the user-selected spectral region of interest e.g., red fingerprint region
- the Raman spectral data may exhibit less background fluorescence (i.e., stronger signal-to-noise ratio or SNR).
- SNR signal-to-noise ratio
- a parallel illumination of the sample 57 with green and red lasers simultaneously may allow for simultaneous collection of spectral data from green and red fingerprint regions so as to enable a user to compare or contrast the two spectral regions (with different levels of fluorescence background noise) from the same sample 57 , which may further enable the user to calculate or reconstruct the weak (green) fingerprint spectrum from the stronger (red) fingerprint spectrum juxtaposed therewith.
- the higher spectral resolution may further allow a more detailed comparison of the selected spectral regions of interest.
- the beam splitter 92 may split photons associated with green and red excitations in such a manner that green excitation-related photons may be sent to the HSA slit 94 whereas the red excitation-related photons may be substantially simultaneously sent to the HSA slit 95 (as indicated by the exemplary dotted line).
- the HSA 96 may be configured such that it may simultaneously and selectively process optical signals received at its two slits 94 , 95 , and provide Raman spectral data of green fingerprint region to the CCD portion 98 , while substantially simultaneously providing Raman spectral data of red fingerprint region to the CCD portion 97 .
- spectral data of user-selected spectral regions of interest may be simultaneously collected and displayed using a two slit-based HSA 96 in combination with a “split” CCD 73 as discussed herein.
- each excitation-specific set of photons may be supplied by all of the fibers in the fiber bundle 68 . Therefore, each portion 97 , 98 of the CCD array 74 may receive corresponding excitation-specific photons collected from the illuminated sample 57 by all the thirty ( 30 ) fibers, albeit at a reduced spatial resolution as discussed hereinbefore. Therefore, although the CCD layout 74 depicts two sets of thirty (30) fibers—each set of thirty ( 30 ) fibers shown associated with a corresponding one of the CCD portions 97 , 98 —it is evident from the discussion here that the CCD portion-specific sets of fibers are for illustration purpose only. Actually, in the system 90 in FIG. 6 , there may be only one physical set of thirty optical fibers in the fiber bundle to receive photons reflected, emitted, or scattered from the sample 57 when the sample 57 is simultaneously illuminated by two different excitation wavelengths.
- FIG. 7 illustrates a block diagram of an exemplary Raman and/or fluorescence spectroscopy system 100 according to one embodiment of the present disclosure.
- the system 100 may be a dual-excitation, FAST-based spectroscopy unit with a single detector (e.g., one of the systems shown in FIGS. 4 and 6 ) as per the teachings of the present disclosure.
- the system 100 may include multiple illumination sources 102 (e.g., laser diodes, or LEDs) that directly provide illuminating photons to a sample 104 .
- the sample 104 may be placed on a receptacle (not shown) that is a part of the system 100 .
- an assembly including the sample 104 and its receptacle may be placed within the system 100 whenever needed during operation of the system 100 .
- there are two illumination sources in the system 100 providing photons of different excitation wavelengths as in the case of embodiments in FIGS. 4 and 6 .
- the sample 104 may interact with the illuminating photons to provide reflected, scattered, or emitted photons, which photons may be initially collected by the photon collection optics 106 and transferred to a spectral analysis unit 108 .
- the photon collection optics 106 may include a lens assembly either alone or in combination with a laser line rejection filter (not shown).
- the photon collection optics 106 may also include a FAST (fiber array spectral translator) fiber bundle optically coupled to the lens assembly as illustrated, for example, in the embodiments of FIGS. 4 and 6 .
- FAST fiber array spectral translator
- the photon collection optics 106 may direct all or a portion of the Raman scattered or fluorescence (emitted) photons received from the sample to the spectral analysis unit 108 , which may be a dispersive (e.g., gratings-based) holographic spectrum analyzer (HSA) as shown in the exemplary embodiments of FIGS. 4 and 6 .
- the HSA 108 may measure a spectrum of the sample 104 under investigation and may be configured to select an excitation-specific spectral region of interest (e.g., a fingerprint region) and provide photons associated only with the selected spectral region of interest to an optical detector 110 .
- an excitation-specific spectral region of interest e.g., a fingerprint region
- the optical detector 10 may be a CCD (charge coupled device) array.
- the detector 110 may include a CMOS (complementary metal oxide semiconductor) array.
- the detector 10 may be configured to generate data that can be used to display spectral images of the sample 104 .
- the detector 110 may detect photons associated with selected spectral regions of interest (e.g., a wavelength-dispersed optical signal) and received from HSA 108 .
- the CCD pixels in the detector 110 may thus collect spectral data associated with selected spectral regions of interest and the detector 110 may then generate signal data therefrom.
- the signal data may be supplied to an electronic display unit 112 to provide a simultaneous display of selected spectral regions of interest as shown, for example, in FIG. 5 .
- the display unit 112 may be a computer display screen, a display monitor, or an LCD (liquid crystal display) screen.
- the spectroscopy system 100 may use two illumination sources in combination with a single CCD 110 and the HSA 108 to provide simultaneous displays of selected spectral regions of interest.
- the spectroscopy system 100 may be implemented in the form of a desktop unit or a compact, mobile spectroscopy unit (e.g., for portable or handheld spectroscopy applications).
- the spectroscopy system 100 may also include a programmable control unit 114 , which can be suitably programmed to electronically control functionalities of one or more of the system elements including, for example, each illumination source in the group of illumination sources 102 , the collection optics 106 , the spectral analysis unit 108 , the detector 110 , and the display unit 112 as shown by the exemplary illustration in FIG. 7 .
- the control unit 114 may be a computing or data processing unit that can be suitably programmed for collecting and processing spectral information from the samples under investigation.
- a single detector based spectroscopy system using FAST (fiber array spectral translator) fibers and two excitation sources in conjunction with a holographic spectrum analyzer (HSA) to obtain simultaneous and selective display of spectroscopic regions of interest.
- FAST fiber array spectral translator
- HSA holographic spectrum analyzer
- the HSA may be configured to focus on user-selected spectral regions of interest from different such spectra and a single CCD detector may be configured to collect spectral data from all selected spectral regions of interest in corresponding portions of the CCD pixel array, thereby allowing subsequent simultaneous display of such selected spectral regions of interest.
- the HSA may also allow simultaneous collection and display of portions of a single spectrum from a single excitation wavelength. A user can perform better comparative analysis when spectral regions of interest are juxtaposed with each other on a single electronic display.
Abstract
Description
Claims (28)
Priority Applications (1)
| Application Number | Priority Date | Filing Date | Title |
|---|---|---|---|
| US12/017,409 US7609370B2 (en) | 2007-01-23 | 2008-01-22 | Single detector based dual excitation wavelength spectra display |
Applications Claiming Priority (2)
| Application Number | Priority Date | Filing Date | Title |
|---|---|---|---|
| US88189407P | 2007-01-23 | 2007-01-23 | |
| US12/017,409 US7609370B2 (en) | 2007-01-23 | 2008-01-22 | Single detector based dual excitation wavelength spectra display |
Publications (2)
| Publication Number | Publication Date |
|---|---|
| US20080212079A1 US20080212079A1 (en) | 2008-09-04 |
| US7609370B2 true US7609370B2 (en) | 2009-10-27 |
Family
ID=39732829
Family Applications (1)
| Application Number | Title | Priority Date | Filing Date |
|---|---|---|---|
| US12/017,409 Active 2028-04-16 US7609370B2 (en) | 2007-01-23 | 2008-01-22 | Single detector based dual excitation wavelength spectra display |
Country Status (1)
| Country | Link |
|---|---|
| US (1) | US7609370B2 (en) |
Cited By (4)
| Publication number | Priority date | Publication date | Assignee | Title |
|---|---|---|---|---|
| US20090066947A1 (en) * | 2005-04-04 | 2009-03-12 | Chem1Mage Corporation | Method and apparatus for interactive hyperspectral image subtraction |
| US20110204258A1 (en) * | 2009-12-11 | 2011-08-25 | Heller Daniel A | Spectral imaging of photoluminescent materials |
| US10180248B2 (en) | 2015-09-02 | 2019-01-15 | ProPhotonix Limited | LED lamp with sensing capabilities |
| US10678145B2 (en) * | 2017-04-06 | 2020-06-09 | Asml Netherlands B.V. | Radiation receiving system |
Families Citing this family (6)
| Publication number | Priority date | Publication date | Assignee | Title |
|---|---|---|---|---|
| JP5433517B2 (en) * | 2010-07-14 | 2014-03-05 | 株式会社日立ハイテクノロジーズ | Analysis apparatus and analysis method |
| CN102435311B (en) * | 2011-09-07 | 2014-05-07 | 杭州远方光电信息股份有限公司 | Optical fiber bundle spectrometer |
| US8937715B2 (en) | 2012-06-04 | 2015-01-20 | Kaiser Optical Systems | Optical spectrometer dynamic range balancing methods and apparatus |
| US11555430B1 (en) * | 2019-03-15 | 2023-01-17 | Emissions Science Corporation | Device and method for reducing emissions from an internal combustion engine |
| CN112595440B (en) * | 2020-12-30 | 2022-11-01 | 西安和其光电科技股份有限公司 | Spectrum calibration method for optical fiber thermometer |
| WO2023228452A1 (en) * | 2022-05-27 | 2023-11-30 | 浜松ホトニクス株式会社 | Spectroscopic device, raman spectroscopic measurement device, and spectroscopic method |
Citations (5)
| Publication number | Priority date | Publication date | Assignee | Title |
|---|---|---|---|---|
| US5757483A (en) * | 1997-08-06 | 1998-05-26 | Stellarnet, Inc. | Dual beam optical spectrograph |
| US6526076B2 (en) | 2000-12-15 | 2003-02-25 | Agilent Technologies, Inc. | Integrated parallel channel optical monitoring for parallel optics transmitter |
| US6717133B2 (en) | 2001-06-13 | 2004-04-06 | Agilent Technologies, Inc. | Grating pattern and arrangement for mass spectrometers |
| US6839136B2 (en) | 2000-02-01 | 2005-01-04 | Agilent Technologies, Inc. | Holographic grating spectrum analyzer |
| US7397561B2 (en) * | 2005-11-07 | 2008-07-08 | Wafermasters, Incorporated | Spectroscopy system |
-
2008
- 2008-01-22 US US12/017,409 patent/US7609370B2/en active Active
Patent Citations (5)
| Publication number | Priority date | Publication date | Assignee | Title |
|---|---|---|---|---|
| US5757483A (en) * | 1997-08-06 | 1998-05-26 | Stellarnet, Inc. | Dual beam optical spectrograph |
| US6839136B2 (en) | 2000-02-01 | 2005-01-04 | Agilent Technologies, Inc. | Holographic grating spectrum analyzer |
| US6526076B2 (en) | 2000-12-15 | 2003-02-25 | Agilent Technologies, Inc. | Integrated parallel channel optical monitoring for parallel optics transmitter |
| US6717133B2 (en) | 2001-06-13 | 2004-04-06 | Agilent Technologies, Inc. | Grating pattern and arrangement for mass spectrometers |
| US7397561B2 (en) * | 2005-11-07 | 2008-07-08 | Wafermasters, Incorporated | Spectroscopy system |
Cited By (5)
| Publication number | Priority date | Publication date | Assignee | Title |
|---|---|---|---|---|
| US20090066947A1 (en) * | 2005-04-04 | 2009-03-12 | Chem1Mage Corporation | Method and apparatus for interactive hyperspectral image subtraction |
| US7956991B2 (en) * | 2005-04-04 | 2011-06-07 | Chemimage Corporation | Method and apparatus for interactive hyperspectral image subtraction |
| US20110204258A1 (en) * | 2009-12-11 | 2011-08-25 | Heller Daniel A | Spectral imaging of photoluminescent materials |
| US10180248B2 (en) | 2015-09-02 | 2019-01-15 | ProPhotonix Limited | LED lamp with sensing capabilities |
| US10678145B2 (en) * | 2017-04-06 | 2020-06-09 | Asml Netherlands B.V. | Radiation receiving system |
Also Published As
| Publication number | Publication date |
|---|---|
| US20080212079A1 (en) | 2008-09-04 |
Similar Documents
| Publication | Publication Date | Title |
|---|---|---|
| US7609370B2 (en) | Single detector based dual excitation wavelength spectra display | |
| US7046359B2 (en) | System and method for dynamic chemical imaging | |
| US7626696B2 (en) | Method and apparatus for reconfigurable field of view in a FAST-based imaging system | |
| US9014430B2 (en) | Image analysis platform for identifying artifacts in samples and laboratory consumables | |
| US8310669B2 (en) | Spectroscopic imaging method and system for exploring the surface of a sample | |
| US7471389B2 (en) | System and method for fiber array spectral translator based polymorph screening | |
| US7629591B2 (en) | System and method for structured illumination and collection for improved optical confocality of raman fiber array spectral translator imaging and interactive raman probing | |
| US8098373B2 (en) | Spatially and spectrally parallelized fiber array spectral translator system and method of use | |
| US20060050278A1 (en) | Method and apparatus for extended hyperspectral imaging | |
| US7242468B1 (en) | Method and apparatus for microlens array/fiber optics imaging | |
| US8158957B2 (en) | System and method for structured illumination and collection for improved optical confocality of raman fiber array spectral translator imaging and interactive raman probing | |
| US20170045450A1 (en) | Method and Apparatus for Nondestructive Quantification of Cannabinoids | |
| US7471386B2 (en) | System and method for spectral unmixing in a fiber array spectral translator based polymorph screening system | |
| US7060955B1 (en) | Apparatus and method for defining illumination parameters of a sample | |
| Kiselev et al. | Design and first applications of a flexible Raman micro-spectroscopic system for biological imaging | |
| US20130082180A1 (en) | Multipoint Method for Assessing a Biological Sample | |
| US20070171409A1 (en) | Method and apparatus for dense spectrum unmixing and image reconstruction of a sample | |
| US20060170916A1 (en) | Method and apparatus for variable-field illumination | |
| US7701572B2 (en) | System and method for chemical imaging of microarrays | |
| Pappas et al. | Raman imaging for two-dimensional chemical analysis | |
| Kung et al. | Development of an ultraspectral imaging system by using a concave monochromator | |
| Gooding et al. | Fast, cheap and in control: spectral imaging with handheld devices | |
| WO2009020450A1 (en) | Method and apparatus for reconfigurable field of view in a fast-based imaging system | |
| RU108608U1 (en) | MICROSCOPE WITH A COMPACT RAMAN-LUMINESCENT ANALYZER | |
| US20230309834A1 (en) | Hadamard-transform fluorescence excitation-emission-matrix imaging systems |
Legal Events
| Date | Code | Title | Description |
|---|---|---|---|
| AS | Assignment |
Owner name: CHEMIMAGE CORPORATION, PENNSYLVANIA Free format text: ASSIGNMENT OF ASSIGNORS INTEREST;ASSIGNORS:VOIGT, THOMAS;TUSCHEL, DAVID;REEL/FRAME:020452/0964;SIGNING DATES FROM 20080129 TO 20080130 Owner name: CHEMIMAGE CORPORATION, PENNSYLVANIA Free format text: ASSIGNMENT OF ASSIGNORS INTEREST;ASSIGNORS:VOIGT, THOMAS;TUSCHEL, DAVID;SIGNING DATES FROM 20080129 TO 20080130;REEL/FRAME:020452/0964 |
|
| AS | Assignment |
Owner name: CHEMIMAGE CORPORATION, PENNSYLVANIA Free format text: ASSIGNMENT OF ASSIGNORS INTEREST;ASSIGNORS:VOIGT, THOMAS;TUSCHEL, DAVID;REEL/FRAME:020789/0411 Effective date: 20080411 |
|
| AS | Assignment |
Owner name: CHEMIMAGE CORPORATION, PENNSYLVANIA Free format text: ASSIGNMENT OF ASSIGNORS INTEREST;ASSIGNOR:MAIER, JOHN;REEL/FRAME:020824/0271 Effective date: 20080418 Owner name: CHEMIMAGE CORPORATION, PENNSYLVANIA Free format text: CORRECTIVE ASSIGNMENT TO CORRECT THE CHANGE ASSIGNEE NAME FROM CHEMIMAGE TO CHEMIMAGE CORPORATION PREVIOUSLY RECORDED ON REEL 020789 FRAME 0411. ASSIGNOR(S) HEREBY CONFIRMS THE THOMAS VOIGT AND DAVID TUSCHEL TO CHEMIMAGE CORPORATION.;ASSIGNORS:VOIGT, THOMAS;TUSCHEL, DAVID;REEL/FRAME:020826/0645 Effective date: 20080418 Owner name: CHEMIMAGE CORPORATION, PENNSYLVANIA Free format text: CORRECTIVE ASSIGNMENT TO CORRECT THE CHANGE ASSIGNEE NAME FROM CHEMIMAGE TO CHEMIMAGE CORPORATION PREVIOUSLY RECORDED ON REEL 020789 FRAME 0411. ASSIGNOR(S) HEREBY CONFIRMS THE THOMAS VOIGT AND DAVID TUSCHEL TO CHEMIMAGE CORPORATION;ASSIGNORS:VOIGT, THOMAS;TUSCHEL, DAVID;REEL/FRAME:020826/0645 Effective date: 20080418 |
|
| STCF | Information on status: patent grant |
Free format text: PATENTED CASE |
|
| FPAY | Fee payment |
Year of fee payment: 4 |
|
| AS | Assignment |
Owner name: CHEMIMAGE TECHNOLOGIES LLC, PENNSYLVANIA Free format text: ASSIGNMENT OF ASSIGNORS INTEREST;ASSIGNOR:CHEMIMAGE CORPORATION;REEL/FRAME:030573/0454 Effective date: 20130530 |
|
| FPAY | Fee payment |
Year of fee payment: 8 |
|
| SULP | Surcharge for late payment |
Year of fee payment: 7 |
|
| MAFP | Maintenance fee payment |
Free format text: PAYMENT OF MAINTENANCE FEE, 12TH YR, SMALL ENTITY (ORIGINAL EVENT CODE: M2553); ENTITY STATUS OF PATENT OWNER: SMALL ENTITY Year of fee payment: 12 |