US7503896B2 - Method and apparatus for the noninvasive assessment of hemodynamic parameters including blood vessel location - Google Patents
Method and apparatus for the noninvasive assessment of hemodynamic parameters including blood vessel location Download PDFInfo
- Publication number
- US7503896B2 US7503896B2 US09/815,982 US81598201A US7503896B2 US 7503896 B2 US7503896 B2 US 7503896B2 US 81598201 A US81598201 A US 81598201A US 7503896 B2 US7503896 B2 US 7503896B2
- Authority
- US
- United States
- Prior art keywords
- blood vessel
- tissue
- blood
- pressure
- lumen
- Prior art date
- Legal status (The legal status is an assumption and is not a legal conclusion. Google has not performed a legal analysis and makes no representation as to the accuracy of the status listed.)
- Expired - Fee Related, expires
Links
Images


Classifications
-
- A—HUMAN NECESSITIES
- A61—MEDICAL OR VETERINARY SCIENCE; HYGIENE
- A61B—DIAGNOSIS; SURGERY; IDENTIFICATION
- A61B5/00—Measuring for diagnostic purposes; Identification of persons
- A61B5/02—Detecting, measuring or recording pulse, heart rate, blood pressure or blood flow; Combined pulse/heart-rate/blood pressure determination; Evaluating a cardiovascular condition not otherwise provided for, e.g. using combinations of techniques provided for in this group with electrocardiography or electroauscultation; Heart catheters for measuring blood pressure
- A61B5/02028—Determining haemodynamic parameters not otherwise provided for, e.g. cardiac contractility or left ventricular ejection fraction
-
- A—HUMAN NECESSITIES
- A61—MEDICAL OR VETERINARY SCIENCE; HYGIENE
- A61B—DIAGNOSIS; SURGERY; IDENTIFICATION
- A61B5/00—Measuring for diagnostic purposes; Identification of persons
- A61B5/48—Other medical applications
- A61B5/4887—Locating particular structures in or on the body
- A61B5/489—Blood vessels
-
- A—HUMAN NECESSITIES
- A61—MEDICAL OR VETERINARY SCIENCE; HYGIENE
- A61B—DIAGNOSIS; SURGERY; IDENTIFICATION
- A61B5/00—Measuring for diagnostic purposes; Identification of persons
- A61B5/68—Arrangements of detecting, measuring or recording means, e.g. sensors, in relation to patient
- A61B5/6801—Arrangements of detecting, measuring or recording means, e.g. sensors, in relation to patient specially adapted to be attached to or worn on the body surface
- A61B5/6802—Sensor mounted on worn items
- A61B5/6804—Garments; Clothes
- A61B5/6806—Gloves
-
- A—HUMAN NECESSITIES
- A61—MEDICAL OR VETERINARY SCIENCE; HYGIENE
- A61B—DIAGNOSIS; SURGERY; IDENTIFICATION
- A61B5/00—Measuring for diagnostic purposes; Identification of persons
- A61B5/68—Arrangements of detecting, measuring or recording means, e.g. sensors, in relation to patient
- A61B5/6801—Arrangements of detecting, measuring or recording means, e.g. sensors, in relation to patient specially adapted to be attached to or worn on the body surface
- A61B5/6843—Monitoring or controlling sensor contact pressure
-
- A—HUMAN NECESSITIES
- A61—MEDICAL OR VETERINARY SCIENCE; HYGIENE
- A61B—DIAGNOSIS; SURGERY; IDENTIFICATION
- A61B8/00—Diagnosis using ultrasonic, sonic or infrasonic waves
- A61B8/04—Measuring blood pressure
-
- A—HUMAN NECESSITIES
- A61—MEDICAL OR VETERINARY SCIENCE; HYGIENE
- A61B—DIAGNOSIS; SURGERY; IDENTIFICATION
- A61B8/00—Diagnosis using ultrasonic, sonic or infrasonic waves
- A61B8/42—Details of probe positioning or probe attachment to the patient
- A61B8/4209—Details of probe positioning or probe attachment to the patient by using holders, e.g. positioning frames
- A61B8/4227—Details of probe positioning or probe attachment to the patient by using holders, e.g. positioning frames characterised by straps, belts, cuffs or braces
-
- A—HUMAN NECESSITIES
- A61—MEDICAL OR VETERINARY SCIENCE; HYGIENE
- A61B—DIAGNOSIS; SURGERY; IDENTIFICATION
- A61B5/00—Measuring for diagnostic purposes; Identification of persons
- A61B5/02—Detecting, measuring or recording pulse, heart rate, blood pressure or blood flow; Combined pulse/heart-rate/blood pressure determination; Evaluating a cardiovascular condition not otherwise provided for, e.g. using combinations of techniques provided for in this group with electrocardiography or electroauscultation; Heart catheters for measuring blood pressure
- A61B5/021—Measuring pressure in heart or blood vessels
- A61B5/022—Measuring pressure in heart or blood vessels by applying pressure to close blood vessels, e.g. against the skin; Ophthalmodynamometers
-
- A—HUMAN NECESSITIES
- A61—MEDICAL OR VETERINARY SCIENCE; HYGIENE
- A61B—DIAGNOSIS; SURGERY; IDENTIFICATION
- A61B5/00—Measuring for diagnostic purposes; Identification of persons
- A61B5/72—Signal processing specially adapted for physiological signals or for diagnostic purposes
- A61B5/7225—Details of analog processing, e.g. isolation amplifier, gain or sensitivity adjustment, filtering, baseline or drift compensation
-
- A—HUMAN NECESSITIES
- A61—MEDICAL OR VETERINARY SCIENCE; HYGIENE
- A61B—DIAGNOSIS; SURGERY; IDENTIFICATION
- A61B5/00—Measuring for diagnostic purposes; Identification of persons
- A61B5/72—Signal processing specially adapted for physiological signals or for diagnostic purposes
- A61B5/7235—Details of waveform analysis
- A61B5/7253—Details of waveform analysis characterised by using transforms
- A61B5/726—Details of waveform analysis characterised by using transforms using Wavelet transforms
Definitions
- This invention relates generally to methods and apparatus for monitoring the hemodynamic parameters of a living subject, and specifically to the non-invasive monitoring of arterial blood pressure using acoustic techniques.
- auscultation uses a standard inflatable arm cuff that occludes the subject's brachial artery.
- the auscultatory technique determines the subject's systolic and diastolic pressures by monitoring certain Korotkoff sounds that occur as the cuff is slowly deflated.
- the oscillometric technique determines these pressures, as well as the subject's mean pressure, by measuring actual pressure changes that occur in the cuff as the cuff is deflated.
- Both techniques determine pressure values only intermittently, because of the need to alternately inflate and deflate the cuff, and they cannot replicate the subject's actual blood pressure waveform. Thus, true continuous, beat-to-beat blood pressure monitoring cannot be achieved using these techniques.
- Occlusive cuff instruments of the kind described briefly above generally have been effective in sensing long-term trends in a subject's blood pressure. However, such instruments generally have been ineffective in sensing short-term blood pressure variations, which are of critical importance in many medical applications, including surgery.
- the technique of arterial tonometry is also well known in the medical arts.
- the pressure in a superficial artery with sufficient bony support, such as the radial artery may be accurately recorded during an applanation sweep when the transmural pressure equals zero.
- the term “applanation” refers to the process of varying the pressure applied to the artery.
- An applanation sweep refers to a time period during which pressure over the artery is varied from overcompression to undercompression or vice versa. At the onset of a decreasing applanation sweep, the artery is overcompressed into a “dog bone” shape, so that pressure pulses are not recorded.
- the artery is undercompressed, so that minimum amplitude pressure pulses are recorded.
- an applanation occurs during which the arterial wall tension is parallel to the tonometer surface.
- the arterial pressure is perpendicular to the surface and is the only stress detected by the tonometer sensor.
- the maximum peak-to-peak amplitude (the “maximum pulsatile”) pressure obtained corresponds to zero transmural pressure.
- FIG. 1 Note that in FIG. 1 , bone or another rigid member is assumed to lie under the artery.
- One prior art device for implementing the tonometry technique includes a rigid array of miniature pressure transducers that is applied against the tissue overlying a peripheral artery, e.g., the radial artery.
- the transducers each directly sense the mechanical forces in the underlying subject tissue, and each is sized to cover only a fraction of the underlying artery.
- the array is urged against the tissue, to applanate the underlying artery and thereby cause beat-to-beat pressure variations within the artery to be coupled through the tissue to at least some of the transducers.
- An array of different transducers is used to ensure that at least one transducer is always over the artery, regardless of array position on the subject. This type of tonometer, however, is subject to several drawbacks.
- the array of discrete transducers generally is not anatomically compatible with the continuous contours of the subject's tissue overlying the artery being sensed. This has historically led to inaccuracies in the resulting transducer signals. In addition, in some cases, this incompatibility can cause tissue injury and nerve damage and can restrict blood flow to distal tissue.
- Prior art tonometry systems are also quite sensitive to the orientation of the pressure transducer on the subject being monitored. Specifically, such systems show a degradation in accuracy when the angular relationship between the transducer and the artery is varied from an “optimal” incidence angle. This is an important consideration, since no two measurements are likely to have the device placed or maintained at precisely the same angle with respect to the artery.
- the invention disclosed herein addresses the foregoing needs by providing an improved apparatus and method for non-invasively monitoring the arterial blood pressure of a subject.
- an improved method for measuring the mean arterial blood pressure in a subject comprises placing both a pressure transducer and ultrasonic transducer over an artery of the subject; varying the pressure applied to the artery to compress (applanate) the artery from a state of overcompression to a state of undercompression; measuring the arterial pressure via the aforementioned pressure transducer as a function of time; generating acoustic pulses via the ultrasonic transducer; measuring at least one parameter (such as the blood velocity and time-frequency distribution as a function of time using the frequency shifts produced by the pulses); and correlating the at least one parameter to the mean arterial pressure (MAP).
- MAP mean arterial pressure
- the foregoing acoustic pulses are used to assist in placement of the transducers on the subject's wrist so as to maximize the signal-to-noise ratio associated with the blood pressure measurement.
- the amplitude of echoes received by the ultrasonic transducer is measured by an ultrasound receiver circuit as the transducer is moved transversely across the artery of interest; the transducer is positioned using a fuzzy logic control circuit such that the amplitude of the echoes is minimized.
- an improved tonometric apparatus useful for non-invasively and continuously measuring the mean arterial pressure (MAP) in a subject.
- the apparatus includes both a pressure transducer and an ultrasonic transducer which, in conjunction with supporting signal processing circuitry, measure both the arterial applanation and arterial blood velocity, respectively. These transducers are mated to the interior surface of the subject's wrist.
- the transducers and their associated processing circuitry track the blood velocity in the radial artery during applanation sweeps; i.e., the time period beginning when the artery is overcompressed, and ending when the artery is undercompressed, by emitting acoustic pulses and measuring the Doppler shift in the returns or reflections of the acoustic energy from cells present in the blood.
- the time-frequency distribution is determined from the velocity data, as calculated by an algorithm running on a digital signal processor (DSP).
- DSP digital signal processor
- the time at which the time-frequency distribution is maximized corresponds to the time at which the transmural pressure equals zero, and the mean pressure read by the pressure transducer equals the MAP.
- the measurements of applanation and blood velocity using the apparatus are largely unaffected by the orientation of the transducers on the subject's wrist.
- an improved applanation and transverse positioning motor assembly for use with the above described tonometric apparatus.
- the assembly includes a first motor for applanation (compression) of the artery in response to fuzzy logic signals from a control circuit, as well as a second motor operatively connected to an ultrasonic receiver (and associated fuzzy logic control circuit) for transverse positioning of the transducer(s) over the artery.
- the motor assembly is coupled to the transducers and rigidly received within a wrist brace described below such that the applanation motor exerts compressive force against the subject's artery via reaction force against the wrist brace.
- an improved method and apparatus for estimating catheter diastolic blood pressure intermittently, and estimating catheter systolic and diastolic pressure continuously.
- the method comprises estimating the catheter diastolic blood pressure intermittently; comparing the estimated catheter diastolic pressure to the sensed diastolic pressure to determine a scaling factor; applying the scaling factor to the sensor waveform; and catheter systolic and diastolic blood pressures estimated continuously.
- an improved method for the location of a blood vessel within the tissue of a living subject generally comprises generating acoustic energy; transmitting the acoustic energy into the tissue of the subject in the vicinity of a blood vessel; receiving at least a portion of the energy backscattered by the blood vessel; detecting at least one artifact associated with the blood vessel based on the backscattered energy; and determining the location of the blood vessel based at least in part on the detected artifact.
- the blood vessel comprises the radial artery of a human being, and the acoustic energy comprises ultrasonic energy transmitted into the artery via the interior region of the subject's wrist/forearm. Energy backscattered from the artery walls and lumen is received by an ultrasonic transducer and analyzed using an integrated power metric to identify the location of, and/or optimal position of, the transducer with respect to the artery.
- integrated power and/or signal level is analyzed as a function of depth within the tissue to detect the location of the lumen.
- the location of the artery walls is then determined relative to the lumen, thereby allowing measurement of the diameter of the artery.
- the position of transducer relative to the artery is adjusted so as to maximize the wall separation (diameter), thereby effectively maintaining the transducer (and any associated applanation device) directly atop the artery.
- the algorithm may also be adjusted to maintain the transducer in any other desired orientation with respect to the blood vessel; e.g., with a fixed offset, with an offset which varies as a function of the diameter of the blood vessel, etc., or to control the position of the transducer based on other parameters such as signal quality, the presence of cystic components or clutter, and the like.
- FIG. 1 is a composite graph illustrating the cross-sectional shape of an artery as a function of applied pressure and time, as correlated to blood pressure waveforms, according to prior art arterial tonometry theory.
- FIG. 2 is a composite graph illustrating the cross-sectional shape of an artery as a function of applied pressure and time, illustrating the hypothesized mechanism behind the maximum time-frequency distribution applanation concept of the present invention.
- FIG. 3 a is a block diagram illustrating one embodiment of the method of measuring arterial blood pressure according to the present invention.
- FIG. 3 b is a block diagram illustrating a first embodiment of the method of estimating the time-frequency distribution used in conjunction with the method of FIG. 3 a.
- FIG. 3 c is a block diagram illustrating a second embodiment of the method of estimating the time-frequency distribution.
- FIGS. 4 a - 4 c are exemplary plots illustrating the relationship between pressure and time, blood velocity and time, and time-frequency distribution and time, respectively, based on typical data obtained using the method of FIGS. 3 a - 3 b.
- FIGS. 5 a - 5 b are functional block diagrams of two embodiments of ultrasound filter circuits useful for measurement of Doppler shift frequencies and stationary echoes.
- FIG. 6 is a functional block diagram of one embodiment of the arterial blood pressure monitoring device of the present invention.
- FIG. 7 is a block diagram of one embodiment of the ultrasound receiver circuit used in conjunction with the blood pressure monitoring device of FIG. 6 .
- FIG. 8 is a perspective view of one embodiment of the applanation and transverse positioning assembly of the invention.
- FIG. 9 is a cross-sectional view, including functional block diagram, of the blood pressure measurement system of the invention, taken along lines 9 - 9 of FIG. 8 .
- FIG. 10 is an exploded perspective view of one embodiment of the wrist brace of the present invention.
- FIG. 11 is a perspective view of the wrist brace of FIG. 10 shown fitted to the wrist of a subject, and having the applanation and positioning assembly of FIG. 8 mounted thereon.
- FIG. 12 is a block diagram illustrating one exemplary embodiment of the method of estimating catheter systolic and diastolic blood pressures according to the invention.
- FIG. 13 is a graph illustrating the relationship between estimated catheter pressure (using zeroeth order linear autoregression model) and actual measured catheter pressure for a typical subject.
- FIGS. 14 a - d are graphs representing the estimated arterial blood pressure, blood velocity, time-frequency distribution, and wavelet transform/derivative, respectively, of a typical test subject.
- FIG. 15 is a block diagram illustrating one exemplary embodiment of the method of estimating diastolic blood pressure according to the invention.
- FIG. 16 is a block diagram illustrating one exemplary embodiment of the method of isolating the “settling point” within an applanation sweep according to the invention.
- FIG. 17 is a graph illustrating the response of the servo algorithm of the invention to the time-variant arterial (catheter) blood pressure of a test subject.
- FIG. 18 is a graph illustrating three selected portions of the servo algorithm response of FIG. 17 in detail.
- FIG. 19 is a graph illustrating a selected portion of the data presented in FIG. 17 , demonstrating the self-correction response of the servo algorithm.
- FIG. 20 is a logical flow diagram illustrating one exemplary embodiment of the method of locating a blood vessel using lumen detection according to the invention.
- FIG. 20 a is a logical block diagram illustrating one exemplary embodiment of the method of processing A-mode signals per the method of FIG. 20 .
- FIG. 21 is a graphical representation of a “raw” A-mode signal as a function of depth within the tissue of the subject being monitored.
- FIG. 22 is graphical representation of the envelope derived from the raw A-mode data of FIG. 21 .
- FIG. 23 is a logical flow diagram illustrating the general methodology of quadrature demodulation and A-mode signal filtering according to the invention.
- FIG. 24 is a block diagram illustrating the method of quadrature demodulation of the A-mode signal according to the present invention.
- FIG. 25 is a graphical representation of the frequency response of one exemplary embodiment of the lowpass finite impulse response (FIR) filter of the present invention.
- FIG. 26 is a table listing an exemplary set of (FIR) coefficients used in the quadrature demodulation and filtering method of the present invention.
- FIG. 27 is a graphical representation of the envelope-squared waveform derived from the A-mode signal of FIG. 21 .
- FIG. 28 is a graphical representation of the logarithm (base 10 ) of the envelope-squared waveform of FIG. 27 .
- FIG. 29 is a graphical representation of the application of the gain function (TGC) to the envelope-squared of the A-mode signal of FIG. 27 .
- TGC gain function
- FIG. 30 a is a logical flow diagram illustrating the “plateau” method of lumen detection according to the invention.
- FIG. 30 b is a plot illustrating measured backscattered power as a function of depth for a single A-mode line.
- FIG. 30 c is a graphical representation of the normalized integrated power function according to the plateau method of FIG. 30 a.
- FIG. 30 d is a graphical representation of the plateau detection metric used in conjunction with the method of FIG. 30 a.
- FIG. 30 e is a graphical representation of the normalized plateau detection metric for a single A-mode line.
- FIG. 31 a is a graphical representation of the power profile (1 mm interval) along the TGC-corrected A-mode line of FIG. 29 .
- FIG. 31 b is a logical flow chart illustrating the “interval” methodology of lumen detection using A-mode signals according to the invention.
- FIG. 31 c is a functional block diagram illustrating one exemplary embodiment of the methodology of FIG. 28 b.
- FIG. 32 a is a logical flow chart illustrating a first exemplary methodology of front and back wall detection based on integrated power calculation.
- FIG. 32 b is a logical flow chart illustrating a second exemplary methodology of front and back wall detection based on envelope-squared signal level determination.
- FIG. 33 is a graphical representation of the relationship between the average power calculation and the front and back wall artifacts present in the typical A-mode envelope according to the method of FIG. 32 b.
- FIG. 34 is a graphical representation of the positions of the front and back walls of an exemplary blood vessel as a function of time (based on a sampling of 5000 A-mode signal lines) using the method of FIG. 32 b.
- FIG. 35 is a logical flow diagram illustrating one exemplary embodiment of the method of locating a blood vessel using lumen and wall detection according to the invention.
- the hypothesized maximum arterial diameter applanation concept of the present invention is described.
- the maximum pulsatile pressure is assumed to correspond to the state of zero transmural pressure; i.e., the point in time 102 when the arterial pressure is perpendicular to the arterial wall surface 104 and is the only pressure detected by the tonometer pressure transducer (not shown).
- prior art tonometry systems utilizing this theory measure the maximum peak-to-peak blood pressure within the artery, and correlate this pressure to a state of zero transmural pressure.
- the invention estimates the maximum time-frequency distribution during an applanation sweep.
- the maximum time-frequency distribution may be indicative of, inter alia, the maximum arterial diameter.
- the term “diameter” includes the actual diameter of a blood vessel measured in a particular dimension or direction and at a particular point in time, as well as any related parameters calculated based on the actual diameter to include, without limitation, mean diameter calculated over a particular time interval, mean diameter as a function of position on the blood vessel, and maximum diastolic diameter (Appendix A).
- the optimum applanation occurs at that point in time 201 during the applanation sweep when the external applied pressure has decreased sufficiently so that internal pressure may oppose it, allowing the sagittal arterial diameter to transiently increase to its maximum as a consequence of reactive hyperemia. This phenomenon may occur at the true mean arterial pressure, during which the transmural pressure equals zero, as shown in FIG. 2 .
- MAP Mean Arterial Pressure
- FIG. 3 a one embodiment of the maximum time-frequency method of measuring mean arterial pressure according to the present invention is described.
- pressure and ultrasonic transducers (described in greater detail below with reference to FIGS. 5 , 6 , and 7 ) are first positioned generally atop the radial artery of the subject in step 302 .
- the radial artery in the human runs longitudinally along the inner surface of the wrist and forearm below the surface tissue.
- Very precise transverse positioning of the ultrasonic and pressure transducers is accomplished in step 304 by generating a series of acoustic pulses, which produce echoes via interaction with tissue and/or red blood cells present in the artery.
- the amplitude of these echoes is measured as a function of position, and the transverse position of the transducer element is adjusted so that the amplitude is minimized.
- the echoes are mostly absorbed by the blood, as compared to absorption by tissue. Exact positioning over the artery increases the signal-to-noise ratio (SNR) and therefore accuracy of the blood pressure measurement.
- SNR signal-to-noise ratio
- Other embodiments of locating the blood vessel and positioning the apparatus of the invention with respect thereto are described subsequently herein in greater detail with respect to FIGS. 20-35 .
- a decreasing applanation sweep of the selected artery is commenced.
- the applanation sweep begins by overcompressing the artery against the underlying bone (or other rigid member) using the aforementioned pressure transducer such that a cross section similar to that shown in FIG. 2 is obtained. As the sweep progresses, the compression of the artery is gradually reduced until the artery is ultimately not compressed at all. During the progression of the applanation sweep, the pressure within the artery during each heartbeat is measured using the pressure transducer, and the mean value of each pressure waveform computed in step 307 .
- acoustic pulses are generated and transmitted into the artery using the ultrasonic transducer in step 308 .
- These pulses are reflected by various structures or entities within the artery (such as the artery walls, and the red blood cells within the subject's blood), and subsequently received as frequency shifts by the ultrasonic transducer in step 310 .
- the blood velocity and time-frequency distribution are calculated using the received frequency shifts. Specifically, the frequencies of those echoes reflected by blood cells within the blood flowing in the artery will differ from that of the transmitted acoustic pulses due to the motion of the blood cells. This well-known “Doppler shift” in frequency is used to calculate the blood velocity.
- the mean time-frequency distribution at 0 Hz is computed during each heartbeat in step 312 .
- the mean time-frequency distribution measurements obtained in step 312 are analyzed to locate the maximum mean time-frequency value occurring during the applanation sweep; the mean arterial pressure corresponding to the maximum time-frequency distribution is then identified in step 338 . This mean arterial pressure value is then provided to the user as the MAP in step 340 .
- the first sub-step 314 of step 312 comprises using the Doppler frequency, f d , and Eqn. 1 to obtain the mean blood velocity,
- f d ⁇ c 2 ⁇ f 0 ⁇ cos ⁇ ⁇ ⁇ , ( Eqn . ⁇ 1 )
- f o the transmitted signal frequency
- ⁇ the transmission angle of the acoustic energy referenced to a vector normal to the longitudinal axis of the artery
- c the speed of sound in soft tissue.
- a time-frequency representation is a two-dimensional mapping of the fraction of the energy of a one-dimensional signal at time, t, and angular frequency, 107 .
- This joint energy density, P(t, ⁇ ) is commonly referred to as a “probability distribution” or “distribution”, referring to its historical utility in quantum mechanics. This distribution is described in sub-step 316 of FIG. 3 using the form shown in Eqn. 2:
- Eqn . ⁇ 4 is equivalent to direct integration of the autocorrelation of a signal, scaled by a factor of 2. Autocorrelation is well known in the signal processing arts. In sub-step 326 , Eqn. 4 is divided by a factor of 2. Lastly, in sub-step 330 , the mean distribution value is calculated for each heartbeat or pressure waveform time interval.
- FIGS. 4 a - 4 c are exemplary plots illustrating the relationship between measured radial arterial blood pressure and time ( FIG. 4 a ), radial blood velocity and time ( FIG. 4 b ), and the Pseudo Wigner distribution and time ( FIG. 4 c ), based on typical data obtained using the method of FIG. 3 a .
- the characteristic peak in the Pseudo Wigner distribution results from a large peak trend in the baseline of the blood velocity signal, also known as the end-diastolic velocity ( FIG. 4 b ).
- the peak in the Pseudo Wigner distribution at a frequency of 0 Hz may indicate when this sudden arterial diameter increase occurs. From Eqn. 1, it is known that the mean blood velocity is proportional to the Doppler shift frequency.
- the low frequencies in the phase echo are proportional to the relative arterial diameter of the artery, d.
- the phase ⁇ of the detected echo is a function of the time delay between reflection from the near and far arterial walls. Because the time delay depends only on the time difference between reflections from the two arterial walls, the measurement is insensitive to transmission angle. Note that only the relative arterial diameter changes from an initial diameter value during overcompression can be estimated. The relative arterial diameter d is therefore related to the phase using Eqn. 7:
- a second embodiment of the method of calculating blood velocity and arterial diameter in conjunction with step 312 of FIG. 3 a is now described with respect to FIG. 3 c.
- diameter changes can be calculated by monitoring the sagittal near and far walls directly.
- stationary echoes are obtained in step 360 using a lowpass filter.
- the sagittal near and far wall echoes are identified in steps 362 and 364 , respectively, and the distance between them is used to calculate the arterial diameter over time in step 366 .
- step 368 the time-frequency distribution is equated to the square of the arterial diameter.
- FIGS. 5 a and 5 b illustrate two exemplary ultrasound filter circuits useful in performing the analysis of FIG. 3 c.
- FIG. 4 a the measured arterial blood pressure 400 generally declines with time, due to reduced applanation of the artery. Note that at some time after beginning the applanation sweep, in this example after approximately 15 seconds, the maximum pulsatile pressure (i.e., the largest peak-to-peak pressure difference) is experienced. At this point, the mean arterial blood pressure (MAP) 402 is approximately 165 mm Hg. At some further time, in this example after approximately 21 seconds, the mean time-frequency distribution ( FIG.
- the MAP 406 ( FIG. 4 a ) is approximately 144 mm Hg.
- the MAP measured during tonometric applanation 410 is closest to the average MAP measured using a prior art oscillometry device, at 137 mm Hg.
- prior art maximum pulsatile techniques are substantially less accurate than the “maximum time-frequency” method of the present invention.
- the maximum time-frequency method disclosed herein provides an excellent approximation of the actual mean arterial pressure (as measured by an oscillometry device). Note that noninvasive oscillometry measurement itself possesses an error when compared to the invasive gold standard measurement that utilizes an intra-arterial pressure catheter.
- the “maximum mean time-frequency” method disclosed herein is substantially insensitive to the orientation of the ultrasonic transducer with respect to the artery.
- numerous anecdotal measurements obtained by the applicant herein showed little variation under a broad range of angular pitch (i.e., rotation around an axis transverse to the longitudinal axis of the artery being measured) and roll (i.e., rotation around the longitudinal axis of the artery) values. It will be readily appreciated that such insensitivity affords great advantages to the user, since consistent results may be obtained with essentially no consideration to the angular position of the tonometric sensor(s).
- the received signal is amplified, and supplied to a radio frequency (RF) switch 504 .
- the switch gates the signal to the RF mixer 506 , which mixes the gated bursts with the original transmission frequency.
- RF radio frequency
- a lowpass filter of 1 MHz 507 is applied to remove the signal sideband frequencies and noise, although it will be appreciated that other filter frequencies may be used.
- a bandpass filter 508 with a cutoff frequencies of 300 Hz and 4 kHz is then applied to remove unwanted echoes from stationary tissue such as arterial walls. The output of the bandpass filter is further processed to obtain the mean Doppler shift frequencies.
- this bandpass filter can be replaced by a lowpass filter 510 with a cutoff of 40 Hz that isolates stationary echoes. The near and far walls would be identified from the stationary echoes and used to calculate changes in arterial diameter.
- the system 600 comprises pressure and ultrasonic transducers 602 , 604 which are placed in contact with the skin of the subject 606 during use.
- the pressure transducer 602 of the present embodiment is a silicon transducer of the type well known in the electrical arts, although other may be used. It will be recognized that the term “transducer” as used herein is meant to include any type of sensor capable of sensing or receiving one parameter and generating or transmitting a signal based thereon, or alternatively capable of receiving a signal and generating some physical response thereto.
- the pressure transducer 602 is connected to a first analog-to-digital converter (ADC) 608 , which converts the analog signal generated by the pressure transducer 602 to a digital representation.
- ADC analog-to-digital converter
- the digitized pressure signal is then supplied to a digital signal processor (DSP) 610 .
- DSP digital signal processor
- each pressure waveform is detected using wavelet transforms 612 . Wavelet transforms are known to those skilled in the art to easily detect edges, or in this case the onset of new waveforms, while noise is present.
- Each isolated waveform is then integrated to determine its mean arterial pressure value 614 .
- the ultrasonic transducer 604 generates and transmits an acoustic wave based on a first electrical signal applied thereto, and subsequently generates a second electrical signal upon receiving pressure waves in the form of echoes resulting from the transmitted acoustic waves.
- the first electrical signal is generated via an ultrasonic driving and receiving circuit 616 , which is described in greater detail with reference to FIG. 7 .
- the driving and receiving circuit 616 generates electrical pulses which, when applied to the transducer 604 , produce acoustic energy having a frequency on the order of 8 MHz, a pulse width or duration of approximately 8 microseconds, and a pulse repetition interval (PRI) of approximately 16 us, although other values of frequency, pulse width, and PRI may be used.
- PRI pulse repetition interval
- the transducer 604 of the present embodiment emits an 8 microsecond pulse, which is followed by an 8 microsecond “listen” period, every 16 microseconds.
- the echoes from these pulses are received by the ultrasonic transducer 604 during the listen period.
- the ultrasonic transducer 604 of the present embodiment is a silicon strain gauge or ceramic piezoelectric device of the type well known in the art, although other types may be substituted.
- the transducer 604 converts the received acoustic signal to an electrical signal, which is then supplied to the receiving section of the ultrasonic driver and receiver circuit 616 , which contains two receiver circuits.
- the output of the first receiver circuit is an analog signal representative of the Doppler frequency f d of the echo received by the transducer 604 .
- the analog output 617 is then converted to a digital representation by a second ADC 618 , and supplied to the DSP 610 .
- the digitized Doppler frequency is scaled to compute the blood velocity 620 within the artery
- the time-frequency distribution of the blood velocity 622 is then computed.
- the DSP maps in time the peak of the time-frequency distribution to the corresponding pressure waveform to produce the estimated MAP 624 , based on the method of FIG. 3 a described above.
- the output of the ultrasonic receiver circuit 616 is an analog echo signal proportional to absorption of the transmitted frequencies by blood or tissue. This analog signal is converted to a digital representation by a third ADC 640 and supplied to the DSP 610 . Within the DSP, each group of echoes, generated for a different transversal position, is integrated to determine a mean value 642 . The mean echo values are compared to determine the minimum value, which is caused by direct positioning over the artery.
- DSP 610 digital signal processing devices
- the use of such algorithms running on digital signal processing devices (such as the DSP 610 ) to perform mathematical calculations is well known in the signal processing arts, and accordingly will not be described further herein.
- the DSP's output signal is then converted to a form useful to the user such as a digital or analog display, computer data file, or audible indicator.
- an oscillator 670 generates a continuous square wave signal, having a fixed frequency of 8 MHz, for coupling to a gate logic circuit 672 and to an RF mixer 683 .
- the gate logic circuit transmits 8 us bursts of the 8 MHz signal, interrupted by 8 microsecond dead times.
- An RF shaper circuit 676 converts the resulting series of square wave bursts from the gate logic circuit 672 into corresponding sine wave bursts, for application through a transducer switch 677 , to the ultrasonic transducer 604 .
- the transducer switch 677 routes ultrasonic signals for both applanation and transverse positioning.
- the ultrasonic transducer 604 is thereby conditioned to transmit a succession of 8 MHz bursts of sonic energy into the adjacent wrist tissue.
- the transmitted bursts of sonic energy are scattered by red blood cells flowing through the subject's radial artery 680 , and a portion of the scattered energy is directed back toward the ultrasonic transducer 604 .
- the time required for the return energy to reach the ultrasonic transducer varies according to the speed of sound in the tissue and according to the depth of the artery. Typical transit times are in the range of 6 to 7 microseconds.
- the ultrasonic transducer 604 is used to receive the reflected ultrasound energy during the dead times between the successive transmitted bursts. For the applanation application, the ultrasonic transducer therefore produces a received signal, of relatively low magnitude, and this received signal is coupled to an RF amplifier 681 for amplification. The amplified signal is then supplied to an RF switch 682 , which gates the signal to the RF mixer 683 only during the dead times between successive transmitted bursts. The RF mixer 683 mixes these gated bursts with the original 8 MHz signal received from the oscillator.
- the frequency of the ultrasonic transducer's transmit signal will differ from that of the return signal, because the scattering red blood cells within the radial artery are moving.
- the return signal effectively, is frequency modulated by the blood flow velocity.
- the signal output by the RF mixer 683 will incorporate the 8 MHz fundamental frequency, as well as sum and difference frequencies of the transmit and return signals.
- This output signal is supplied to a lowpass filter 684 with cutoff frequency of 1 MHz, for removal of the 8 MHz fundamental frequency, as well as any higher-order harmonics from the difference frequencies.
- a bandpass filter 685 that ranges from 300 Hz to 4 KHz then removes all signal components other than those components representing the actual blood velocity.
- the signal output from the bandpass filter 685 is supplied to a zero-axis crossing detector 687 , which functions to produce a pulse each time the signal crosses a zero axis. These pulses are supplied to a frequency-to-voltage converter circuit 688 , which produces a DC output signal indicative of the mean Doppler frequencies.
- the signal output by the bandpass filter 685 is also supplied to an audio amplifier 690 , and in turn to a speaker 691 , to enable an operator to hear a representation of the Doppler signals and thereby to determine when the transducer is located approximately over the radial artery.
- the output of the gate logic circuit is also amplified via an amplifier 694 , and when transverse positioning is desired, switched to the ultrasonic transducer 604 .
- the received echoes are coupled to an RF amplifier 696 and output for further processing to determine minimum echo value as a function of position.
- FIGS. 5 a and 7 utilizes a preselected pulse duration of 8 microseconds and pulse repetition interval of 16 microseconds
- other acoustic sampling techniques may be used in conjunction with the invention.
- the acoustic pulses are range-gated with a more complex implementation of the gate logic.
- range-gating is a technique by which the pulse-to-pulse interval is varied based on the receipt of range information from earlier emitted and reflected pulses.
- the system may be “tuned” to receive echoes falling within a specific temporal window which is chosen based on the range of the echo-producing entity in relation to the acoustic source.
- the delay time before the gate is turned on determines the depth of the sample volume.
- the amount of time the gate is activated establishes the axial length of the sample volume.
- the acoustic source in this case the ultrasonic transducer 604
- the pulse repetition interval is shortened such that the system may obtain more samples per unit time, thereby increasing its resolution.
- other acoustic processing techniques may also be used, all of which are considered to fall within the scope of the claims appended hereto.
- FIG. 9 represents a cross-sectional view (including functional block diagram) of the blood pressure measurement system of the embodiment of FIG. 8 , taken along lines 9 - 9 of FIG. 8 .
- the device 800 is adapted to receive a transducer housing element 822 in the lower extensive portion thereof.
- the transducer housing element contains the aforementioned pressure and ultrasonic transducers 602 , 604 therein, the latter physically being combined into a single transducer element, although other configurations including a tandem ultrasonic/pressure configuration (not shown), or an array of multiple pressure and/or ultrasonic transducers, may be used.
- the transducers 602 , 604 are free to move within the housing 822 in the sagittal direction 831 and the transverse direction 833 with respect to the artery, as driven by the applanation and positioning motors 842 , 844 .
- the housing element 822 of the present embodiment contacts the wrist skin circumferentially around the transducers 602 , 604 which move with respect to the housing element 822 and the skin, although it will be appreciated that a variety of different configurations and methods may be used.
- a substantially compliant housing which conforms to the tissue of the subject, yet allows the transducers 602 , 604 to move in the desired directions within an aperture therein, may be substituted.
- the active surface of the transducers 602 , 604 is in variable contact with the skin of the wrist, and roughly flush with the bottom edge of the housing element 822 .
- the top of the transducers 602 , 604 include an electrical connection 837 to the power supply 838 of the applanation and transverse positioning assembly 800 , as well as to circuitry for processing the pressure and ultrasound signals from the transducers.
- the transducers are also coupled via a mechanical connection 839 to the motors of the applanation and transverse positioning assembly 800 , such that the position of the transducers 602 , 604 is varied in the sagittal and transverse directions by the applanation and transverse positioning motors 842 , 844 , respectively.
- the housing element 822 and the applanation and transverse positioning assembly 800 comprise a coupling device, which maintains the transducers 602 , 604 properly coupled to the subject's wrist when mounted in the wrist brace of FIG. 10 .
- the transducers 602 , 604 move in the sagittal direction 831 within the housing element 822 as urged by the applanation motor 842 so as to compress the radial artery to varying degrees during blood pressure measurement.
- the transverse positioning motor 844 moves the transducers in the transverse direction 833 within the housing element 822 during transverse positioning (described below).
- the applanation motor is controlled by a fuzzy logic control circuit 847 of the type well known in the art so as to perform applanation sweeps, which vary the degree of arterial compression, although other control schemes may be used.
- the applanation of the artery may be performed so as to maintain the transmural pressure at or near zero.
- the applanation motor may be modulated by the control circuit in a periodic or continuous fashion such that the artery is compressed according to a desired profile, such as a sinusoid.
- Such control and modulation schemes are described in Applicant's two U.S. Pat. Nos. 6,228,034 and 6,176,831, both entitled “Apparatus and Method for Non-Invasively Monitoring a Subject's Arterial Blood Pressure” and filed Jul. 20, 1998, which are incorporated herein by reference in their entirety.
- the transverse positioning motor 844 of the assembly 800 is used to position the transducers 602 , 604 directly over the artery of interest. Specifically, the ultrasonic emissions of the ultrasonic transducer 604 are substantially normal to the surface of the subject's skin and are used to generate echoes, which are reflected from the blood and tissues. These echoes are received by the transducer 604 and analyzed so as to determine their amplitude as a function of transverse position of the transducer over the artery. As with the applanation motor 842 described above, the transverse positioning motor 844 is controlled via a fuzzy logic control circuit 849 which signals the motor 844 to adjust the transverse position of the transducer such that the amplitude of the echoes (and SNR) is optimized.
- the user may manually position the transducer 604 using manual control circuitry based on an indication of the relative strength of the blood velocity echoes, such as may be provided to the user by an audible or visual representation thereof.
- the audio output of the speaker 691 FIG. 7
- the transducer 604 may be used to position the transducer 604 .
- Many such control schemes for the transverse positioning motor are possible, all being within the scope of the claims appended hereto.
- the brace 1000 comprises an upper brace element 1002 and lower brace element 1004 , which are adapted to fit the inner and outer wrist surfaces of the subject, respectively.
- the terms “upper” and “lower” and “inner” and “outer” are merely descriptive of the orientation of the brace elements 1002 , 1004 as illustrated in FIG. 10 , and are in no way limiting as to the position or use of the brace.
- the upper brace element 1002 includes an extending portion 1006 , which receives the inner surfaces of the subject's hand, as best shown in FIG. 11 .
- the extending portion 1006 is contoured such that the subject's hand is retained in a natural, relaxed position, thereby increasing the time that the brace 1000 may be worn without discomfort.
- the upper and lower elements 1002 , 1004 are joined on one common edge by a flexible fabric or polymer hinge 1011 which is fastened to both elements 1002 , 1004 .
- One or more straps 1012 are also fitted to the upper and lower elements 1002 , 1004 such that when the brace 1000 is fitted to the subject's wrist and hand, the straps 1012 permit the upper and lower elements to be secured together firmly.
- the straps 1012 include fasteners 1013 such as Velcro tabs, although other arrangements such as mechanical clasps, snaps, slings, adhesives, or the like may be used. Likewise, the straps 1012 may be replaced partially or entirely with clasps or other similar fastening devices. It will be recognized that literally any means of maintaining the upper brace element 1002 in a substantially fixed position with respect to the lower brace element 1004 may be substituted for the straps 1012 shown in FIGS. 10 and 11 .
- the upper and lower brace elements 1002 , 1004 are advantageously formed using a partially flexible polymer material, thereby allowing for low manufacturing cost, excellent ruggedness, and some degree of compliance with the shape of the subject's tissue. Note, however, that sufficient rigidity of these components is required to accommodate the reaction forces generated by the applanation and transverse positioning assembly 800 shown in FIG. 8 above. Specifically, the applanation and transverse positioning assembly 800 is rigidly mounted to the upper brace element 1002 , as shown in FIG. 11 . In one embodiment, the housing element 822 fits within an opening 1034 formed within the upper brace element 1002 adjacent to the recess 1030 such that the assembly 800 can be easily placed and “snapped into” wrist brace 1000 .
- the housing element 822 is formed within the upper brace element 1002 such that the transducers 602 , 604 fit within a central aperture formed within the element 822 , and the applanation and positioning assembly 800 snaps on to the outer portion of the upper brace element 1002 directly above the transducer housing element 822 .
- the applanation and positioning assembly 800 is formed directly within the upper brace element 1002 .
- the transducer elements 602 , 604 and housing element 822 are disposed within the brace 1000 , with the applanation and transverse positioning assembly 800 being removably mounted thereon. It will be recognized that many other alternative configurations are possible.
- the electrical cabling 841 associated with the assembly 800 is also optionally received within a routing clip 1040 mounted on the exterior of the upper brace element 1002 , thereby reducing the mechanical stress on the rigid mount 846 from the cabling 841 to some degree.
- the lower brace element 1004 of the present embodiment also optionally includes an inflatable bladder 1020 , which is received within and fastened to the interior surface 1022 of the lower brace element 1004 .
- the bladder 1020 is formed of a flexible material (such as a plastic or rubber) so that it can comply with the shape of the subject's wrist, and accommodate varying degrees of inflation.
- inflation is meant to include inflation of the bladder 1020 by gaseous and/or liquid substances.
- the bladder 1020 includes a stopcock 1024 and tube 1025 , which allow the user to adjust the inflation of the bladder 1020 when required.
- the bladder may also be connected to an automatic inflation regulating system (not shown), which dynamically adjusts the inflation of the bladder 1020 to maintain optimal positioning and/or comfort for the subject.
- the bladder 1020 may be replaced by a substantially compliant pad (not shown), such as one made of foam rubber, which will at least partially adapt its shape to that of the subject's wrist, yet maintain the wrist firmly within the brace. It can be appreciated that many such alternative embodiments are possible.
- the wrist brace 1000 is first fitted to the arm of the subject by the clinician such that the opening 1034 and recess 1030 in the upper brace element 1002 are located roughly atop the pulse and the radial artery.
- the bladder 1020 is adjusted as needed to firmly maintain the position of the brace 1000 .
- the applanation and transverse positioning assembly 800 is snapped into the recess 1030 , retaining it in position.
- the clinician verifies that the bottom of the housing element 822 is touching the skin of the subject's wrist, and is oriented roughly normal to the wrist tissue.
- the electrical cabling 841 is snapped into the routing clip 1040 as well.
- the ultrasonic transducer (not shown) is energized and a signal applied thereto such that acoustic waves are transmitted into the artery and surrounding tissue; echoes resulting from reflection of these waves off of the blood velocity are used (as previously described) to drive the transverse positioning control circuit and motor so as to optimize the placement of the transducer over the artery. Applanation sweeps of the artery may then be conducted, as described with respect to FIG. 3 a herein.
- FIGS. 12-18 the method and apparatus for estimating the catheter systolic and diastolic blood pressures is described.
- the method 1200 generally comprises the steps of: modeling a mechanical impulse response within the subject per step 1202 ; estimating diastolic pressure intermittently per step 1204 ; estimating a scaling factor between the sensed and catheter pressure waveform per step 1206 , and estimating the catheter systolic and diastolic blood pressures continuously per step 1208 . These steps are described in greater detail with reference to FIGS. 13-18 below.
- a mechanical impulse response exists between the true invasive or “catheter” arterial pressure and the tonometric pressure sensed at the radial artery as previously described; i.e., when the artery has been sufficiently compressed or applanated such that the sensed mean arterial pressure (MAP) equals the true MAP.
- the impulse response is modeled as a linear controlled, autoregressive (ARX) model of the type known in the mathematical arts as illustrated in Eqn. 8.
- this scaling factor is derived by first estimating the catheter mean and diastolic pressures, and then calculating the attenuation based on the difference between i) the estimated mean pressure minus the estimated diastolic pressure, and ii) the measured mean pressure minus the measured diastolic pressure.
- the estimated mean is determined by the time-frequency method and apparatus as previously described herein.
- an estimate of diastolic pressure is obtained by processing the blood velocity waveforms during a decreasing applanation sweep to determine a corresponding pressure waveform whose mean corresponds to an estimate of the true diastolic pressure.
- the “measured” values are obtained through servo operation around the mean, as described in greater detail below.
- FIGS. 14 a - 16 illustrate arterial pressure, blood velocity, time frequency signal and wavelet transform respectively as a function of sample number (time).
- an estimate of diastolic pressure is obtained by processing the blood velocity waveforms during a decreasing applanation sweep to determine a corresponding pressure waveform whose mean corresponds to an estimate of the true diastolic pressure. It has been observed that during the course of this decreasing applanation sweep such as that illustrated in FIG. 14 a , the blood velocity contains an end-diastolic component that transiently rises and falls; see FIGS. 14 b and 14 c .
- This feature of the velocity may be related to the changes in flow characteristics or changes in arterial diameter.
- the time 1402 at which the end-diastolic velocity first “settles” to its final value after transiently increasing i.e., “settling point”
- the mean pressure applied externally above the radial artery is an estimate of the true diastolic pressure within the artery.
- the process of mathematically isolating this settling point in the time domain is complex, yet can be simplified through processing in the time-scale domain.
- the generalized method of isolating the settling point according to the invention is illustrated in FIG. 15 .
- the method 1500 comprises providing a functional representation of a wavelet in step 1502 ; calculating a transform of the wavelet in step 1504 ; taking a derivative of the wavelet transform in step 1506 ; and applying a set of analytical criteria to the derivative of the wavelet transform in order to isolate the setting point in step 1508 .
- FIG. 16 illustrates one specific embodiment 1600 of the method 1500 of isolating the settling point.
- the approximation coefficients of a Haar wavelet transform of scale 6 are calculated in order to enable the essential features of the end-diastolic velocity to be isolated.
- This transform, WT(n,6) is calculated in step 1602 as set forth in Eqn. 9 below:
- x(n) is the blood velocity signal
- L is the length of the signal (i.e., the total number of samples in the blood velocity signal)
- ⁇ h (n) is the Haar scaling function as is well known in the mathematical arts.
- the Haar scaling function is defined as
- step 1604 the derivative of the wavelet transform, d(n) is calculated and processed in step 1604 of FIG. 16 .
- WT(n,6) max is calculated in step 1606 .
- step 1608 the first instance where the derivative d(n 1 ) is greater than zero (d(n 1 )>0) is found in step 1608 .
- step 1610 the first instance where d(n 2 ) ⁇ 0 is then found per step 1610 .
- step 1612 the first local minimum at sample n 3 is found in step 1612 .
- step 1614 and starting from sample n 3 , the first instance where d(n 4 )>0 is found.
- step 1616 the smallest value of d(n 5 )>0.15 WT(n, 6) max . is found within the range n 3 ⁇ n ⁇ n 4 .
- the estimated diastolic pressure is then determined as the value of MAP(n*) in step 1620 .
- FIG. 14 d illustrates the relationship of the wavelet transform WT(n,6) and derivative thereof, d(n), as related to the arterial pressure ( FIG. 14 a ), blood velocity ( FIG. 14 b ), and time frequency distribution ( FIG. 14 c ).
- FIG. 16 While the embodiment illustrated in FIG. 16 and described above involves the application of a Haar wavelet transform, it will be recognized that other types of transforms and mathematical operations may be substituted consistent with the present invention to isolate the “settling point” associated with the end diastolic velocity; hence, the use of a Haar transform is merely illustrative.
- a first scaling factor, F 1 may be derived using the following equation:
- this scaling factor is only calculated intermittently during a calibration sweep.
- one embodiment of the invention includes one or more fuzzy logic controllers (circuits) 847 , 849 .
- the fuzzy logic controller employed in the applanation motor control circuit 847 is used to servo the MAP, and possesses two inputs and one output.
- the two input signals of this embodiment of the control circuit 847 are based on the time-frequency signal previously described herein. Other numbers and types of inputs may conceivably be used, however, as is well understood in the art.
- the blood velocity is first acquired at a first sampling frequency f 1 , thereby resulting in a digitized signal.
- the blood velocity is sampled at a frequency of 400 Hz using a National Instruments ADC, Model No. DaQCard-AI-16E-4, resulting in digitized data with 12 bit resolution. It will be recognized, however, that other sampling frequencies, data conversion devices, and digital data resolution values may be substituted with equal success.
- the digitized data is then decimated by a factor of 20 to obtain 20 Hz data.
- the mean time-frequency signal is then calculated for each waveform.
- the embodiment of the controller described herein seeks to maximize the mean time-frequency signal on a per-waveform (beat) basis, although other criteria may conceivably be used.
- the mean time-frequency signal is proportional to the end-diastolic blood velocity.
- the mean time-frequency signal for each waveform is passed to the fuzzy logic controller 847 as the first input.
- a second input to the controller 847 is derived as the difference between the current and last mean time-frequency inputs.
- the output signal directs the applanation motor to change direction for a calculated number of steps.
- the input and output membership functions of the controller are typical functions of the type well known in the controller arts with 5 overlapping trapezoids, although it will be recognized that other types of membership functions may be used. Fuzzification of the illustrated embodiment uses the standard AND rule; defuzzification uses the standard centroid method.
- FIGS. 17 through 19 A typical result obtained using the servo algorithm of the present invention is illustrated in FIGS. 17 through 19 , and described in greater detail in Appendix C hereto.
- FIG. 17 the response of the algorithm to an observed 50 mm Hg drop in MAP over approximately 11 minutes for a single test subject (in response to epidural administration of the anesthetic bupivacaine) is illustrated.
- the servo algorithm of the invention tracked the MAP accurately as shown by the overall correlation between servo pressure 1702 and catheter pressure 1704 over time.
- FIG. 18 is a detail view of FIG. 17 , illustrating three forty (40) second windows of the catheter and servo data.
- FIG. 19 is a 20 second interval “snapshot” of the data of FIG. 17 that occurred at 6.5 minutes from onset of data recordation. As illustrated in FIG. 19 , a significant drop 1902 in the end-diastolic velocity was corrected within 5 beats 1904 .
- transverse positioning of the ultrasonic and pressure transducers of the apparatus is beneficial in terms of enhanced accuracy of measurement of hemodynamic parameters including arterial blood pressure.
- Such transverse positioning is generally predicated upon initial placement of the apparatus in the locale of the blood vessel of interest, and subsequently “fine tuning” the position of the transducer(s) such that optimal coupling is achieved.
- the approximate location of the artery is known by the caregiver; i.e., running longitudinally down the inside surface of the wrist/forearm of the subject, within a narrow band corresponding to something less than the width of the wrist.
- the location and orientation of the blood vessel of interest may not be as easily identified.
- carotid artery surgery mapping of the vessel along the human neck
- femoral artery catheterization femoral artery catheterization
- temporal artery localization wherein it is highly desirable to be able to either (i) readily and reliably locate a blood vessel within the tissue of the subject in a non-invasive manner, or (ii) maintain a monitoring or treatment device in a predetermined position and orientation with respect to the blood vessel once located.
- the present invention advantageously provides such a non-invasive technique (and apparatus) for both locating the blood vessel of interest, and maintaining one or more selected apparatus in a predetermined relationship thereto.
- backscattered acoustic energy is analyzed to initially locate the blood vessel which is embedded within the surrounding tissue of the subject.
- the backscattered energy is used to maintain a sensing or treatment apparatus (e.g., the pressure and/ultrasonic transducers assembly 800 of the NIBP device previously described herein, or that described in Assignee's U.S. Pat. No.
- the method of detecting and locating the blood vessel of interest is accomplished by directly detecting the lumen associated with the blood vessel based on reduced levels of backscattered ultrasonic energy present in “A-mode” line scans; ultrasonic energy is more readily absorbed within the lumen (such as by the red blood cells and plasma present within the blood) than by the surrounding vessel walls and tissue.
- the vessel is located, and/or the monitoring device positioned, by identifying regions of reduced backscattered energy.
- regions may be found in one dimension (e.g., only in terms of depth within the tissue), or multiple dimensions, such as where it is desired to precisely locate the vessel both in terms of lateral or transverse position and depth.
- Another embodiment of the invention detects the relative locations of both the front and rear walls of the blood vessel based on analysis of backscattered A-mode energy. This wall information is used to indirectly determine the effective diameter of the blood vessel; the variation in blood vessel diameter as a function of lateral or transverse position is then used to identify the optimal lateral position of the measurement or treatment device. Note that the act of “lateral” positioning as described herein may also include some component of longitudinal positioning (i.e., along the longitudinal axis of the blood vessel), since placement of the apparatus on the wrist/forearm of the subject is governed more by the physical attributes of the wrist, as opposed to the orientation of the blood vessel within the wrist/forearm.
- lateral positioning inherently includes a longitudinal component as well.
- certain points along the blood vessel may be better suited to hemodynamic analysis (due, for example, to the existence of veins, cysts, or other components which potentially may interfere with the transmission/reflection of ultrasonic energy).
- A-mode encompasses both traditional A-mode (i.e., display of amplitude versus depth (time) via repeatedly scanned lines) and other related modalities such as M-mode (i.e., grayscale image distributed over temporal dimension) and B-mode (i.e., “steered” grayscale image representative of depth (time) versus width), such alternate modalities being well known to those of ordinary skill in the ultrasound arts.
- M-mode i.e., grayscale image distributed over temporal dimension
- B-mode i.e., “steered” grayscale image representative of depth (time) versus width
- the A-mode ultrasonic energy of the present embodiment may also be used to complement the Doppler spectral modalities previously described herein, thereby providing both the system designer and ultimate end users of the apparatus with greatly enhanced flexibility in both design and operation.
- at least three different operating schemes are contemplated by the present invention, including: (i) A-mode detection alone; (ii) Doppler-based detection alone; and (iii) a combination of the A-mode and Doppler modalities together. While not required, such use of complementary modalities as in (iii) may enhance the reliability and robustness of results obtained with the instrument.
- the method 2000 comprises first generating and transmitting acoustic (e.g., ultrasonic) energy in the desired beam width into the tissue of the subject generally in the region of interest where the blood vessel is located (step 2002 ).
- acoustic e.g., ultrasonic
- the ultrasonic transducer transmitting the waves can be physically or electronically “steered” laterally across the region of interest in a scan pattern so as to cut across at least a portion of the blood vessel with the ultrasonic beam.
- an assembly which moves the ultrasonic transducer over the surface of the skin may be used.
- a larger dispersion beam may be used to obviate at least a portion of the scan function; the beam dispersion may be subsequently adjusted upon identification of the blood vessel or region of interest for better signal quality if desired.
- a phased-array or other electronically steerable device may be used to generate transmit/receive beams of comparatively narrow dispersion which scan the tissue without physical movement of the transducer element.
- the tissue under examination may also be applanated as previously described to “pre-load” the tissue.
- pre-loading may be beneficial in the case where veins or other smaller blood vessels are interposed between the ultrasonic transducer and the blood vessel of interest, or generally in the vicinity thereof, such as in the case of the human radial artery.
- controlled pre-loading preferentially collapses the smaller vein due to its smaller hoop stress and lower lumen (blood) pressure as compared to the artery, thereby effectively removing it from view of the lumen detection techniques described below.
- the foregoing applanation may be used selectively as desired in order to “filter” what is viewed by the lumen detection apparatus. For example, if there is a high degree of clutter and other noise present in the A-mode signal for a given individual, it may be desirable to applanate the region under evaluation to remove the effects of energy backscatter from the vein(s) around the artery. Alternatively, if the noise level is sufficiently low, it may be desirable to detect the presence of the vein(s), such detection being potentially useful for determination of the tissue scaling or transfer function used in conjunction with non-invasive blood pressure measurements. Specifically, the presence of an interposed vein may affect the value of the transfer function somewhat, so it may be desirable to detect its presence and compensate for its effects.
- backscattered energy reflected from the tissue, blood vessel and lumen contained in the region being scanned is next received by the same (or another) transducer element per step 2004 , and converted by the processing within the apparatus to an A-mode or other desired modality in step 2006 .
- Additional signal processing (described in greater detail below), including derivation of an “envelope-squared” value, is applied to the A-mode lines in step 2008 in order to enhance subsequent blood vessel detection.
- the processed A-mode signals are further analyzed in terms of a predetermined metric or other criterion to identify the location within the region of interest where the blood vessel resides.
- the metric is adapted to identify plateaus within the normalized integrated power profile resulting from the presence of the lumen within the blood vessel of interest. Hence, when a significant plateau in the integrated backscattered power is identified during the transverse “sweep”, the lateral position of the transducer when the plateau is detected corresponds to the lateral position of the blood vessel.
- the signal level of the envelope-squared parameter is analyzed to identify local minima, also resulting from the presence of the lumen.
- one embodiment of the signal processing (step 2008 ) associated with the basic A-mode lumen detection approach of FIG. 20 comprises basebanding (quadrature demodulation) the “raw” backscattered A-mode signal (step 2040 ), squaring the basebanded A-mode signal (step 2042 ), thereby producing the “envelope-squared” data, and decimation to a predetermined sampling rate (e.g. 2 MHz) per step 2044 .
- the depth-dependent gain e.g., TGC
- TGC time-dependent gain
- FIG. 21 is a plot of the A-mode signal amplitude associated with the radial artery of a living subject, referred to as ‘raw’ A-mode data herein, versus time. It will be noted that the time axis of FIG. 21 has been converted to depth based on the propagation speed of the ultrasonic energy through the tissue. This conversion is performed since depth is considered a more readily interpreted quantity than time for the purposes of the invention, although it will be appreciated that time (or even other representations such as time-scale) may be used with equal success.
- FIG. 21 One important feature demonstrated in FIG. 21 is the level or amplitude of the A-mode signal as a function of depth. As illustrated in FIG. 21 , there is an obvious range, from about 1.5 mm to 3.35 mm in this example, in which the signal level is quite low. This low signal amplitude is attributable to the low backscattering of energy associated with the blood (lumen) flowing the in blood vessel being located. Conversely, where no such blood vessel lies within the ensonified region of the tissue, no such reduction in signal level or backscattered power is identified. This is the primary feature used by the present embodiment for detecting the presence of the blood vessel.
- the 16 MHz center frequency used for this example is clearly depicted in FIG. 21 . Since the center frequency conveys no information relevant to the location of the arterial walls, the first step of signal processing is to remove the center frequency. This process is denoted as quadrature demodulation (or envelope detection). The envelope detected signal associated with the exemplary A-mode signal of FIG. 21 is shown in FIG. 22 .
- Quadrature demodulation as used in the present embodiment generally comprises multiplication of the A-mode signal by the sine and cosine functions, and lowpass filtering.
- the purpose of quadrature demodulation is to baseband the A-mode signal, through the removal of the transmit carrier frequency.
- This method is generally illustrated in FIG. 23 .
- quadrature demodulation consists receiving the backscattered “raw” A-mode signal (step. 2302 ) then multiplying of the received backscattered “raw” A-mode signal by the complex exponential, exp( ⁇ 2 ⁇ f c t) where f c denotes the transmit center frequency of the signal (step 2304 ). This produces a series of values representing sum and difference frequencies of the complex exponential function and raw A-mode signal.
- the resulting signal is lowpass filtered (step 2306 ) to retain only the difference (baseband) frequency components. Since the exponential function is complex, both an in-phase and quadrature channel are produced, designated I and Q, respectively. This process is also graphically depicted in FIG. 24 .
- the frequency of the sinusoids is 16 MHz, corresponding to the center frequency, f c , of the A-mode signal.
- the sampling interval of the sinusoids is equal to that of the digitized A-mode signal that is sampled at an effective rate of 64 MHz.
- Y cos ( nT ) a ( nT )cos(2 ⁇ f c nT ) (Eqn.
- F s denotes the sample rate (e.g., 64 MHz).
- This multiplication is performed for the entire duration of the A-mode line.
- the in-phase and quadrature components, X I (nT D ) and X Q (nT D ) respectively, are produced by lowpass filtering Y cos (nT) and Y sin (nT).
- T D denotes the decimated sampling interval.
- Lowpass filtering (step 2306 of FIG. 23 ) is accomplished in the illustrated embodiment with a finite impulse response (FIR) filter consisting of 37 coefficients.
- T D 16 MHz
- the frequency response is shown in FIG. 25 .
- the coefficients associated with this exemplary low-pass design are shown in FIG. 26 .
- the filter output advantageously need only be sampled at a rate of approximately 16 MHz in comparison with the original “raw” A-mode signal that is sampled at an effective rate of 64 MHz.
- the magnitude of the complex envelope previously described is the only component required for subsequent processing, although other components of the processed or unprocessed A-mode signal may be used for other purposes if desired.
- obtaining the magnitude of the complex envelope requires taking the square root of the sum of the squares of the lowpass filtered results. That is, since the result is complex, the magnitude equals the square root of the sum of the in-phase component squared and the quadrature component squared, as shown in Eqn.
- the logarithm (base 10 ) of the envelope-squared signal is obtained as shown in FIG. 28 . Note that the level of the signal 2802 associated with the lumen is very roughly 30 dB below the signal 2804 associated with backscatter from the arterial walls.
- lumen detection methodology might be based solely on the absolute value of the A-mode signal level.
- lumen detection criterion based on the absolute signal level alone might erroneously detect lumen where there is none, or conversely miss lumen where it is actually present.
- false detections can arise from a variety of factors including, for example, backscatter and reflections from tissue (veins, musculature, etc) interposed between the transducer element and the blood vessel, movement of the subject during measurement, and the like.
- the methodology of the present invention may be optionally modified to also examine signal artifacts proximate to those produced by the lumen in order to confirm the veracity of any given lumen detection, and positively locate both the lumen and contiguous vessel walls if desired.
- a non-linear depth-dependent gain (step 2046 of FIG. 20 a ) is also applied to the envelope to account for the attenuation to the acoustic A-mode signal as it propagates through the skin, tissue and blood vessels.
- This depth-dependent gain is often referred to as Time Gain Compensation, or TGC; time and depth being implicitly related in this application as previously described.
- TGC Time Gain Compensation
- the depth is assumed to be in millimeters, and the gain is applied to the envelope-squared. It will be recognized, however, that other gain functions may readily be applied either in place or in concert with that of Eqn. 19 above.
- Such gain functions may be empirically determined, such as through clinical testing, or determined via other means such as mathematical derivation or anecdotal or historical sampling of the A-mode signal or other parameters related thereto.
- FIG. 29 The application of the gain function to the envelope-squared of the A-mode signal is depicted in FIG. 29 .
- the solid curve 2902 corresponds to the A-mode signal with TGC applied
- the dashed curve 2904 corresponds to the A-mode signal without TGC.
- the next step 2010 of the method 2000 of FIG. 20 detects the lumen within the selected blood vessel (e.g., radial artery) for each A-mode line.
- the lumen is detected in step 2010 according to the general methodology of FIG. 30 a (hereinafter the “plateau” method).
- the plateau method 3000 of lumen detection generally comprises first determining a power metric as a function of depth (step 3002 ), the power metric being based on the aforementioned envelope-squared function.
- FIG. 30 b illustrates backscattered power as a function of depth for a single A-mode line.
- the second step 3004 of the plateau method 3000 consists of identifying the best estimate of the plateau associated with the weak backscatter from the blood within the lumen.
- the integrated power function is first normalized to unity (step 3006 ), as is depicted in FIG. 30 c .
- the range from zero to unity is divided into a given number of intervals (e.g., eighty equal intervals in the present embodiment; that is, intervals of 0.0125 such that the first interval is 0 to 0.0125, the second from 0.0125 to 0.0250, and so forth). It will be recognized that other numbers of intervals and in fact, non-equal intervals (such as those determined by a function such as a logarithm) may be used as well if desired.
- a given number of intervals e.g., eighty equal intervals in the present embodiment; that is, intervals of 0.0125 such that the first interval is 0 to 0.0125, the second from 0.0125 to 0.0250, and so forth.
- the plateau is detected per step 3010 .
- the number of samples occurring within each interval of normalized power is computed (step 3012 ).
- the rationale behind this computation is that when the power is low, corresponding to the backscatter from blood for example, many values must be integrated to cross from one integral to the next. Hence, an interval containing many samples is indicative of a plateau (and the lumen).
- a test consisting of the number of points contained in three consecutive intervals is applied (step 3014 ), such that the metric is as shown in Eqn. 21 below:
- M cnt (k) denotes the sum of the counts in three consecutive intervals ending with the k th interval
- m(n) denotes the number of samples in the n th interval.
- This metric is shown in FIG. 30 d for A-mode line number 50 for a lateral sweep of the radial artery. Note the relatively large peaks 3030 in the intervals above interval number 60 . These generally correspond to the low power occurring at deeper depths, which can often times result in false detection of the lumen.
- the metric includes the requirement that the three consecutive intervals must be followed by an interval with a low count corresponding to the back arterial wall.
- the modified metric is given by Eqn. 22:
- Detection of the peak results in the identification of the three consecutive intervals most likely to correspond to the lumen.
- the total count of samples in all intervals prior to the three intervals corresponding to the peak identifies the depth of the lumen.
- the sample point within the A-mode line associated with the lumen for the purpose of the subsequent arterial wall search is derived from the total number of samples in all intervals from the first interval up to (and including) the first interval in the three successive intervals.
- the sample associated with the lumen for the given A-mode line is estimated per Eqn. 23:
- L denotes the number of samples prior to the lumen area
- K denotes the “pointer” to the third of the three consecutive intervals for which the peak was detected.
- an estimate of the mean of the lumen power may be derived from the power contained in one or more of the three consecutive intervals (step 3016 ). For example, in one exemplary approach, mean lumen power is determined from the second of the three consecutive intervals by simply averaging the sample values of the envelope-squared that correspond to this interval. This estimate of the lumen backscattered power may be used, for example, in conjunction with the estimated position of the detected lumen to detect the arterial walls, as described in greater detail below.
- plateaus in the integrated power profile may result from other sources. Specifically, in the case of the human radial artery, such plateaus may also be induced by the presence of one or more veins located between the applanation device and the blood vessel of interest, or by the presence of cysts or other growths. While more common, plateaus due to veins are generally quite small in comparison to the “true” plateau of interest associated with compression of the radial artery, due largely to the comparatively smaller vein diameter (and wall thickness). As previously described, the methodology of the present invention effectively addresses this issue when required by conducting measurements of the tissue at applanation pressures above the level necessary to collapse the comparatively thin-walled veins. Such collapse of the veins generally occurs at pressures well below that necessary to significantly affect the diameter of the larger blood vessel (e.g., radial artery), thereby allowing for an elegant solution to the problem of potentially “false” plateaus due to veins.
- cyst or growth-related artifacts generally occur only in a very small fraction of the population, and are frequently spatially localized to the extent that relocation of the transducer at another location over the artery will eliminate any effects resulting there from. Additionally, the cystic areas do not have corresponding pulse pressure or motion components related to pulse pressure, and hence can be readily identified and screened using any number of signal processing techniques well known to those of ordinary skill.
- detection of the lumen in step 2010 of FIG. 20 is accomplished by computing the average power within a predetermined distance (e.g., 1 mm) interval along the A-mode line, hereinafter referred to as the “interval” method.
- the 1 mm interval for power calculation was selected in the illustrated embodiment based on the observation by the Assignee hereof that the diameter of the blood vessel under examination (e.g., radial artery) will exceed 1 mm in essentially all of the adult human population; hence, the power calculation is reasonably assured to constitute signal attributable only to the lumen.
- this interval may be adjusted based on factors such as measurement of non-adult populations, use of other blood vessels, and/or use of the technique on other species.
- the 1 mm interval referenced above also advantageously provides a “reasonable” number of samples to average for an estimate of the A-mode signal power.
- the aforementioned 1 mm interval corresponds to a time interval of 1.33 usec, or approximately 22 samples.
- the estimate of power at time nT D , P 1 mm (nT D ), is computed according to Eqn. 25:
- FIG. 31 a An exemplary plot of the acoustic power in a 1 mm interval along the line of TGC corrected A-mode data is depicted in FIG. 31 a.
- the location of the lumen (e.g., blood) within the confines of the radial artery is detected as the first minimum in the 1 mm average power calculation.
- the search for this minimum begins at a predetermined point along the A-mode line, (e.g. 1 mm), and continues to a second predetermined depth, chosen in the present illustration as 7 mm.
- This range of 1 mm to 7 mm was selected based on the observation that the front wall of the radial artery (i.e., that wall first encountered by the acoustic energy radiated from the transducer) will occur within this interval in essentially all of the adult human population. It will also be noted that the aforementioned minimum is clearly distinguishable in the plot of FIG.
- A-mode signal of good quality i.e., low noise level and other artifacts.
- the detection of minima within electronic signals may be accomplished by any number of techniques well known in the electronic arts, and accordingly is not described further herein.
- FIG. 31 b graphically illustrates lumen detection using the aforementioned “interval” method.
- lumen detection comprises beginning the search for the artery wall at the pre-selected depth, 1 mm in the present case (step 3102 ).
- the relationship to the maximum specified depth e.g., 7 mm in the foregoing example
- the search is terminated (and optionally restarted) per step 3105 . If the maximum specified depth has not been exceeded in step 3104 , the next power sample is analyzed per step 3106 .
- the minimum is reset to the power level P associated with the sample of the current depth, and the count reset to zero (step 3108 ). Conversely, if the next power sample is not less than the current minimum, then the count is incremented by one (step 3110 ), and the integer number of the count analyzed (step 3112 ) to determine its relationship to a predetermined count limit parameter (e.g., 5 in the illustrated embodiment). If the current count exceeds the count limit parameter, the first minimum is assumed to have been detected at the current depth, and the search is terminated (step 3114 ). If not, steps 3104 through 3114 are repeated again as applicable.
- FIG. 31 c further illustrates this process with respect to one exemplary signal processing architecture.
- the level of the A-mode signal associated with backscatter from lumen, E sq (blood), can be easily estimated once the region of lumen has been identified.
- the estimate is computed as a simple average over samples of the envelope-squared over a range centered at the depth for which lumen has been detected.
- the average is computed according to the exemplary relationship of Eqn. 26:
- N blood denotes the index of the envelope squared corresponding to the depth of blood detection. Note that in Eqn. 26, the average is computed over fifteen samples of the envelope squared, although it will be recognized that other values may be substituted depending on the particular application.
- FIGS. 30 a and 31 b may be repeated as necessary for any number of spatially distributed scans; in this manner, “slices” of tissue may be examined in the depth (time) dimension sequentially (or even contemporaneously) in order to generate information regarding the lateral position of the blood vessel of interest as well the depth thereof.
- Such “slices” may also be electronically fused or combined to provide a multi-dimensional representation of the measured envelope-squared value (or integrated power, as described with respect to the previous embodiment) as is well known in the tomographic arts.
- the present invention further contemplates the use of multiple of such techniques for increasing the accuracy of the determination. For example, the techniques of “plateau” detection and “interval” detection may be combined to increase the robustness of the instrument.
- lumen (blood vessel) location information may be used to maintain the ultrasonic transducer or other measurement/treatment apparatus in any desired orientation with respect to the blood vessel; e.g., with a fixed lateral offset; with a lateral offset which is functionally related to the diameter of the blood vessel (as described below), etc.
- the lumen detection information may be used to control the position of the transducer based on other parameters such as signal quality, the presence of cystic components or clutter, degree of applanation (if any), and the like.
- FIGS. 32 a and 32 b an alternate embodiment of the method of detecting and locating a blood vessel within the tissue of a subject is disclosed.
- the foregoing techniques of lumen detection are used as a starting point for the analysis of the walls of the blood vessel of interest.
- the backscattered energy associated with the front and back blood vessel walls is detected by searching forward and backward from the identified location of the lumen within the blood vessel.
- the front wall When the backscattered energy associated with the search in the backward direction (towards the transducer) satisfies one or more criteria, such as exceeding the mean lumen power or estimated level of the blood signal by a prescribed amount or factor (described below in greater detail), the front wall is detected and the location of the signal along the line is interpreted as the location of the front wall. Similarly, when the reflected energy associated with the search in the forward direction satisfies the relevant back wall criteria, the back wall is detected and the location of the signal along the line is interpreted as the location of the back wall.
- the front arterial wall is assumed to occur between the sensor unit and the depth of the detected lumen and in particular, generally in the vicinity where the A-mode signal is decreasing to the integrated power or signal level associated with the lumen.
- FIGS. 32 a and 32 b Various methodologies for wall detection are now described in detail with respect to FIGS. 32 a and 32 b.
- the terms “front” and “back” infer no specific spatial orientation, but simply refer to the order in which the walls of the blood vessel are encountered during direct propagation by a moving ultrasonic wavefront emanated from an ultrasonic source.
- what may be the “front” wall when measuring hemodynamic properties in one transducer orientation may comprise the “rear” wall in another transducer orientation.
- Unique to the present invention is also the use of lumen detection as a means of front and back wall detection; i.e., due to the comparatively lower backscatter of ultrasonic energy by the lumen as compared to other blood vessel components, the position of the lumen may be readily identified from the backscattered energy, and the front and rear vessel walls identified relative thereto.
- the method of wall detection utilizes (i) the detected position within the lumen from which to begin the search for the arterial walls, and (ii) the estimate of the mean lumen power from which to derive detection thresholds.
- the detected position of the lumen along the A-mode line serves as the start for the search for the back wall.
- the integrated power is computed by summing consecutive samples of the square of the envelope of the A-mode signal (step 3204 ). The formulation is given by Eqn. 27:
- P bk (m) denotes the integrated power in the direction of the back wall starting at sample K st up to sample m
- P(k) denotes the k th sample of the square of the envelope of the A-mode signal.
- the front wall is detected in much the same manner as the back wall.
- the integrated power is computed by summing consecutive samples of the square of the envelope of the A-mode signal in the direction of the front wall. Hence, the samples are taken in descending order from sample K st .
- the front wall is assumed detected and the corresponding sample value determines the depth of the front wall.
- a front wall threshold equal to 500 times the aforementioned lumen mean power
- a back wall threshold equal to 50 times the lumen mean power
- TGC depth-dependent gain
- variable thresholds whose value varies as a function of other parameters (e.g., clutter in the lumen, or attenuation in interposed tissue) may be substituted.
- the relationship between the front and back wall threshold criteria may or may not respect a predetermined relationship.
- the front wall threshold may be determined as a function of the back wall threshold, or alternatively be completely independent there from. Other variations are possible; see for example the discussion of scoring and weighting below.
- inter-line averaging of the A-mode lines may be performed prior to lumen and wall detection. This technique can be used to improve performance and robustness of the system, both in terms of lumen detection and arterial wall depth estimation.
- the amplitude of the envelope squared, E sq (nT D ) is compared to the estimated signal level associated with backscatter from blood, E sq (blood).
- E sq blood
- the search for the front wall is in the direction towards the transducer element, that is, in the direction of decreasing depth.
- a designated criterion e.g., exceeds four times the estimated signal level
- this amplitude is attributed to backscatter from the front wall.
- the depth of this occurrence is designated to be the location of the front wall, subject to optional subsequent confirmatory processing, if desired.
- criterion other than that relating to the amplitude of the envelope-squared variable may be employed.
- the search for the back wall is performed in a similar manner to that described for the front wall. Specifically, the search begins at the depth of the detected lumen, but proceeds in the direction of increasing depth (i.e., away from the ultrasonic transducer). As with the front wall, when the amplitude of the envelope-squared exceeds satisfies a designated criterion, this amplitude is attributed to backscatter from the back wall. The depth of this occurrence is assumed to be the location of the back wall.
- the method 3250 comprises first comparing the A-mode signal level to the signal level of the lumen in both (i) the direction toward the transducer, and (ii) in the direction away from the transducer, starting at the depth where the lumen signal was detected (step 3252 ).
- the signal level is measured in the selected direction (step 3254 ); when the signal level is found to meet one or more predetermined criteria (e.g., the signal level of (i) or (ii) above being “n” times as great as the signal level associated with the lumen), the signal is assumed to correspond to the arterial wall (step 3256 ).
- the point along the A-mode line towards the transducer at which this criterion is met is denoted as the location of the front arterial wall, and similarly, the point along the A-mode line away from the transducer at which this criterion is met is denoted as the location of the back arterial wall.
- FIG. 33 illustrates the relationship between the average power calculation 3302 and the front and back wall artifacts 3304 , 3306 present in the A-mode envelope.
- the processes of computing the envelope-squared, determining the corresponding average power in the designated interval (e.g., 1 mm) and the lumen signal, and detection of the front and back arterial walls, is performed in the present embodiment on an A-mode “line-by-line” basis.
- the arterial wall positions determined in this manner for an exemplary A-mode data set consisting of 5000 lines is shown in FIG. 34 .
- line-by-line analysis may be substituted with other analytical approaches or increments, such as for example portions of a line, or groupings of multiple lines (whether contiguous or otherwise), or line averaging.
- the apparatus of the present invention is further adapted to compensate for transient or dynamic wall diameter effects using signal processing. Specifically, in one aspect, respiratory effects (which are comparatively low in frequency compared to cardiac rate) are electronically filtered.
- cardiac effects i.e., the natural expansion and contraction of the blood vessel due to changes in pressure within the blood vessel induced by the heart
- cardiac effects are integrated or averaged out, thereby providing a wall diameter signal which is effectively independent of these effects.
- “raw” wall diameter measurements are integrated over several (“n”) cardiac cycles before any control signal is generated to reposition the lateral transducer positioning assembly.
- wall detection e.g., integrated power and envelope-squared signal level
- front or back wall detection approaches may be applied to varying degrees. For example, if it is determined that for a certain subject being evaluated (or group of subjects having some common characteristic) that the front wall artifact is particularly weak or otherwise unreliable, back wall detection may be weighted more substantially in compensation. Similarly, if the clutter in the blood vessel under examination is significant, the more affected wall may be selectively de-emphasized in terms of weighting. Other such modifications may also be employed depending on the particular application.
- the integrated power threshold and envelope-squared signal level approaches may be used either alone or in combination, or other methods (e.g., so-called “boxcar” averaging of the type well known in the signal processing arts) may be employed.
- the applicable threshold criteria e.g., 4 times lumen signal level, and 500 times mean lumen power, respectively.
- the results of these comparisons may then be used to determine the relative reliability or confidence in the wall detection, such as by calculation of a “confidence level” metric which can be subsequently used by system and/or user. If the wall detection scores for both the integrated power and envelope-squared approaches are high, the resulting confidence metric is high; if the wall detection scores for one technique is high and the other low, then the value of the confidence metric is reduced, and subsequent confirmatory processing is indicated.
- A-mode signals having an envelope-squared or integrated power value meeting or exceeding a discrete value are assigned a score of “1.0”.
- Signals having a value less that this discrete value are assigned scores based on their relationship to a window function w(x), such that values falling below a predetermined threshold (e.g., 2 times estimated signal level, or 250 times mean lumen) are given a score of 0.0, and values between the predetermined threshold and the designated criterion are assigned scores between 0.0 and 1.0 according to the function w(x).
- a predetermined threshold e.g., 2 times estimated signal level, or 250 times mean lumen
- the envelope-squared or integrated power values associated with given A-mode measurement may be weighted based on some extrinsic or intrinsic “quality factor” which is related to the quality of data sampled during that interval.
- quality factor is related to the quality of data sampled during that interval.
- “locational” weighting and/or scoring may be applied, such that envelope-squared or integrated power values generated by A-mode lines corresponding to certain depths may be adjusted. For example, as previously described, the likelihood of finding the front wall of the radial artery in an adult human less than 1 mm from the surface of the skin is exceedingly low; accordingly, an envelope-squared or integrated power value derived from the first “N” A-mode lines (corresponding to the depth of 1 mm) would be heavily de-valued or even eliminated (i.e., zero-weighted).
- interval-to-interval processing may be conducted such that wall artifact determined in non-contiguous A-mode line intervals is marked as an ambiguity requiring resolution. If a front wall artifact is detected in the first 1 mm depth interval, and again in the third, it can be assumed with some level of confidence that either (i) the wall artifact detected in the first interval is the front wall, and the artifact detected in the third interval is the back wall, or (ii) the first artifact was noise, and the third-interval artifact is the true front wall signal.
- Such ambiguity can be resolved through any number of techniques, such as the application of the aforementioned “locational” weighting to eliminate the first artifact based on low likelihood of occurrence in the adult population, or the use of sampling of subsequent A-mode signals for those intervals.
- the present methodology also includes significant smoothing/filtering of the signal where needed.
- smoothing/filtering furthermore eliminates the time variations that occur from systole to diastole, as well as beat-to-beat variations caused by respiration.
- signal smoothing/filtering is generally well understood in the signal processing arts, and accordingly is not described further herein.
- FIG. 35 one exemplary embodiment of the method of utilizing wall diameter information to position measurement or other treatment devices with respect to a blood vessel is described. It is noted that while the following discussion is cast in terms of a lateral positioning assembly (such as that previously described herein) used to reposition an ultrasonic transducer with respect to the radial artery of a human being, the general methodology may be readily adapted to other applications.
- the method 3500 generally comprises deriving “raw” wall diameter information which varies as a function of time (step 3502 ), as previously discussed herein.
- step 3504 the wall diameter information of step 3502 is integrated over a pre-selected finite time interval to “smooth” the raw data and eliminate most or all artifact relating to respiration and cardiac cycle.
- This produces a wall diameter metric (step 3506 ) which varies as a function of time.
- the wall diameter metric is then used to generate an error signal (step 3508 ) which is functionally related to the value of the absolute metric.
- This error signal is then fed to the aforementioned controller device which varies the lateral position of the transducer element (step 3510 ) so as to effectively maintain the magnitude of the error signal as small as possible (or alternatively, the value of the wall diameter metric as large as possible)
- wall diameter information referenced above may be used as the basis for any number of different control schemes, including for example the fuzzy logic control approach previously described herein. Such variations and applications are well known to those of ordinary skill in the controller arts, and accordingly are not described further herein.
- MAP difference was calculated by comparing estimated MAP to the average of two cuff MAPs measured immediately before and after an applanation sweep.
- Two additional files were acquired with an additional constraint of sweeping down to a minimum diastolic value less than 30 mm Hg below the true diastole (specifically files 11 and 12).
- the data files were acquired using a variety of sensor geometries, position angles (steel mount angles are varied and unknown), and subjects, as illustrated in Table 1.
- the MAP in 6 new data files was estimated and compared to the cuff MAP. For each comparison, the mean and standard deviation of the MAP difference was calculated. The paired, two-sided t test was used to assess significant differences between methods, using a 95% confidence interval.
- the maximum pulsatile MAP difference was 15 ⁇ 17 mm Hg; the maximum time-frequency MAP difference was 3 ⁇ 11 mm Hg.
- the maximum pulsatile MAP difference was 19 ⁇ 15 mm Hg; the maximum time-frequency MAP difference was 3 ⁇ 5 mm Hg.
- the results obtained from the maximum time-frequency method were significantly different from those obtained using the maximum pulsatile method (p ⁇ 0.02 and p ⁇ 0.03, respectively).
- Applicant obtained data in 10 second intervals from three different human subjects in a hospital operating room. During these 10 second intervals, data was sampled at 400 Hz, and decimated to 100 Hz. The mean arterial pressures (MAPs) measured for each of the three subjects were 73, 126, and 83 mm Hg, respectively. These means were subtracted from the respective data sets for each subject, and fit to the ARX model using various combinations of N and M, as illustrated in Table B-1:
- the reported catheter pressure was averaged from the first, middle, and last waveforms obtained during a decreasing applanation sweep.
- the mean error in MAP was 11 ⁇ 20 mm Hg.
- FIG. B- 1 Time-Frequency Estimated MAP Versus Average Catheter MAP
- FIG. B- 2 Wavelet Estimated Diastole Versus Average Catheter Diastole
- FIG. B- 3 Maximum Pulsatile Estimated MAP Versus Average Catheter MAP
- the end-diastolic velocity is maximized.
- the catheter MAP dropped dramatically over 11 minutes.
- the maximum catheter MAP was 132 mm Hg; the minimum catheter MAP was 79 mm Hg.
- the mean error of the controller, compared to catheter MAP pressure was 3 ⁇ 4 mm Hg.
- a significant drop in the end-diastolic velocity was corrected within 5 beats.
Abstract
Description
where fo is the transmitted signal frequency, θ is the transmission angle of the acoustic energy referenced to a vector normal to the longitudinal axis of the artery, and c is the speed of sound in soft tissue.
where dθ and dτ are dummy integration variables, λ(θ, τ) is a two-dimensional function known as a “kernel”, and u(t) is the input signal. The simplest distribution is the Wigner or Wigner-Ville distribution, which uses a kernel of λ(θ, τ)=1. Note that Eqn. 2 uses continuous time, t, while an actual implementation of the distribution requires discrete time, n. Next, using discrete frequency, k, the discrete time description of the Wigner distribution (also known as a Pseudo Wigner distribution) is formed per
where
and its complex conjugate are sample-limited to {−K/2,+K/2}, K is even, and N=K+1. Next, in
Eqn. 4 is equivalent to direct integration of the autocorrelation of a signal, scaled by a factor of 2. Autocorrelation is well known in the signal processing arts. In
ωd=2πfd. (Eqn. 5)
The angular frequency ωd is integrated; this integration results in the phase of the detected signal echo, φ, as illustrated in Eqn. 6:
φ=∫ωddt. (Eqn. 6)
As is well known in the art, the low frequencies in the phase echo are proportional to the relative arterial diameter of the artery, d. See, e.g., Hoeks, A. P. G., et al, “Transcutaneous detection of relative changes in artery diameter” Ultrasound Med & Biol, 11:51-59, 1985. The phase φ of the detected echo is a function of the time delay between reflection from the near and far arterial walls. Because the time delay depends only on the time difference between reflections from the two arterial walls, the measurement is insensitive to transmission angle. Note that only the relative arterial diameter changes from an initial diameter value during overcompression can be estimated. The relative arterial diameter d is therefore related to the phase using Eqn. 7:
where:
- n=a discrete time sample,
- u(n)=the catheter arterial pressure,
- yservo(n)=the pressure from a sensor positioned at the radial artery with sufficient pressure applied so that the sensed MAP equals the catheter MAP,
- ai=feedback coefficient,
- bi=feedforward coefficient,
- N=number of feedback coefficients and model order, and
- M=number of feedforward coefficients.
In this model, a0 is chosen to be equal to 1, although other values may be used. The mean arterial pressure values obtained from the subject(s) are subtracted from their respective data sets, and fit to the ARX model, using various combinations of N and M. The optimum model order N is determined using standard criteria well known to those skilled in the art. Specifically, in the illustrated embodiment, the Akaike Final Prediction Error Criterion, standard deviations associated with identified parameter estimates (precision of estimates), and residuals between the estimated and catheter waveforms are used, although it will be recognized that other criteria may be substituted. In the present embodiment, a zeroeth order model with one feedforward coefficient is chosen. Appendix B provides exemplary anecdotal data illustrating the foregoing process.FIG. 13 graphically illustrates the fit between the catheter data and the aforementioned zeroeth order model for an exemplary subject (subject No. 2 from Appendix B).
where x(n) is the blood velocity signal, L is the length of the signal (i.e., the total number of samples in the blood velocity signal), and φh(n) is the Haar scaling function as is well known in the mathematical arts. The Haar scaling function is defined as
Note that the length of the wavelet transform is ½6= 1/64 the length L of the input signal. Hence, in essence, the transform functions as a low pass filter as illustrated in
where n′ is the sample identified by the time-frequency algorithm during which the measured MAP corresponds to the catheter MAP, and n* is the sample identified by the wavelet algorithm during which the measured MAP corresponds to the catheter diastole. For the waveforms associated with the zeroeth order model previously described (see Appendix B),
In one embodiment, this scaling factor is only calculated intermittently during a calibration sweep.
Fuzzy Logic Controller and MAP Servo
y scaled(n)=F 1(y servo(n)−MAPservo)+MAPservo. (13)
Scaling During Steady State Pressure
y scaled(n)=F 2(y ss(n)−MAPss)+MAP(n′). (14)
During continuous blood pressure estimation, the system will alternate between periods of servoing to the catheter MAP while blood pressure is in flux, and periods of applying a low constant applanation pressure while blood pressure is in steady state.
Blood Vessel Location and Positioning
Y sin(nT)=a(nT)sin(2πf c nT) (Eqn. 15)
Y cos(nT)=a(nT)cos(2πf c nT) (Eqn. 16)
Where a(nT) denote the ‘raw’ A-mode signal with sampling interval T=1/Fs, and Fs denotes the sample rate (e.g., 64 MHz). This multiplication is performed for the entire duration of the A-mode line. The in-phase and quadrature components, XI(nTD) and XQ(nTD) respectively, are produced by lowpass filtering Ycos(nT) and Ysin(nT). Here, TD denotes the decimated sampling interval.
|E sq(nT D)|=√{square root over (X I 2(nT D)+X Q 2(nT D))}{square root over (X I 2(nT D)+X Q 2(nT D))} (Eqn. 17)
However, rather than calculate the magnitude of the envelope, the subsequent signal processing may be applied to the non-square-rooted signal, referred to herein as the “envelope-squared.” This latter approach alleviates the need to perform the square root operation, thereby simplifying the resulting algorithmic implementation somewhat. The envelope-squared waveform is depicted in
E sq(nT D)=X I 2(nT D)+X Q 2(nT D) (Eqn. 18)
In order to better assess the level of the signal associated with the lumen within the confines of the arterial walls, the logarithm (base 10) of the envelope-squared signal is obtained as shown in
gain=depth (Eqn. 19)
Here the depth is assumed to be in millimeters, and the gain is applied to the envelope-squared. It will be recognized, however, that other gain functions may readily be applied either in place or in concert with that of Eqn. 19 above. Such gain functions may be empirically determined, such as through clinical testing, or determined via other means such as mathematical derivation or anecdotal or historical sampling of the A-mode signal or other parameters related thereto.
P int(k)=P int(k−1)+P(k) (Eqn. 20)
where Pint(k) denotes the power integrated up to the kth sample of the envelope-squared sequence, and P(k) denotes the kth sample of the envelope-squared sequence. The
where Mcnt(k) denotes the sum of the counts in three consecutive intervals ending with the kth interval, and m(n) denotes the number of samples in the nth interval. This metric is shown in
Note that the count, m(k+2), two intervals ahead of the group of three consecutive intervals, is incorporated into Eqn. 22. A plot of this metric for a single A-mode line is shown in
where L denotes the number of samples prior to the lumen area, and K denotes the “pointer” to the third of the three consecutive intervals for which the peak was detected.
D=ct/2 (Eqn. 24)
where:
-
- D=depth,
- c=speed of propagation,
- t=time of propagation
The factor of 2 in Eqn. 24 accounts for bi-directional acoustic wave propagation. For a sampling rate of 16 MHz as previously described, 1.33 usec corresponds to approximately 22 samples along the de-sampled A-mode line.
where Pbk(m) denotes the integrated power in the direction of the back wall starting at sample Kst up to sample m, and P(k) denotes the kth sample of the square of the envelope of the A-mode signal. When Pbk(m) exceeds the prescribed threshold, the back wall is assumed detected and the corresponding sample value, m, denotes the depth of the back wall (step 3206). Note that the sample number along the A-mode line and depth are related; the actual depth is derived from the sample number as shown in Eqn 28:
D=cN samp/2F s (Eqn. 28)
where c denotes the speed of propagation, Nsamp denotes the sample number, and Fs denotes the sampling rate associated with the envelope-squared sequence.
| TABLE 1 |
| Learning Data |
| Mean Cuff | Arterial | Time- | ||||
| Avg. | Max Pulsatile | Frequency | ||||
| Sensor | Pressure | Estimate | Estimate | |||
| File | Subject | Sensor | Position | (mm hg) | (mm Hg) | (mm Hg) |
| 1 | 1 | mo30 | steel mount | 108 | 122 | 103 | |
| 2 | 2 | mo30 | steel mount | 88 | 90 | 82 | |
| 3 | 3 | mo30 | steel mount | 68 | 85 | 84 | |
| 4 | 4 | mo30 | steel mount | 88 | 83 | 83 | |
| 5 | 4 | | 0° pitch, 0° roll | 85 | 90 | 86 | |
| 6 | 5 | dc22 | −10° pitch, +10° roll | 63 | 51 | 58 | |
| 7 | 2 | dc22 | −10° pitch, −10° roll | 84 | 90 | 92 | |
| 8 | 6 | | 0° pitch, 0° roll | 77 | 104 | 105 | |
| 9 | 7 | dc29 | +10° pitch, −10° roll | 88 | 107 | 81 | |
| 10 | 8 | | steel mount | 98 | 135 | 105 | |
| 11 | 6 | | 0° pitch, 0° roll | 82 | 124 | 87 | |
| 12 | 3 | | 0° pitch, 0° roll | 73 | 102 | 71 | |
| | 15 ± 17 | 3 ± 11 | |||||
| (mm Hg): | |||||||
In each file, MAP was estimated by searching for the maximal pulsatile pressure. MAP was also estimated by determining the MAP associated with a pressure waveform with the maximal mean time-frequency distribution. The Pseudo Wigner distribution of the velocity, with k=0, calculated. Within each pressure waveform time interval, the mean distribution value was then calculated. The algorithm for calculating the maximal time-frequency distribution was “tuned” to the 12 files. By tuning, secondary algorithm steps such as the determination of the choice of the first pressure and velocity waveforms to be analyzed within a sweep were optimized. Also, the MAP differences using the maximum mean distribution versus maximum diastolic distribution were evaluated. While the results from both methods were insignificantly different, the maximum mean distribution was easier to calculate.
| TABLE 2 |
| Testing Data |
| Mean | Arterial | Time- | ||||
| Cuff Avg. | Max Pulsatile | Frequency | ||||
| Sensor | Pressure | Estimate | Estimate | |||
| File | Subject | Sensor | Position | (mm Hg) | (mm Hg) | (mm Hg) |
| 13 | 9 | Mo30 | steel mount | 73 | 93 | 73 |
| 14 | 4 | | 0° pitch, 0° | 79 | 97 | 89 |
| 15 | 8 | Mo30 | steel mount | 88 | 114 | 95 |
| 16 | 2 | Mo30 | steel mount | 88 | 101 | 85 |
| 17 | 5 | Dc22 | +10° pitch, −10° roll | 64 | 60 | 64 |
| 18 | 2 | Dc33 | +10° pitch, −10° | 79 | 120 | 85 |
| MAP error | 19 ± 15 | 3 ± 5 | ||||
| (mm Hg): | ||||||
Results
| TABLE B-1 |
| Combinations of Model Orders (N) and |
| Number of Feedforward Coefficients (M) |
| | M | ||
| 4 | 3 | ||
| 10 | 9 | ||
| 2 | 1 | ||
| 1 | 1 | ||
| 0 | 1 | ||
For all three subjects, the optimum model was a zeroeth order model with one feedforward coefficient. The identified feedforward coefficients and their associated standards of deviation are shown in Table B-2.
| TABLE B-2 |
| Identified Feedforward Coefficients |
| Subject | Mean (mm Hg) | b0 | | ||
| 1 | 77 | 0.75 | 0.003 | ||
| 2 | 121 | 0.86 | 0.001 | ||
| 3 | 81 | 0.80 | 0.003 | ||
Estimate of Diastolic Pressure

FIG. B-1. Time-Frequency Estimated MAP Versus Average Catheter MAP
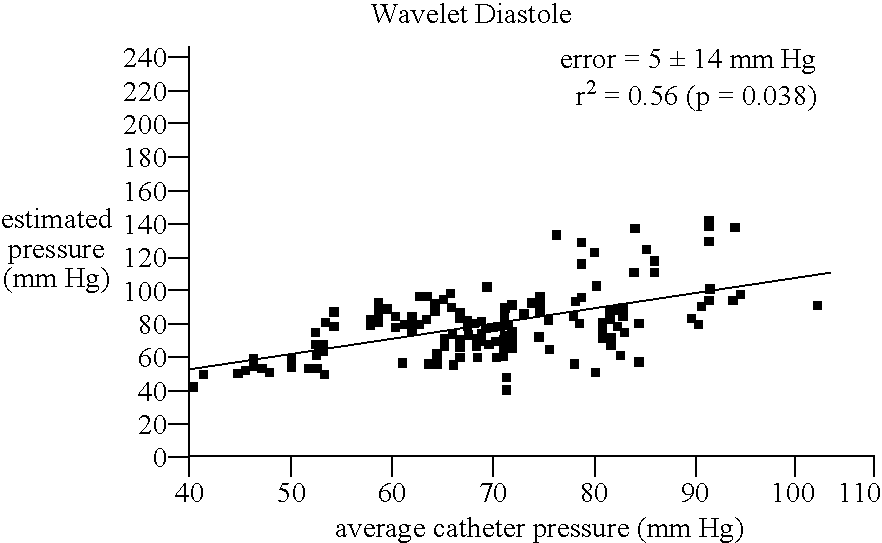

| TABLE C-1 |
| Preliminary results of MAP servo control. |
| [Note: Following results are based on different subjects than the |
| results used as the basis for FIGS. 17-19] |
| Patient | Data Set | Pressure Range | # Beats | Error (mm Hg) |
| 1 | 1 | 69-106 | 653 | −1 ± 5 |
| 1 | 2 | 82-93 | 830 | −6 ± 6 |
| 2 | 1 | 73-83 | 747 | −1 ± 4 |
| 2 | 2 | 81-93 | 873 | −4 ± 6 |
| TOTAL: 3,103 | MEAN: −3 ± 5 | |||
Claims (32)
Priority Applications (1)
| Application Number | Priority Date | Filing Date | Title |
|---|---|---|---|
| US09/815,982 US7503896B2 (en) | 1999-06-29 | 2001-03-22 | Method and apparatus for the noninvasive assessment of hemodynamic parameters including blood vessel location |
Applications Claiming Priority (2)
| Application Number | Priority Date | Filing Date | Title |
|---|---|---|---|
| US09/342,549 US6471655B1 (en) | 1999-06-29 | 1999-06-29 | Method and apparatus for the noninvasive determination of arterial blood pressure |
| US09/815,982 US7503896B2 (en) | 1999-06-29 | 2001-03-22 | Method and apparatus for the noninvasive assessment of hemodynamic parameters including blood vessel location |
Related Parent Applications (1)
| Application Number | Title | Priority Date | Filing Date |
|---|---|---|---|
| US09/342,549 Continuation-In-Part US6471655B1 (en) | 1999-06-29 | 1999-06-29 | Method and apparatus for the noninvasive determination of arterial blood pressure |
Publications (2)
| Publication Number | Publication Date |
|---|---|
| US20020055680A1 US20020055680A1 (en) | 2002-05-09 |
| US7503896B2 true US7503896B2 (en) | 2009-03-17 |
Family
ID=23342314
Family Applications (3)
| Application Number | Title | Priority Date | Filing Date |
|---|---|---|---|
| US09/342,549 Expired - Lifetime US6471655B1 (en) | 1999-06-29 | 1999-06-29 | Method and apparatus for the noninvasive determination of arterial blood pressure |
| US09/489,160 Expired - Fee Related US6514211B1 (en) | 1999-06-29 | 2000-01-21 | Method and apparatus for the noninvasive determination of arterial blood pressure |
| US09/815,982 Expired - Fee Related US7503896B2 (en) | 1999-06-29 | 2001-03-22 | Method and apparatus for the noninvasive assessment of hemodynamic parameters including blood vessel location |
Family Applications Before (2)
| Application Number | Title | Priority Date | Filing Date |
|---|---|---|---|
| US09/342,549 Expired - Lifetime US6471655B1 (en) | 1999-06-29 | 1999-06-29 | Method and apparatus for the noninvasive determination of arterial blood pressure |
| US09/489,160 Expired - Fee Related US6514211B1 (en) | 1999-06-29 | 2000-01-21 | Method and apparatus for the noninvasive determination of arterial blood pressure |
Country Status (5)
| Country | Link |
|---|---|
| US (3) | US6471655B1 (en) |
| EP (1) | EP1196084A1 (en) |
| JP (1) | JP2003503094A (en) |
| AU (1) | AU5774100A (en) |
| WO (1) | WO2001000087A1 (en) |
Cited By (21)
| Publication number | Priority date | Publication date | Assignee | Title |
|---|---|---|---|---|
| US20060206032A1 (en) * | 2000-03-23 | 2006-09-14 | Miele Frank R | Method and apparatus for assessing hemodynamic parameters within the circulatory system of a living subject |
| US20100121206A1 (en) * | 2008-11-12 | 2010-05-13 | Samsung Electronics Co., Ltd. | Pressurizing module and blood pressure measuring device including the same |
| US20110105901A1 (en) * | 2007-12-20 | 2011-05-05 | Gifu University | Image processing apparatus, image processing program, storage medium, and ultra-sonic diagnostic apparatus |
| US20110112402A1 (en) * | 2007-12-20 | 2011-05-12 | Gifu University | Image processing apparatus, image processing program, storage medium and ultra-sonograph |
| US20140276071A1 (en) * | 2013-03-14 | 2014-09-18 | HighDim GmbH | Apparatus and methods for computing cardiac output of a living subject |
| US9179843B2 (en) | 2011-04-21 | 2015-11-10 | Hassan Ghaderi MOGHADDAM | Method and system for optically evaluating proximity to the inferior alveolar nerve in situ |
| US20150366464A1 (en) * | 2014-06-18 | 2015-12-24 | Hong Kong Applied Science and Technology Research Institute Company Limited | Method and device for tonometric blood pressure measurement |
| US9320445B2 (en) | 2011-05-17 | 2016-04-26 | Siemens Medical Solutions Usa, Inc. | System for cardiac condition detection responsive to blood pressure analysis |
| US9585638B2 (en) | 2010-03-06 | 2017-03-07 | Russell Dewey | System for classifying palpable soft tissue masses using A-mode echographs |
| US9655530B2 (en) | 2011-04-29 | 2017-05-23 | Tensys Medical, Inc. | Apparatus and methods for non-invasively measuring physiologic parameters of one or more subjects |
| US9949696B2 (en) | 2013-03-14 | 2018-04-24 | Tensys Medical, Inc. | Apparatus and methods for computing cardiac output of a living subject via applanation tonometry |
| US10285598B2 (en) | 2006-05-13 | 2019-05-14 | United States Gtm Medical Devices | Continuous positioning apparatus and methods |
| US10517489B2 (en) | 2014-09-08 | 2019-12-31 | Apple Inc. | Wrist worn accelerometer for pulse transit time (PTT) measurements of blood pressure |
| US10588577B2 (en) | 2015-01-29 | 2020-03-17 | Siemens Healthcare Gmbh | Patient signal analysis based on affine template matching |
| US10702171B2 (en) | 2014-09-08 | 2020-07-07 | Apple Inc. | Systems, devices, and methods for measuring blood pressure of a user |
| US10709421B2 (en) * | 2016-02-10 | 2020-07-14 | Canon Medical Systems Corporation | Ultrasound diagnostic apparatus |
| US10772512B2 (en) | 2014-09-08 | 2020-09-15 | Apple Inc. | Blood pressure monitoring using a multi-function wrist-worn device |
| US10779738B2 (en) | 2014-09-08 | 2020-09-22 | Apple Inc. | Electrical coupling of pulse transit time (PTT) measurement system to heart for blood pressure measurement |
| US10952675B2 (en) | 2007-10-12 | 2021-03-23 | Shangyi Medical Technology (Hangzhou) Co., Ltd | Apparatus and methods for non-invasively measuring a patient's arterial blood pressure |
| US10962490B2 (en) | 2015-12-28 | 2021-03-30 | University Of Washington | Methods for aligning a spectrometer |
| US11918795B2 (en) | 2019-05-01 | 2024-03-05 | Bard Access Systems, Inc. | Puncturing devices, puncturing systems including the puncturing devices, and methods thereof |
Families Citing this family (171)
| Publication number | Priority date | Publication date | Assignee | Title |
|---|---|---|---|---|
| US5797850A (en) * | 1993-11-09 | 1998-08-25 | Medwave, Inc. | Method and apparatus for calculating blood pressure of an artery |
| US6027452A (en) * | 1996-06-26 | 2000-02-22 | Vital Insite, Inc. | Rapid non-invasive blood pressure measuring device |
| IES81060B2 (en) | 1997-11-07 | 2000-01-12 | Salviac Ltd | An embolic protection device |
| US6471655B1 (en) * | 1999-06-29 | 2002-10-29 | Vitalwave Corporation | Method and apparatus for the noninvasive determination of arterial blood pressure |
| EP1142531B1 (en) * | 2000-04-04 | 2005-06-29 | STMicroelectronics S.r.l. | Portable automatic sphygmomanometer with monitoring and classification of the physical activity of a patient by means of fuzzy logics processing |
| US20020077558A1 (en) * | 2000-12-13 | 2002-06-20 | Kazunobu Itonaga | Vital sign detection device |
| US7317409B2 (en) | 2002-01-30 | 2008-01-08 | Tensys Medical, Inc. | Apparatus and method for interfacing time-variant signals |
| US6730038B2 (en) | 2002-02-05 | 2004-05-04 | Tensys Medical, Inc. | Method and apparatus for non-invasively measuring hemodynamic parameters using parametrics |
| US20050144042A1 (en) * | 2002-02-19 | 2005-06-30 | David Joffe | Associated systems and methods for managing biological data and providing data interpretation tools |
| KR20050044899A (en) * | 2002-08-01 | 2005-05-13 | 텐시스 메디칼 인코포레이티드 | Method and apparatus for control of non-invasive parameter measurments |
| US6974419B1 (en) * | 2002-08-01 | 2005-12-13 | Tensys Medical, Inc. | Method and apparatus for control of non-invasive parameter measurements |
| US20040073123A1 (en) * | 2002-10-11 | 2004-04-15 | Hessel Stephen R. | Apparatus and methods for non-invasively measuring hemodynamic parameters |
| US20060184051A1 (en) * | 2002-10-11 | 2006-08-17 | Hempstead Russell D | Apparatus and methods for non-invasively measuring hemodynamic parameters |
| US20050080345A1 (en) * | 2002-10-11 | 2005-04-14 | Finburgh Simon E. | Apparatus and methods for non-invasively measuring hemodynamic parameters |
| US20040153076A1 (en) * | 2002-10-29 | 2004-08-05 | Wamis Singhatat | Ligament graft cage fixation device |
| US7094978B2 (en) * | 2002-11-15 | 2006-08-22 | Mitutoyo Corporation | System and method for generating a high speed estimated position output for a position encoder |
| US20050148882A1 (en) * | 2004-01-06 | 2005-07-07 | Triage Wireless, Incc. | Vital signs monitor used for conditioning a patient's response |
| JP2006524546A (en) * | 2003-04-23 | 2006-11-02 | ヘムチャンドラ・シャートゥクド | Apparatus and method for non-invasive diagnosis of coronary artery disease |
| US7455643B1 (en) | 2003-07-07 | 2008-11-25 | Nellcor Puritan Bennett Ireland | Continuous non-invasive blood pressure measurement apparatus and methods providing automatic recalibration |
| US7429245B2 (en) * | 2003-07-14 | 2008-09-30 | Welch Allyn, Inc. | Motion management in a fast blood pressure measurement device |
| TWI221407B (en) * | 2003-08-27 | 2004-10-01 | Micro Star Int Co Ltd | Device and method for detecting the location of vein by ultrasound |
| EP1515158B1 (en) * | 2003-09-09 | 2013-07-17 | Esaote S.p.A. | Ultrasound imaging method combined with the presence of contrast media in the body under examination |
| US20060287590A1 (en) * | 2003-09-18 | 2006-12-21 | Mceowen Edwin L | Noninvasive vital sign measurement device |
| US7559894B2 (en) * | 2003-09-18 | 2009-07-14 | New Paradigm Concepts, LLC | Multiparameter whole blood monitor and method |
| US7452333B2 (en) * | 2003-12-05 | 2008-11-18 | Edwards Lifesciences Corporation | Arterial pressure-based, automatic determination of a cardiovascular parameter |
| US7422562B2 (en) * | 2003-12-05 | 2008-09-09 | Edwards Lifesciences | Real-time measurement of ventricular stroke volume variations by continuous arterial pulse contour analysis |
| US7220230B2 (en) | 2003-12-05 | 2007-05-22 | Edwards Lifesciences Corporation | Pressure-based system and method for determining cardiac stroke volume |
| US7125383B2 (en) * | 2003-12-30 | 2006-10-24 | General Electric Company | Method and apparatus for ultrasonic continuous, non-invasive blood pressure monitoring |
| US7425199B2 (en) | 2003-12-30 | 2008-09-16 | General Electric Company | Method and apparatus for ultrasonic continuous, non-invasive blood pressure monitoring |
| WO2005077004A2 (en) * | 2004-02-10 | 2005-08-25 | Cardiovascular Resonances, Llc | Methods, systems, and computer program products for analyzing cardiovascular sounds using eigen functions |
| US20050216199A1 (en) * | 2004-03-26 | 2005-09-29 | Triage Data Networks | Cuffless blood-pressure monitor and accompanying web services interface |
| US20080287813A1 (en) * | 2004-03-30 | 2008-11-20 | Eidgenossische Technische Hochschule Zurich | Blood Pressure Monitoring Device and Methods for Making and for Using Such a Device |
| US20050228297A1 (en) * | 2004-04-07 | 2005-10-13 | Banet Matthew J | Wrist-worn System for Measuring Blood Pressure |
| US20060009698A1 (en) * | 2004-04-07 | 2006-01-12 | Triage Wireless, Inc. | Hand-held monitor for measuring vital signs |
| US20050228244A1 (en) * | 2004-04-07 | 2005-10-13 | Triage Wireless, Inc. | Small-scale, vital-signs monitoring device, system and method |
| US7179228B2 (en) * | 2004-04-07 | 2007-02-20 | Triage Wireless, Inc. | Cuffless system for measuring blood pressure |
| US20060009697A1 (en) * | 2004-04-07 | 2006-01-12 | Triage Wireless, Inc. | Wireless, internet-based system for measuring vital signs from a plurality of patients in a hospital or medical clinic |
| US7238159B2 (en) * | 2004-04-07 | 2007-07-03 | Triage Wireless, Inc. | Device, system and method for monitoring vital signs |
| US20050261598A1 (en) * | 2004-04-07 | 2005-11-24 | Triage Wireless, Inc. | Patch sensor system for measuring vital signs |
| US20050228300A1 (en) * | 2004-04-07 | 2005-10-13 | Triage Data Networks | Cuffless blood-pressure monitor and accompanying wireless mobile device |
| US7004907B2 (en) * | 2004-04-07 | 2006-02-28 | Triage Wireless, Inc. | Blood-pressure monitoring device featuring a calibration-based analysis |
| US20050261572A1 (en) * | 2004-05-20 | 2005-11-24 | Babaliaros Vasilis Constantino | Limb stabilizer for ultra sound detector |
| US7946994B2 (en) | 2004-10-07 | 2011-05-24 | Tensys Medical, Inc. | Compact apparatus and methods for non-invasively measuring hemodynamic parameters |
| US20060084878A1 (en) * | 2004-10-18 | 2006-04-20 | Triage Wireless, Inc. | Personal computer-based vital signs monitor |
| US7658716B2 (en) * | 2004-12-07 | 2010-02-09 | Triage Wireless, Inc. | Vital signs monitor using an optical ear-based module |
| US20070055151A1 (en) * | 2005-01-20 | 2007-03-08 | Shertukde Hemchandra M | Apparatus and methods for acoustic diagnosis |
| EP1712182B1 (en) * | 2005-04-14 | 2020-12-30 | Esaote S.p.A. | Method of ultrasonic detection and localization of contrast agent microbubbles and method for local drug administration by using microbubble carriers |
| US8784336B2 (en) | 2005-08-24 | 2014-07-22 | C. R. Bard, Inc. | Stylet apparatuses and methods of manufacture |
| US7420472B2 (en) * | 2005-10-16 | 2008-09-02 | Bao Tran | Patient monitoring apparatus |
| US7733224B2 (en) | 2006-06-30 | 2010-06-08 | Bao Tran | Mesh network personal emergency response appliance |
| US7618370B2 (en) * | 2006-05-09 | 2009-11-17 | Device Evolutions Llc | Venous-arterial detector and pressure indicator |
| US8968195B2 (en) | 2006-05-12 | 2015-03-03 | Bao Tran | Health monitoring appliance |
| US8684922B2 (en) | 2006-05-12 | 2014-04-01 | Bao Tran | Health monitoring system |
| US7558622B2 (en) | 2006-05-24 | 2009-07-07 | Bao Tran | Mesh network stroke monitoring appliance |
| US8500636B2 (en) | 2006-05-12 | 2013-08-06 | Bao Tran | Health monitoring appliance |
| US9060683B2 (en) | 2006-05-12 | 2015-06-23 | Bao Tran | Mobile wireless appliance |
| US7539532B2 (en) | 2006-05-12 | 2009-05-26 | Bao Tran | Cuffless blood pressure monitoring appliance |
| US8323189B2 (en) | 2006-05-12 | 2012-12-04 | Bao Tran | Health monitoring appliance |
| US8684900B2 (en) | 2006-05-16 | 2014-04-01 | Bao Tran | Health monitoring appliance |
| US7539533B2 (en) * | 2006-05-16 | 2009-05-26 | Bao Tran | Mesh network monitoring appliance |
| US7993275B2 (en) | 2006-05-25 | 2011-08-09 | Sotera Wireless, Inc. | Bilateral device, system and method for monitoring vital signs |
| US9149192B2 (en) | 2006-05-26 | 2015-10-06 | Sotera Wireless, Inc. | System for measuring vital signs using bilateral pulse transit time |
| EP2034884A4 (en) * | 2006-06-21 | 2009-11-04 | Daeyo Medi Co Ltd | Apparatus for analysing pulse using array of pressure sensors |
| US9820658B2 (en) | 2006-06-30 | 2017-11-21 | Bao Q. Tran | Systems and methods for providing interoperability among healthcare devices |
| GB0613739D0 (en) * | 2006-07-11 | 2006-08-23 | Univ Belfast | Improvements relating to the assessment of blood velocity signals |
| US20080021334A1 (en) * | 2006-07-19 | 2008-01-24 | Finburgh Simon E | Apparatus and methods for non-invasively measuring hemodynamic parameters |
| US8442607B2 (en) | 2006-09-07 | 2013-05-14 | Sotera Wireless, Inc. | Hand-held vital signs monitor |
| US8388546B2 (en) | 2006-10-23 | 2013-03-05 | Bard Access Systems, Inc. | Method of locating the tip of a central venous catheter |
| US7794407B2 (en) | 2006-10-23 | 2010-09-14 | Bard Access Systems, Inc. | Method of locating the tip of a central venous catheter |
| US8449469B2 (en) | 2006-11-10 | 2013-05-28 | Sotera Wireless, Inc. | Two-part patch sensor for monitoring vital signs |
| US8790263B2 (en) * | 2007-02-05 | 2014-07-29 | Siemens Medical Solutions Usa, Inc. | Automated movement detection with audio and visual information |
| US20080221399A1 (en) * | 2007-03-05 | 2008-09-11 | Triage Wireless, Inc. | Monitor for measuring vital signs and rendering video images |
| US8142200B2 (en) * | 2007-03-26 | 2012-03-27 | Liposonix, Inc. | Slip ring spacer and method for its use |
| US8750971B2 (en) * | 2007-05-24 | 2014-06-10 | Bao Tran | Wireless stroke monitoring |
| CN101677810B (en) * | 2007-06-04 | 2012-04-04 | 松下电器产业株式会社 | Ultrasonic diagnosis device |
| US20100130875A1 (en) * | 2008-06-18 | 2010-05-27 | Triage Wireless, Inc. | Body-worn system for measuring blood pressure |
| US20100094140A1 (en) * | 2007-09-20 | 2010-04-15 | Mindaugas Pranevicius | Noninvasive Method and Apparatus to Measure Body Pressure Using Extrinsic Perturbation |
| US20090118628A1 (en) * | 2007-11-01 | 2009-05-07 | Triage Wireless, Inc. | System for measuring blood pressure featuring a blood pressure cuff comprising size information |
| CN101925333B (en) | 2007-11-26 | 2014-02-12 | C·R·巴德股份有限公司 | Integrated system for intravascular placement of catheter |
| US9649048B2 (en) | 2007-11-26 | 2017-05-16 | C. R. Bard, Inc. | Systems and methods for breaching a sterile field for intravascular placement of a catheter |
| US10449330B2 (en) | 2007-11-26 | 2019-10-22 | C. R. Bard, Inc. | Magnetic element-equipped needle assemblies |
| US10524691B2 (en) | 2007-11-26 | 2020-01-07 | C. R. Bard, Inc. | Needle assembly including an aligned magnetic element |
| US8849382B2 (en) | 2007-11-26 | 2014-09-30 | C. R. Bard, Inc. | Apparatus and display methods relating to intravascular placement of a catheter |
| US10751509B2 (en) | 2007-11-26 | 2020-08-25 | C. R. Bard, Inc. | Iconic representations for guidance of an indwelling medical device |
| US8781555B2 (en) | 2007-11-26 | 2014-07-15 | C. R. Bard, Inc. | System for placement of a catheter including a signal-generating stylet |
| US9521961B2 (en) | 2007-11-26 | 2016-12-20 | C. R. Bard, Inc. | Systems and methods for guiding a medical instrument |
| US9636031B2 (en) | 2007-11-26 | 2017-05-02 | C.R. Bard, Inc. | Stylets for use with apparatus for intravascular placement of a catheter |
| EP2078495A1 (en) * | 2008-01-14 | 2009-07-15 | Nathalie Grimaldi | Probe holder for use in ultrasound imaging guidance |
| US20090270739A1 (en) * | 2008-01-30 | 2009-10-29 | Edwards Lifesciences Corporation | Real-time detection of vascular conditions of a subject using arterial pressure waveform analysis |
| US8478382B2 (en) | 2008-02-11 | 2013-07-02 | C. R. Bard, Inc. | Systems and methods for positioning a catheter |
| US8814798B2 (en) * | 2008-04-25 | 2014-08-26 | Medtronic, Inc. | Implantable device and method for monitoring venous diameter |
| US8989837B2 (en) | 2009-12-01 | 2015-03-24 | Kyma Medical Technologies Ltd. | Methods and systems for determining fluid content of tissue |
| US8660799B2 (en) | 2008-06-30 | 2014-02-25 | Nellcor Puritan Bennett Ireland | Processing and detecting baseline changes in signals |
| US20090326386A1 (en) * | 2008-06-30 | 2009-12-31 | Nellcor Puritan Bennett Ireland | Systems and Methods for Non-Invasive Blood Pressure Monitoring |
| US8398556B2 (en) | 2008-06-30 | 2013-03-19 | Covidien Lp | Systems and methods for non-invasive continuous blood pressure determination |
| US8506498B2 (en) | 2008-07-15 | 2013-08-13 | Nellcor Puritan Bennett Ireland | Systems and methods using induced perturbation to determine physiological parameters |
| US9901714B2 (en) | 2008-08-22 | 2018-02-27 | C. R. Bard, Inc. | Catheter assembly including ECG sensor and magnetic assemblies |
| US9301697B2 (en) | 2008-09-30 | 2016-04-05 | Nellcor Puritan Bennett Ireland | Systems and methods for recalibrating a non-invasive blood pressure monitor |
| US9314168B2 (en) | 2008-09-30 | 2016-04-19 | Nellcor Puritan Bennett Ireland | Detecting sleep events using localized blood pressure changes |
| US9687161B2 (en) | 2008-09-30 | 2017-06-27 | Nellcor Puritan Bennett Ireland | Systems and methods for maintaining blood pressure monitor calibration |
| US8532751B2 (en) | 2008-09-30 | 2013-09-10 | Covidien Lp | Laser self-mixing sensors for biological sensing |
| US8437833B2 (en) | 2008-10-07 | 2013-05-07 | Bard Access Systems, Inc. | Percutaneous magnetic gastrostomy |
| KR101504600B1 (en) * | 2008-11-06 | 2015-03-23 | 삼성전자주식회사 | Apparatus and method for measuring blood pressure |
| WO2010057495A2 (en) * | 2008-11-18 | 2010-05-27 | Sense A/S | Methods, apparatus and sensor for measurement of cardiovascular quantities |
| US8216136B2 (en) | 2009-03-05 | 2012-07-10 | Nellcor Puritan Bennett Llc | Systems and methods for monitoring heart rate and blood pressure correlation |
| JP2010269060A (en) * | 2009-05-25 | 2010-12-02 | Tohoku Univ | Array type ultrasonic pulse wave measuring sheet |
| US9204857B2 (en) * | 2009-06-05 | 2015-12-08 | General Electric Company | System and method for monitoring hemodynamic state |
| JP5795576B2 (en) | 2009-06-12 | 2015-10-14 | バード・アクセス・システムズ,インコーポレーテッド | Method of operating a computer-based medical device that uses an electrocardiogram (ECG) signal to position an intravascular device in or near the heart |
| US9532724B2 (en) | 2009-06-12 | 2017-01-03 | Bard Access Systems, Inc. | Apparatus and method for catheter navigation using endovascular energy mapping |
| US20100324431A1 (en) * | 2009-06-18 | 2010-12-23 | Nellcor Puritan Bennett Ireland | Determining Disease State Using An Induced Load |
| US8290730B2 (en) | 2009-06-30 | 2012-10-16 | Nellcor Puritan Bennett Ireland | Systems and methods for assessing measurements in physiological monitoring devices |
| US9198582B2 (en) | 2009-06-30 | 2015-12-01 | Nellcor Puritan Bennett Ireland | Determining a characteristic physiological parameter |
| US20110021929A1 (en) * | 2009-07-27 | 2011-01-27 | Nellcor Puritan Bennett Ireland | Systems and methods for continuous non-invasive blood pressure monitoring |
| US8628477B2 (en) * | 2009-07-31 | 2014-01-14 | Nellcor Puritan Bennett Ireland | Systems and methods for non-invasive determination of blood pressure |
| WO2011019760A2 (en) | 2009-08-10 | 2011-02-17 | Romedex International Srl | Devices and methods for endovascular electrography |
| US9220440B2 (en) | 2009-09-21 | 2015-12-29 | Nellcor Puritan Bennett Ireland | Determining a characteristic respiration rate |
| US9066660B2 (en) | 2009-09-29 | 2015-06-30 | Nellcor Puritan Bennett Ireland | Systems and methods for high-pass filtering a photoplethysmograph signal |
| US8463347B2 (en) | 2009-09-30 | 2013-06-11 | Nellcor Puritan Bennett Ireland | Systems and methods for normalizing a plethysmograph signal for improved feature analysis |
| US10639008B2 (en) | 2009-10-08 | 2020-05-05 | C. R. Bard, Inc. | Support and cover structures for an ultrasound probe head |
| US11103213B2 (en) | 2009-10-08 | 2021-08-31 | C. R. Bard, Inc. | Spacers for use with an ultrasound probe |
| EP2531098B1 (en) | 2010-02-02 | 2020-07-15 | C.R. Bard, Inc. | Apparatus and method for catheter navigation and tip location |
| US9451887B2 (en) | 2010-03-31 | 2016-09-27 | Nellcor Puritan Bennett Ireland | Systems and methods for measuring electromechanical delay of the heart |
| US8898037B2 (en) | 2010-04-28 | 2014-11-25 | Nellcor Puritan Bennett Ireland | Systems and methods for signal monitoring using Lissajous figures |
| MX2012013858A (en) | 2010-05-28 | 2013-04-08 | Bard Inc C R | Insertion guidance system for needles and medical components. |
| WO2011150376A1 (en) | 2010-05-28 | 2011-12-01 | C.R. Bard, Inc. | Apparatus for use with needle insertion guidance system |
| MX338127B (en) | 2010-08-20 | 2016-04-04 | Bard Inc C R | Reconfirmation of ecg-assisted catheter tip placement. |
| US20140364749A1 (en) * | 2010-10-21 | 2014-12-11 | Drexel University | Calibration for blood pressure measurements |
| CN103189009B (en) | 2010-10-29 | 2016-09-07 | C·R·巴德股份有限公司 | The bio-impedance auxiliary of Medical Devices is placed |
| EP2637568B1 (en) | 2010-11-08 | 2017-04-12 | Vasonova, Inc. | Endovascular navigation system |
| US8825428B2 (en) | 2010-11-30 | 2014-09-02 | Neilcor Puritan Bennett Ireland | Methods and systems for recalibrating a blood pressure monitor with memory |
| US9259160B2 (en) | 2010-12-01 | 2016-02-16 | Nellcor Puritan Bennett Ireland | Systems and methods for determining when to measure a physiological parameter |
| US9357934B2 (en) | 2010-12-01 | 2016-06-07 | Nellcor Puritan Bennett Ireland | Systems and methods for physiological event marking |
| DK2675349T3 (en) * | 2011-02-17 | 2018-01-08 | Qualcomm Inc | PROCEDURE AND SYSTEM FOR DETERMINING A CARDIOVASCULAR QUANTITY OF A MAMMAL |
| CN103415246B (en) * | 2011-03-01 | 2015-11-25 | 皇家飞利浦有限公司 | For locating the method and apparatus of doppler ultrasound transducer and the system for blood flow measurement for blood flow measurement |
| WO2012117337A1 (en) * | 2011-03-01 | 2012-09-07 | Koninklijke Philips Electronics N.V. | A method and device for positioning a doppler ultrasound transducer for blood flow measurement and a system for blood flow measurement |
| KR20140051284A (en) | 2011-07-06 | 2014-04-30 | 씨. 알. 바드, 인크. | Needle length determination and calibration for insertion guidance system |
| FR2978657B1 (en) * | 2011-08-03 | 2013-08-30 | Echosens | METHOD FOR THE REAL-TIME DETERMINATION OF A PROBABILITY OF THE PRESENCE OF A TARGET BIOLOGICAL TISSUE WITH RESPECT TO AN ULTRASONIC TRANSDUCER |
| USD699359S1 (en) | 2011-08-09 | 2014-02-11 | C. R. Bard, Inc. | Ultrasound probe head |
| USD724745S1 (en) | 2011-08-09 | 2015-03-17 | C. R. Bard, Inc. | Cap for an ultrasound probe |
| US9782077B2 (en) | 2011-08-17 | 2017-10-10 | Masimo Corporation | Modulated physiological sensor |
| WO2013070775A1 (en) | 2011-11-07 | 2013-05-16 | C.R. Bard, Inc | Ruggedized ultrasound hydrogel insert |
| US9060695B2 (en) | 2011-11-30 | 2015-06-23 | Covidien Lp | Systems and methods for determining differential pulse transit time from the phase difference of two analog plethysmographs |
| JP2013146539A (en) * | 2011-12-21 | 2013-08-01 | Nippon Koden Corp | Cuff and method for observing tissue under pressure by using the same |
| CN104837413B (en) | 2012-06-15 | 2018-09-11 | C·R·巴德股份有限公司 | Detect the device and method of removable cap on ultrasonic detector |
| CN103110431B (en) * | 2012-09-12 | 2015-04-01 | 中国科学院深圳先进技术研究院 | Noninvasive continuous blood pressure measurement device |
| EP2710961B1 (en) * | 2012-09-24 | 2019-08-07 | Veinpress GmbH | Pressure measurement device for pressure measurement of a vein or an organ and for combination with an ultrasound measuring unit, and system and method for venous/organ pressure measurement |
| JP5609959B2 (en) * | 2012-12-05 | 2014-10-22 | コニカミノルタ株式会社 | Ultrasonic diagnostic equipment |
| US9865176B2 (en) | 2012-12-07 | 2018-01-09 | Koninklijke Philips N.V. | Health monitoring system |
| US20140330087A1 (en) * | 2013-05-01 | 2014-11-06 | Medsensation, Inc. | Devices and methods for obtaining physiological data |
| WO2016185244A1 (en) * | 2015-05-20 | 2016-11-24 | Elfi-Tech Ltd. | Apparatus and method for optical measurement of cardiovascular fitness, stress and physiological parameters |
| US10680324B2 (en) | 2013-10-29 | 2020-06-09 | Zoll Medical Israel Ltd. | Antenna systems and devices and methods of manufacture thereof |
| WO2015118544A1 (en) | 2014-02-05 | 2015-08-13 | Kyma Medical Technologies Ltd. | Systems, apparatuses and methods for determining blood pressure |
| ES2811323T3 (en) | 2014-02-06 | 2021-03-11 | Bard Inc C R | Systems for the guidance and placement of an intravascular device |
| WO2016019053A1 (en) * | 2014-07-29 | 2016-02-04 | Mayo Foundation For Medical Education And Research | System and method for measurement of longitudinal and circumferential wave speeds in cylindrical vessels |
| JP5701439B1 (en) * | 2014-08-20 | 2015-04-15 | 医療法人 駿東育愛会 望星第一クリニック | Subcutaneous diagnostic apparatus and blood pressure measurement method |
| WO2016035041A1 (en) | 2014-09-04 | 2016-03-10 | Universidade De Coimbra | Apparatus and method for non-invasive pressure measurement of a fluid confined in a vessel with elastic or rigid walls fitted with an elastic window |
| US11259715B2 (en) | 2014-09-08 | 2022-03-01 | Zoll Medical Israel Ltd. | Monitoring and diagnostics systems and methods |
| WO2016115175A1 (en) | 2015-01-12 | 2016-07-21 | KYMA Medical Technologies, Inc. | Systems, apparatuses and methods for radio frequency-based attachment sensing |
| US10973584B2 (en) | 2015-01-19 | 2021-04-13 | Bard Access Systems, Inc. | Device and method for vascular access |
| WO2016210325A1 (en) | 2015-06-26 | 2016-12-29 | C.R. Bard, Inc. | Connector interface for ecg-based catheter positioning system |
| US11000207B2 (en) | 2016-01-29 | 2021-05-11 | C. R. Bard, Inc. | Multiple coil system for tracking a medical device |
| EP3524164A1 (en) | 2016-08-03 | 2019-08-14 | PI-Harvest Holding AG | A system, method and software for non-invasive measurement of intravascular, in particular intracardiac blood pressure |
| US11717255B2 (en) | 2016-08-05 | 2023-08-08 | Cimon Medical As | Ultrasound blood-flow monitoring |
| US11020002B2 (en) | 2017-08-10 | 2021-06-01 | Zoll Medical Israel Ltd. | Systems, devices and methods for physiological monitoring of patients |
| KR20200097801A (en) * | 2017-12-22 | 2020-08-19 | 센시프리 리미티드 | Continuous blood pressure measurement |
| EP3749207B1 (en) * | 2018-02-07 | 2023-07-12 | Cimon Medical AS | Ultrasound blood-flow monitoring |
| JP2021522966A (en) * | 2018-05-03 | 2021-09-02 | モノヴォ リミテッド ライアビリティ カンパニー | Devices and methods for deriving respiratory rates from multiple biometric sources |
| US10992079B2 (en) | 2018-10-16 | 2021-04-27 | Bard Access Systems, Inc. | Safety-equipped connection systems and methods thereof for establishing electrical connections |
| EP3671649A1 (en) * | 2018-12-19 | 2020-06-24 | Siemens Healthcare GmbH | Method and computer system for generating a combined tissue-vessel representation |
| CN109602401B (en) * | 2019-01-28 | 2021-08-27 | 徐州市心血管病研究所 | Microvascular hemodynamic parameter analyzer and analysis method |
| WO2022155015A1 (en) * | 2021-01-16 | 2022-07-21 | Jeffrey Loh | Non-invasive non-compressive blood pressure monitoring device |
Citations (104)
| Publication number | Priority date | Publication date | Assignee | Title |
|---|---|---|---|---|
| US3527197A (en) | 1966-04-19 | 1970-09-08 | Southwest Res Inst | Indirect blood pressure measurement |
| US3601120A (en) | 1969-04-14 | 1971-08-24 | Hoffmann La Roche | Ultrasonic doppler body surface movement detector |
| US3617993A (en) | 1969-09-10 | 1971-11-02 | Hoffmann La Roche | Cw doppler transceiver system |
| US3663932A (en) | 1970-07-15 | 1972-05-16 | Hoffmann La Roche | Reconstruction of reflecting surface velocity and displacement from doppler signals |
| US3791378A (en) | 1971-04-01 | 1974-02-12 | Hoffmann La Roche | Blood pressure monitor with rate sensing artifact rejection processing circuitry |
| US3885551A (en) | 1971-04-01 | 1975-05-27 | Hoffmann La Roche | Artifact rejection for blood pressure monitoring |
| US4109647A (en) | 1977-03-16 | 1978-08-29 | The United States Of America As Represented By The Secretary Of The Department Of Health, Education And Welfare | Method of and apparatus for measurement of blood flow using coherent light |
| US4127114A (en) | 1976-08-30 | 1978-11-28 | Carba S.A. | Apparatus for the automatic measurement of the arterial pressure of a patient |
| US4154231A (en) | 1977-11-23 | 1979-05-15 | Russell Robert B | System for non-invasive cardiac diagnosis |
| US4239047A (en) | 1978-05-22 | 1980-12-16 | William L. Griggs, III | Method and apparatus for aurally determining presence or absence of pathological stenosis |
| US4249540A (en) | 1978-04-24 | 1981-02-10 | President Of Hokkaido University | Optical somato-measuring apparatus |
| US4269193A (en) * | 1977-11-04 | 1981-05-26 | Sri International | Noninvasive blood pressure monitoring transducer |
| US4318413A (en) * | 1978-10-20 | 1982-03-09 | Tokyo Shibaura Denki Kabushiki Kaisha | Ultrasonic diagnostic apparatus |
| US4349034A (en) | 1978-04-10 | 1982-09-14 | Johnson & Johnson | Automatic mean blood pressure reading device |
| WO1984000290A1 (en) | 1982-07-19 | 1984-02-02 | Bomed Medical Mfg | Non-invasive real time blood pressure measurement system |
| US4476875A (en) | 1978-10-31 | 1984-10-16 | Nilsson Gert E | Method and apparatus for measuring flow motions in a fluid |
| US4566462A (en) | 1983-11-21 | 1986-01-28 | School Of Medicine Texas Tech. Univ. Health Servcs. Ctr. | Venous pressure measuring method and apparatus |
| US4584880A (en) * | 1984-06-04 | 1986-04-29 | Dymax Corporation | Tissue signature tracking tranceiver |
| US4590948A (en) | 1984-01-20 | 1986-05-27 | Perimed Kb | Method and apparatus for measuring the blood flow in the superficial blood vessels of tissue |
| US4596254A (en) | 1984-12-18 | 1986-06-24 | Tsi Research Associates Limited Partnership | Laser Doppler flow monitor |
| US4630612A (en) * | 1983-05-25 | 1986-12-23 | Aloka Co., Ltd. | Ultrasonic diagnostic apparatus |
| US4651747A (en) | 1984-06-20 | 1987-03-24 | Baxter Travenol Laboratories, Inc. | Waveform information obtaining techniques associated with an individual's blood pressure |
| US4660564A (en) | 1984-04-02 | 1987-04-28 | Teltec Electronic Equipment Ab | Apparatus for measuring pulsetile part-structures within a living body |
| US4719923A (en) | 1985-05-06 | 1988-01-19 | American Telephone And Telegraph Company, At&T Bell Laboratories | Non-invasive blood flow measurements utilizing autoregressive analysis with averaged reflection coefficients |
| US4721113A (en) * | 1985-09-20 | 1988-01-26 | Temple University Of The Commonwealth System Of Higher Education | Method of predicting the occurrence of deep vein thrombosis by non-invasive measurement of vessel diameter |
| US4733668A (en) * | 1979-09-04 | 1988-03-29 | North American Philips Corporation | Method and apparatus for compensation during ultrasound examination |
| US4754761A (en) | 1985-07-05 | 1988-07-05 | Critikon, Inc. | Automated mean arterial blood pressure monitor with data enhancement |
| US4771792A (en) | 1985-02-19 | 1988-09-20 | Seale Joseph B | Non-invasive determination of mechanical characteristics in the body |
| EP0299827A1 (en) | 1987-07-03 | 1989-01-18 | Gérard Boutin | Device for measuring the blood pressure in a superficial artery |
| US4802488A (en) * | 1986-11-06 | 1989-02-07 | Sri International | Blood pressure monitoring method and apparatus |
| US4867170A (en) | 1987-07-03 | 1989-09-19 | Kabuskiki Kaisha Hi Bridge | Measuring apparatus for blood pressure |
| US4869261A (en) | 1987-03-27 | 1989-09-26 | University J.E. Purkyne V Brne | Automatic noninvasive blood pressure monitor |
| EP0342249A1 (en) | 1988-05-14 | 1989-11-23 | Hewlett-Packard GmbH | Blood pressure monitor |
| US4901733A (en) | 1988-02-23 | 1990-02-20 | Colin Electronics Co., Ltd. | Pulse wave detecting apparatus |
| US4924871A (en) | 1988-02-26 | 1990-05-15 | Colin Electronics Co., Ltd. | Motion artifact detection for continuous blood pressure monitor transducer |
| US4960128A (en) | 1988-11-14 | 1990-10-02 | Paramed Technology Incorporated | Method and apparatus for continuously and non-invasively measuring the blood pressure of a patient |
| US5030956A (en) | 1989-04-25 | 1991-07-09 | Murphy Quentin M | Radar tomography |
| US5065765A (en) * | 1989-06-23 | 1991-11-19 | Colin Electronics Co., Ltd. | Compensation for tonometer sensor crosstalk and element spacing |
| US5072733A (en) | 1990-03-14 | 1991-12-17 | Avner Spector | Shock wave lithotripter and method for using the same |
| US5094244A (en) | 1989-08-25 | 1992-03-10 | Health Monitors, Inc. | Apparatus and process for determining systolic blood pressure, diastolic blood pressure, mean arterial blood pressure, pulse rate, pulse wave shape, respiratory pattern, and respiratory rate |
| WO1992007508A1 (en) | 1990-10-31 | 1992-05-14 | Medwave, Inc. | Noninvasive, non-occlusive blood pressure method and apparatus |
| US5119822A (en) | 1988-10-19 | 1992-06-09 | Colin Electronics Co., Ltd. | Pulse wave detecting apparatus |
| US5158091A (en) | 1990-11-30 | 1992-10-27 | Ivac Corporation | Tonometry system for determining blood pressure |
| US5163438A (en) | 1988-11-14 | 1992-11-17 | Paramed Technology Incorporated | Method and apparatus for continuously and noninvasively measuring the blood pressure of a patient |
| US5170796A (en) | 1990-03-01 | 1992-12-15 | Colin Electronics Co., Ltd. | Pulse wave detecting apparatus |
| US5238000A (en) | 1990-09-10 | 1993-08-24 | Colin Electronics Co., Ltd. | Pulse wave detecting apparatus |
| US5240007A (en) | 1991-05-14 | 1993-08-31 | Ivac Corporation | Apparatus and method for moving a tissue stress sensor for applanating an artery |
| US5261412A (en) | 1992-11-20 | 1993-11-16 | Ivac Corporation | Method of continuously monitoring blood pressure |
| DE4218319A1 (en) | 1992-06-03 | 1993-12-09 | Siemens Ag | Time and frequency distribution signal analysis arrangement - contains convolution device fed via mixers converting frequency range |
| US5273046A (en) | 1992-04-15 | 1993-12-28 | Ivac Corporation | Method of determining optimum artery applanation |
| US5280787A (en) * | 1990-01-25 | 1994-01-25 | Commonwealth Scientific And Industrial Research Organisation | Ultrasonic method and apparaus for determination of vessel location and size |
| US5289823A (en) * | 1992-05-12 | 1994-03-01 | Colin Electronics Co., Ltd. | Non-invasive aortic blood flow sensor and method for non-invasively measuring aortic blood flow |
| EP0603666A2 (en) | 1992-12-11 | 1994-06-29 | Siemens Medical Systems, Inc. | Pressure data acquisition device for a patient monitoring system |
| US5327893A (en) | 1992-10-19 | 1994-07-12 | Rensselaer Polytechnic Institute | Detection of cholesterol deposits in arteries |
| US5363849A (en) * | 1994-01-26 | 1994-11-15 | Cardiovascular Imaging Systems, Inc. | Enhancing intravascular ultrasonic blood vessel image |
| US5368039A (en) | 1993-07-26 | 1994-11-29 | Moses; John A. | Method and apparatus for determining blood pressure |
| WO1995000074A1 (en) | 1993-06-23 | 1995-01-05 | Akinyemi Samuel Nathaniel Olal | Blood pressure measuring apparatus |
| US5409010A (en) | 1992-05-19 | 1995-04-25 | Board Of Regents Of The University Of Washington | Vector doppler medical devices for blood velocity studies |
| US5439001A (en) | 1993-11-17 | 1995-08-08 | Ivac Corporation | Flexible diaphragm tonometer |
| US5450852A (en) | 1993-11-09 | 1995-09-19 | Medwave, Inc. | Continuous non-invasive blood pressure monitoring system |
| US5467771A (en) | 1993-10-26 | 1995-11-21 | Colin Corporation | Pulse wave sensor |
| US5479928A (en) | 1992-09-21 | 1996-01-02 | Institut National De La Sante Et De La Recherche Medicale | Ultrasonic method and apparatus for flow measurement |
| US5494043A (en) | 1993-05-04 | 1996-02-27 | Vital Insite, Inc. | Arterial sensor |
| US5495852A (en) | 1995-01-27 | 1996-03-05 | Boston Heart Foundation | Method and apparatus for estimating diameter of an artery using B-mode ultrasonic images |
| US5551434A (en) | 1994-06-22 | 1996-09-03 | Kabushiki Kaisha Toshiba | Ultrasonic imaging diagnosis apparatus |
| US5590649A (en) | 1994-04-15 | 1997-01-07 | Vital Insite, Inc. | Apparatus and method for measuring an induced perturbation to determine blood pressure |
| US5617867A (en) | 1994-11-23 | 1997-04-08 | Ivac Medical Systems, Inc. | Tonometer mounting device |
| US5634467A (en) | 1993-11-08 | 1997-06-03 | Robin Medical Technologies | Method and apparatus for assessing cardiovascular performance |
| US5640964A (en) | 1995-02-16 | 1997-06-24 | Medwave, Inc. | Wrist mounted blood pressure sensor |
| US5642733A (en) | 1996-04-08 | 1997-07-01 | Medwave, Inc. | Blood pressure sensor locator |
| US5669388A (en) * | 1995-09-06 | 1997-09-23 | Echocath, Inc. | Apparatus and method for automatic placement of transducer |
| US5701898A (en) * | 1994-09-02 | 1997-12-30 | The United States Of America As Represented By The Department Of Health And Human Services | Method and system for Doppler ultrasound measurement of blood flow |
| EP0818176A1 (en) | 1996-07-03 | 1998-01-14 | Colin Corporation | Pressure pulse wave detecting apparatus |
| US5718229A (en) * | 1996-05-30 | 1998-02-17 | Advanced Technology Laboratories, Inc. | Medical ultrasonic power motion imaging |
| US5720292A (en) | 1996-07-31 | 1998-02-24 | Medwave, Inc. | Beat onset detector |
| US5738103A (en) | 1996-07-31 | 1998-04-14 | Medwave, Inc. | Segmented estimation method |
| US5749364A (en) | 1996-06-21 | 1998-05-12 | Acuson Corporation | Method and apparatus for mapping pressure and tissue properties |
| US5785654A (en) | 1995-11-21 | 1998-07-28 | Kabushiki Kaisha Toshiba | Ultrasound diagnostic apparatus |
| US5797850A (en) | 1993-11-09 | 1998-08-25 | Medwave, Inc. | Method and apparatus for calculating blood pressure of an artery |
| US5832924A (en) | 1995-02-16 | 1998-11-10 | Medwave, Inc. | Method of positioning a sensor for determining blood pressure of an artery |
| US5848970A (en) | 1996-12-13 | 1998-12-15 | Vitalwave Corp. | Apparatus and method for non-invasively monitoring a subject's arterial blood pressure |
| US5855557A (en) | 1996-12-30 | 1999-01-05 | Siemens Medical Systems, Inc. | Ultrasonic imaging system and method for generating and displaying velocity field information |
| US5876346A (en) | 1996-10-07 | 1999-03-02 | Corso; Albert Mario | Artery locating device |
| US5895359A (en) | 1997-06-06 | 1999-04-20 | Southwest Research Institute | System and method for correcting a living subject's measured blood pressure |
| US5904654A (en) | 1995-10-20 | 1999-05-18 | Vital Insite, Inc. | Exciter-detector unit for measuring physiological parameters |
| US5908027A (en) | 1994-08-22 | 1999-06-01 | Alaris Medical Systems, Inc. | Tonometry system for monitoring blood pressure |
| US5916180A (en) | 1997-10-03 | 1999-06-29 | Uromed Corporation | Calibrating pressure sensors |
| US5941828A (en) | 1993-11-09 | 1999-08-24 | Medwave, Inc. | Hand-held non-invasive blood pressure measurement device |
| US6027452A (en) | 1996-06-26 | 2000-02-22 | Vital Insite, Inc. | Rapid non-invasive blood pressure measuring device |
| US6132382A (en) | 1998-10-16 | 2000-10-17 | Medwave, Inc. | Non-invasive blood pressure sensor with motion artifact reduction |
| US6159157A (en) | 1999-04-23 | 2000-12-12 | Medwave, Inc. | Blood pressure measurement device with a sensor locator |
| US6176831B1 (en) * | 1998-07-20 | 2001-01-23 | Tensys Medical, Inc. | Apparatus and method for non-invasively monitoring a subject's arterial blood pressure |
| US6228034B1 (en) * | 1998-07-20 | 2001-05-08 | Tensys Medical, Inc. | Apparatus and method for non-invasively monitoring a subjects arterial blood pressure |
| US6241679B1 (en) | 1999-05-24 | 2001-06-05 | Medwave, Inc. | Non-invasive blood pressure sensing device and method using transducer with associate memory |
| US6258031B1 (en) | 1999-08-24 | 2001-07-10 | Matsushita Electric Industrial Co., Ltd. | Ultrasound diagnostic apparatus |
| US6267728B1 (en) | 1999-06-23 | 2001-07-31 | Steven Mark Hayden | Method for evaluating atherosclerosis and its affect on the elasticity of arterial walls |
| USD458375S1 (en) | 2000-12-19 | 2002-06-04 | Medwave, Inc. | Blood pressure sensor |
| US6443905B1 (en) * | 1997-09-12 | 2002-09-03 | Polar Electro Oy | Method and arrangement for blood pressure measurement |
| US6447456B1 (en) * | 1999-12-16 | 2002-09-10 | Seiko Instruments Inc. | Device for detecting pulse waves |
| US6471646B1 (en) | 2001-07-19 | 2002-10-29 | Medwave, Inc. | Arterial line emulator |
| US6471655B1 (en) | 1999-06-29 | 2002-10-29 | Vitalwave Corporation | Method and apparatus for the noninvasive determination of arterial blood pressure |
| US6554774B1 (en) * | 2000-03-23 | 2003-04-29 | Tensys Medical, Inc. | Method and apparatus for assessing hemodynamic properties within the circulatory system of a living subject |
| US6558335B1 (en) | 2000-11-22 | 2003-05-06 | Medwave, Inc | Wrist-mounted blood pressure measurement device |
| US6676600B1 (en) * | 1999-09-03 | 2004-01-13 | Tensys Medical, Inc. | Smart physiologic parameter sensor and method |
Family Cites Families (7)
| Publication number | Priority date | Publication date | Assignee | Title |
|---|---|---|---|---|
| US4880013A (en) * | 1988-03-24 | 1989-11-14 | Chio Shiu Shin | Method and apparatus for determining blood pressure and cardiovascular condition |
| US5406952A (en) * | 1993-02-11 | 1995-04-18 | Biosyss Corporation | Blood pressure monitoring system |
| US5836884A (en) * | 1993-12-17 | 1998-11-17 | Pulse Metric, Inc. | Method for diagnosing, monitoring and treating hypertension and other cardiac problems |
| US5533511A (en) * | 1994-01-05 | 1996-07-09 | Vital Insite, Incorporated | Apparatus and method for noninvasive blood pressure measurement |
| AUPN338395A0 (en) * | 1995-06-05 | 1995-06-29 | Pwv Medical Pty Ltd | Improved calibration for blood pressure pulses |
| US6010457A (en) * | 1996-03-15 | 2000-01-04 | Pmv Medical Pty Ltd | Non-invasive determination of aortic flow velocity waveforms |
| EP1096877B1 (en) | 1998-07-20 | 2005-06-08 | Tensys Medical, Inc. | Apparatus for non-invasively monitoring a subject's arterial blood pressure |
-
1999
- 1999-06-29 US US09/342,549 patent/US6471655B1/en not_active Expired - Lifetime
-
2000
- 2000-01-21 US US09/489,160 patent/US6514211B1/en not_active Expired - Fee Related
- 2000-06-27 EP EP00943243A patent/EP1196084A1/en not_active Withdrawn
- 2000-06-27 WO PCT/US2000/017758 patent/WO2001000087A1/en not_active Application Discontinuation
- 2000-06-27 JP JP2001505807A patent/JP2003503094A/en active Pending
- 2000-06-27 AU AU57741/00A patent/AU5774100A/en not_active Abandoned
-
2001
- 2001-03-22 US US09/815,982 patent/US7503896B2/en not_active Expired - Fee Related
Patent Citations (119)
| Publication number | Priority date | Publication date | Assignee | Title |
|---|---|---|---|---|
| US3527197A (en) | 1966-04-19 | 1970-09-08 | Southwest Res Inst | Indirect blood pressure measurement |
| US3601120A (en) | 1969-04-14 | 1971-08-24 | Hoffmann La Roche | Ultrasonic doppler body surface movement detector |
| US3617993A (en) | 1969-09-10 | 1971-11-02 | Hoffmann La Roche | Cw doppler transceiver system |
| US3663932A (en) | 1970-07-15 | 1972-05-16 | Hoffmann La Roche | Reconstruction of reflecting surface velocity and displacement from doppler signals |
| US3791378A (en) | 1971-04-01 | 1974-02-12 | Hoffmann La Roche | Blood pressure monitor with rate sensing artifact rejection processing circuitry |
| US3885551A (en) | 1971-04-01 | 1975-05-27 | Hoffmann La Roche | Artifact rejection for blood pressure monitoring |
| US4127114A (en) | 1976-08-30 | 1978-11-28 | Carba S.A. | Apparatus for the automatic measurement of the arterial pressure of a patient |
| US4109647A (en) | 1977-03-16 | 1978-08-29 | The United States Of America As Represented By The Secretary Of The Department Of Health, Education And Welfare | Method of and apparatus for measurement of blood flow using coherent light |
| US4269193A (en) * | 1977-11-04 | 1981-05-26 | Sri International | Noninvasive blood pressure monitoring transducer |
| US4154231A (en) | 1977-11-23 | 1979-05-15 | Russell Robert B | System for non-invasive cardiac diagnosis |
| US4349034A (en) | 1978-04-10 | 1982-09-14 | Johnson & Johnson | Automatic mean blood pressure reading device |
| US4249540A (en) | 1978-04-24 | 1981-02-10 | President Of Hokkaido University | Optical somato-measuring apparatus |
| US4239047A (en) | 1978-05-22 | 1980-12-16 | William L. Griggs, III | Method and apparatus for aurally determining presence or absence of pathological stenosis |
| US4318413A (en) * | 1978-10-20 | 1982-03-09 | Tokyo Shibaura Denki Kabushiki Kaisha | Ultrasonic diagnostic apparatus |
| US4476875A (en) | 1978-10-31 | 1984-10-16 | Nilsson Gert E | Method and apparatus for measuring flow motions in a fluid |
| US4733668A (en) * | 1979-09-04 | 1988-03-29 | North American Philips Corporation | Method and apparatus for compensation during ultrasound examination |
| WO1984000290A1 (en) | 1982-07-19 | 1984-02-02 | Bomed Medical Mfg | Non-invasive real time blood pressure measurement system |
| US4630612A (en) * | 1983-05-25 | 1986-12-23 | Aloka Co., Ltd. | Ultrasonic diagnostic apparatus |
| US4566462A (en) | 1983-11-21 | 1986-01-28 | School Of Medicine Texas Tech. Univ. Health Servcs. Ctr. | Venous pressure measuring method and apparatus |
| US4590948A (en) | 1984-01-20 | 1986-05-27 | Perimed Kb | Method and apparatus for measuring the blood flow in the superficial blood vessels of tissue |
| US4660564A (en) | 1984-04-02 | 1987-04-28 | Teltec Electronic Equipment Ab | Apparatus for measuring pulsetile part-structures within a living body |
| US4584880A (en) * | 1984-06-04 | 1986-04-29 | Dymax Corporation | Tissue signature tracking tranceiver |
| US4651747A (en) | 1984-06-20 | 1987-03-24 | Baxter Travenol Laboratories, Inc. | Waveform information obtaining techniques associated with an individual's blood pressure |
| US4596254A (en) | 1984-12-18 | 1986-06-24 | Tsi Research Associates Limited Partnership | Laser Doppler flow monitor |
| US4771792A (en) | 1985-02-19 | 1988-09-20 | Seale Joseph B | Non-invasive determination of mechanical characteristics in the body |
| US4719923A (en) | 1985-05-06 | 1988-01-19 | American Telephone And Telegraph Company, At&T Bell Laboratories | Non-invasive blood flow measurements utilizing autoregressive analysis with averaged reflection coefficients |
| US4754761A (en) | 1985-07-05 | 1988-07-05 | Critikon, Inc. | Automated mean arterial blood pressure monitor with data enhancement |
| US4721113A (en) * | 1985-09-20 | 1988-01-26 | Temple University Of The Commonwealth System Of Higher Education | Method of predicting the occurrence of deep vein thrombosis by non-invasive measurement of vessel diameter |
| US4802488A (en) * | 1986-11-06 | 1989-02-07 | Sri International | Blood pressure monitoring method and apparatus |
| US4869261A (en) | 1987-03-27 | 1989-09-26 | University J.E. Purkyne V Brne | Automatic noninvasive blood pressure monitor |
| EP0284095B1 (en) | 1987-03-27 | 1993-07-07 | Tno Biomedical Instrumentation | Method and apparatus for automatic non-invasive blood pressure measurement |
| EP0299827A1 (en) | 1987-07-03 | 1989-01-18 | Gérard Boutin | Device for measuring the blood pressure in a superficial artery |
| US4867170A (en) | 1987-07-03 | 1989-09-19 | Kabuskiki Kaisha Hi Bridge | Measuring apparatus for blood pressure |
| US4901733A (en) | 1988-02-23 | 1990-02-20 | Colin Electronics Co., Ltd. | Pulse wave detecting apparatus |
| US4924871A (en) | 1988-02-26 | 1990-05-15 | Colin Electronics Co., Ltd. | Motion artifact detection for continuous blood pressure monitor transducer |
| EP0342249A1 (en) | 1988-05-14 | 1989-11-23 | Hewlett-Packard GmbH | Blood pressure monitor |
| US5119822A (en) | 1988-10-19 | 1992-06-09 | Colin Electronics Co., Ltd. | Pulse wave detecting apparatus |
| US4960128A (en) | 1988-11-14 | 1990-10-02 | Paramed Technology Incorporated | Method and apparatus for continuously and non-invasively measuring the blood pressure of a patient |
| US5163438A (en) | 1988-11-14 | 1992-11-17 | Paramed Technology Incorporated | Method and apparatus for continuously and noninvasively measuring the blood pressure of a patient |
| US5030956A (en) | 1989-04-25 | 1991-07-09 | Murphy Quentin M | Radar tomography |
| US5065765A (en) * | 1989-06-23 | 1991-11-19 | Colin Electronics Co., Ltd. | Compensation for tonometer sensor crosstalk and element spacing |
| US5094244A (en) | 1989-08-25 | 1992-03-10 | Health Monitors, Inc. | Apparatus and process for determining systolic blood pressure, diastolic blood pressure, mean arterial blood pressure, pulse rate, pulse wave shape, respiratory pattern, and respiratory rate |
| US5280787A (en) * | 1990-01-25 | 1994-01-25 | Commonwealth Scientific And Industrial Research Organisation | Ultrasonic method and apparaus for determination of vessel location and size |
| US5170796A (en) | 1990-03-01 | 1992-12-15 | Colin Electronics Co., Ltd. | Pulse wave detecting apparatus |
| US5072733A (en) | 1990-03-14 | 1991-12-17 | Avner Spector | Shock wave lithotripter and method for using the same |
| US5238000A (en) | 1990-09-10 | 1993-08-24 | Colin Electronics Co., Ltd. | Pulse wave detecting apparatus |
| US5241964A (en) | 1990-10-31 | 1993-09-07 | Medwave, Incorporated | Noninvasive, non-occlusive method and apparatus which provides a continuous indication of arterial pressure and a beat-by-beat characterization of the arterial system |
| WO1992007508A1 (en) | 1990-10-31 | 1992-05-14 | Medwave, Inc. | Noninvasive, non-occlusive blood pressure method and apparatus |
| US5158091A (en) | 1990-11-30 | 1992-10-27 | Ivac Corporation | Tonometry system for determining blood pressure |
| US5240007A (en) | 1991-05-14 | 1993-08-31 | Ivac Corporation | Apparatus and method for moving a tissue stress sensor for applanating an artery |
| US5273046A (en) | 1992-04-15 | 1993-12-28 | Ivac Corporation | Method of determining optimum artery applanation |
| US5289823A (en) * | 1992-05-12 | 1994-03-01 | Colin Electronics Co., Ltd. | Non-invasive aortic blood flow sensor and method for non-invasively measuring aortic blood flow |
| US5409010A (en) | 1992-05-19 | 1995-04-25 | Board Of Regents Of The University Of Washington | Vector doppler medical devices for blood velocity studies |
| DE4218319A1 (en) | 1992-06-03 | 1993-12-09 | Siemens Ag | Time and frequency distribution signal analysis arrangement - contains convolution device fed via mixers converting frequency range |
| EP0595666B1 (en) | 1992-09-21 | 1999-12-01 | Institut National De La Sante Et De La Recherche Medicale (Inserm) | Probe and procedure for a precise determination of velocity or flow of a liquid |
| US5479928A (en) | 1992-09-21 | 1996-01-02 | Institut National De La Sante Et De La Recherche Medicale | Ultrasonic method and apparatus for flow measurement |
| US5327893A (en) | 1992-10-19 | 1994-07-12 | Rensselaer Polytechnic Institute | Detection of cholesterol deposits in arteries |
| US5261412A (en) | 1992-11-20 | 1993-11-16 | Ivac Corporation | Method of continuously monitoring blood pressure |
| EP0603666A2 (en) | 1992-12-11 | 1994-06-29 | Siemens Medical Systems, Inc. | Pressure data acquisition device for a patient monitoring system |
| US5494043A (en) | 1993-05-04 | 1996-02-27 | Vital Insite, Inc. | Arterial sensor |
| WO1995000074A1 (en) | 1993-06-23 | 1995-01-05 | Akinyemi Samuel Nathaniel Olal | Blood pressure measuring apparatus |
| US5368039A (en) | 1993-07-26 | 1994-11-29 | Moses; John A. | Method and apparatus for determining blood pressure |
| US5467771A (en) | 1993-10-26 | 1995-11-21 | Colin Corporation | Pulse wave sensor |
| US5634467A (en) | 1993-11-08 | 1997-06-03 | Robin Medical Technologies | Method and apparatus for assessing cardiovascular performance |
| US5722414A (en) | 1993-11-09 | 1998-03-03 | Medwave, Inc. | Continuous non-invasive blood pressure monitoring system |
| US5941828A (en) | 1993-11-09 | 1999-08-24 | Medwave, Inc. | Hand-held non-invasive blood pressure measurement device |
| US5797850A (en) | 1993-11-09 | 1998-08-25 | Medwave, Inc. | Method and apparatus for calculating blood pressure of an artery |
| US6099477A (en) | 1993-11-09 | 2000-08-08 | Medwave, Inc. | Method and apparatus for calculating blood pressure of an artery |
| US6589185B1 (en) | 1993-11-09 | 2003-07-08 | Medwave, Inc. | Method and apparatus for calculating blood pressure of an artery |
| US6340349B1 (en) | 1993-11-09 | 2002-01-22 | Medwave, Inc. | Hand-held non-invasive blood pressure measurement device |
| US5649542A (en) | 1993-11-09 | 1997-07-22 | Medwave, Inc. | Continuous non-invasive blood pressure monitoring system |
| US5450852A (en) | 1993-11-09 | 1995-09-19 | Medwave, Inc. | Continuous non-invasive blood pressure monitoring system |
| US5439001A (en) | 1993-11-17 | 1995-08-08 | Ivac Corporation | Flexible diaphragm tonometer |
| US5363849A (en) * | 1994-01-26 | 1994-11-15 | Cardiovascular Imaging Systems, Inc. | Enhancing intravascular ultrasonic blood vessel image |
| US5590649A (en) | 1994-04-15 | 1997-01-07 | Vital Insite, Inc. | Apparatus and method for measuring an induced perturbation to determine blood pressure |
| US5833618A (en) | 1994-04-15 | 1998-11-10 | Vital Insite, Inc. | Apparatus and method for measuring an induced perturbation to determine a physiological parameter |
| US5551434A (en) | 1994-06-22 | 1996-09-03 | Kabushiki Kaisha Toshiba | Ultrasonic imaging diagnosis apparatus |
| US5908027A (en) | 1994-08-22 | 1999-06-01 | Alaris Medical Systems, Inc. | Tonometry system for monitoring blood pressure |
| US5701898A (en) * | 1994-09-02 | 1997-12-30 | The United States Of America As Represented By The Department Of Health And Human Services | Method and system for Doppler ultrasound measurement of blood flow |
| US5617867A (en) | 1994-11-23 | 1997-04-08 | Ivac Medical Systems, Inc. | Tonometer mounting device |
| US5495852A (en) | 1995-01-27 | 1996-03-05 | Boston Heart Foundation | Method and apparatus for estimating diameter of an artery using B-mode ultrasonic images |
| US5832924A (en) | 1995-02-16 | 1998-11-10 | Medwave, Inc. | Method of positioning a sensor for determining blood pressure of an artery |
| US5640964A (en) | 1995-02-16 | 1997-06-24 | Medwave, Inc. | Wrist mounted blood pressure sensor |
| US5938618A (en) | 1995-02-16 | 1999-08-17 | Medwave, Inc. | Method of positioning a sensor for determining blood pressure of an artery |
| US5669388A (en) * | 1995-09-06 | 1997-09-23 | Echocath, Inc. | Apparatus and method for automatic placement of transducer |
| US5904654A (en) | 1995-10-20 | 1999-05-18 | Vital Insite, Inc. | Exciter-detector unit for measuring physiological parameters |
| US5785654A (en) | 1995-11-21 | 1998-07-28 | Kabushiki Kaisha Toshiba | Ultrasound diagnostic apparatus |
| US5642733A (en) | 1996-04-08 | 1997-07-01 | Medwave, Inc. | Blood pressure sensor locator |
| US5718229A (en) * | 1996-05-30 | 1998-02-17 | Advanced Technology Laboratories, Inc. | Medical ultrasonic power motion imaging |
| US5749364A (en) | 1996-06-21 | 1998-05-12 | Acuson Corporation | Method and apparatus for mapping pressure and tissue properties |
| US6027452A (en) | 1996-06-26 | 2000-02-22 | Vital Insite, Inc. | Rapid non-invasive blood pressure measuring device |
| EP0818176A1 (en) | 1996-07-03 | 1998-01-14 | Colin Corporation | Pressure pulse wave detecting apparatus |
| US5720292A (en) | 1996-07-31 | 1998-02-24 | Medwave, Inc. | Beat onset detector |
| US5993394A (en) | 1996-07-31 | 1999-11-30 | Medwave, Inc. | Segmented estimation method |
| US6017314A (en) | 1996-07-31 | 2000-01-25 | Medwave, Inc. | Segmented estimation method |
| US5738103A (en) | 1996-07-31 | 1998-04-14 | Medwave, Inc. | Segmented estimation method |
| US5876346A (en) | 1996-10-07 | 1999-03-02 | Corso; Albert Mario | Artery locating device |
| US5848970A (en) | 1996-12-13 | 1998-12-15 | Vitalwave Corp. | Apparatus and method for non-invasively monitoring a subject's arterial blood pressure |
| US5964711A (en) | 1996-12-13 | 1999-10-12 | Vitalwave Corporation | Apparatus and method for non-invasively monitoring a subject's arterial blood pressure |
| US5855557A (en) | 1996-12-30 | 1999-01-05 | Siemens Medical Systems, Inc. | Ultrasonic imaging system and method for generating and displaying velocity field information |
| US5895359A (en) | 1997-06-06 | 1999-04-20 | Southwest Research Institute | System and method for correcting a living subject's measured blood pressure |
| US6443905B1 (en) * | 1997-09-12 | 2002-09-03 | Polar Electro Oy | Method and arrangement for blood pressure measurement |
| US5916180A (en) | 1997-10-03 | 1999-06-29 | Uromed Corporation | Calibrating pressure sensors |
| US6228034B1 (en) * | 1998-07-20 | 2001-05-08 | Tensys Medical, Inc. | Apparatus and method for non-invasively monitoring a subjects arterial blood pressure |
| US6176831B1 (en) * | 1998-07-20 | 2001-01-23 | Tensys Medical, Inc. | Apparatus and method for non-invasively monitoring a subject's arterial blood pressure |
| US6132382A (en) | 1998-10-16 | 2000-10-17 | Medwave, Inc. | Non-invasive blood pressure sensor with motion artifact reduction |
| US6245022B1 (en) | 1998-10-16 | 2001-06-12 | Medwave, Inc. | Non-invasive blood pressure sensor with motion artifact reduction and constant gain adjustment during pressure pulses |
| US6159157A (en) | 1999-04-23 | 2000-12-12 | Medwave, Inc. | Blood pressure measurement device with a sensor locator |
| US6241679B1 (en) | 1999-05-24 | 2001-06-05 | Medwave, Inc. | Non-invasive blood pressure sensing device and method using transducer with associate memory |
| US6267728B1 (en) | 1999-06-23 | 2001-07-31 | Steven Mark Hayden | Method for evaluating atherosclerosis and its affect on the elasticity of arterial walls |
| US6514211B1 (en) | 1999-06-29 | 2003-02-04 | Tensys Medical, Inc. | Method and apparatus for the noninvasive determination of arterial blood pressure |
| US6471655B1 (en) | 1999-06-29 | 2002-10-29 | Vitalwave Corporation | Method and apparatus for the noninvasive determination of arterial blood pressure |
| US6258031B1 (en) | 1999-08-24 | 2001-07-10 | Matsushita Electric Industrial Co., Ltd. | Ultrasound diagnostic apparatus |
| US6676600B1 (en) * | 1999-09-03 | 2004-01-13 | Tensys Medical, Inc. | Smart physiologic parameter sensor and method |
| US6447456B1 (en) * | 1999-12-16 | 2002-09-10 | Seiko Instruments Inc. | Device for detecting pulse waves |
| US6554774B1 (en) * | 2000-03-23 | 2003-04-29 | Tensys Medical, Inc. | Method and apparatus for assessing hemodynamic properties within the circulatory system of a living subject |
| US6558335B1 (en) | 2000-11-22 | 2003-05-06 | Medwave, Inc | Wrist-mounted blood pressure measurement device |
| USD458375S1 (en) | 2000-12-19 | 2002-06-04 | Medwave, Inc. | Blood pressure sensor |
| US6471646B1 (en) | 2001-07-19 | 2002-10-29 | Medwave, Inc. | Arterial line emulator |
Non-Patent Citations (10)
| Title |
|---|
| Advertisement for HemoSonic(TM) 100 by Arrow International-licensed under U.S. Patent 5,479,928 listed above. |
| Anderson, E.A., et al (1989) "Flow-Mediated and Reflex Changes in Large Peripheral Artery Tone in Humans," Circulation 79:93-100. |
| Boashash, B., et al. (1987) "An Efficient Real-Time Implementation of the Wigner-Ville Distribution," IEEE Trans ASSP 35:1611-1618. |
| Cariou, Alain, et al. (1998) "Noninvasive Cardiac Output Monitoring by Aortic Blood Flow Determination: Evaluation of the Sometec Cynemo-3000 System," Critical Care Medicine, vol. 26, No. 12, pp. 2066-2072. |
| Carson, E.R., et al. (1983) "The Mathematical Modeling of Metabolic and Endocrine Systems: Model Formulation, Identification, and Validation," John Wiley & Sons, NY, pp. 185-189. |
| Drzewiecki, G. (1995) "Noninvasive Assessment of Arterial Blood Pressure and Mechanics," The Biomedical Engineering Hanbook CRC Press, Boca Raton, FL, pp. 1196-1211. |
| Drzewiecki, G.M., et al. (1985) Generalization of the Transmural Pressure-Area Relation for the F emoral Artery, 7th Annual IEEE EMBS Conference 507. |
| Hartley, C.J., et al. (1991) "An Ultrasonic Method for Measuring Tissue Displacement: Technical Details and Validation for Measuring Myocardial Thickening," IEEE Trans Biomed, 38:735-747. |
| Hoeks, A.P.G., et al. (1985) Transcutaneous Detection of Relative Changes in Artery Diameter, Ultrasound in Med and Bio 11:51-59. |
| U.S. Appl. No. 09/815,080 entitled "Method and Apparatus For Assessing Hemodynamic Parameters within the Circulatory System of a Living Subject," filed Mar. 22, 2001. |
Cited By (29)
| Publication number | Priority date | Publication date | Assignee | Title |
|---|---|---|---|---|
| US8328727B2 (en) * | 2000-03-23 | 2012-12-11 | Tensys Medical, Inc. | Method and apparatus for assessing hemodynamic parameters within the circulatory system of a living subject |
| US20060206032A1 (en) * | 2000-03-23 | 2006-09-14 | Miele Frank R | Method and apparatus for assessing hemodynamic parameters within the circulatory system of a living subject |
| US10285598B2 (en) | 2006-05-13 | 2019-05-14 | United States Gtm Medical Devices | Continuous positioning apparatus and methods |
| US10952675B2 (en) | 2007-10-12 | 2021-03-23 | Shangyi Medical Technology (Hangzhou) Co., Ltd | Apparatus and methods for non-invasively measuring a patient's arterial blood pressure |
| US20110112402A1 (en) * | 2007-12-20 | 2011-05-12 | Gifu University | Image processing apparatus, image processing program, storage medium and ultra-sonograph |
| US8249324B2 (en) * | 2007-12-20 | 2012-08-21 | Gifu University | Image processing apparatus, image processing program, storage medium, and ultra-sonic diagnostic apparatus |
| US8187188B2 (en) * | 2007-12-20 | 2012-05-29 | Gifu University | Image processing apparatus, image processing program, storage medium and ultra-sonograph |
| US20110105901A1 (en) * | 2007-12-20 | 2011-05-05 | Gifu University | Image processing apparatus, image processing program, storage medium, and ultra-sonic diagnostic apparatus |
| US8591424B2 (en) * | 2008-11-12 | 2013-11-26 | Samsung Electronics Co., Ltd. | Pressurizing module and blood pressure measuring device including the same |
| US20100121206A1 (en) * | 2008-11-12 | 2010-05-13 | Samsung Electronics Co., Ltd. | Pressurizing module and blood pressure measuring device including the same |
| US9585638B2 (en) | 2010-03-06 | 2017-03-07 | Russell Dewey | System for classifying palpable soft tissue masses using A-mode echographs |
| US9179843B2 (en) | 2011-04-21 | 2015-11-10 | Hassan Ghaderi MOGHADDAM | Method and system for optically evaluating proximity to the inferior alveolar nerve in situ |
| US10258350B2 (en) | 2011-04-21 | 2019-04-16 | Live Vue Technologies Inc. | Method and system for optically evaluating drilling proximity to the inferior alveolar nerve in situ |
| US9655530B2 (en) | 2011-04-29 | 2017-05-23 | Tensys Medical, Inc. | Apparatus and methods for non-invasively measuring physiologic parameters of one or more subjects |
| US9320445B2 (en) | 2011-05-17 | 2016-04-26 | Siemens Medical Solutions Usa, Inc. | System for cardiac condition detection responsive to blood pressure analysis |
| US9345436B2 (en) * | 2013-03-14 | 2016-05-24 | HighDim GmbH | Apparatus and methods for computing cardiac output of a living subject |
| US9949696B2 (en) | 2013-03-14 | 2018-04-24 | Tensys Medical, Inc. | Apparatus and methods for computing cardiac output of a living subject via applanation tonometry |
| US20140276071A1 (en) * | 2013-03-14 | 2014-09-18 | HighDim GmbH | Apparatus and methods for computing cardiac output of a living subject |
| US9931076B2 (en) * | 2014-06-18 | 2018-04-03 | Hong Kong Applied Science and Technology Research Institute Company Limited | Method and device for tonometric blood pressure measurement |
| US20150366464A1 (en) * | 2014-06-18 | 2015-12-24 | Hong Kong Applied Science and Technology Research Institute Company Limited | Method and device for tonometric blood pressure measurement |
| US10772512B2 (en) | 2014-09-08 | 2020-09-15 | Apple Inc. | Blood pressure monitoring using a multi-function wrist-worn device |
| US10702171B2 (en) | 2014-09-08 | 2020-07-07 | Apple Inc. | Systems, devices, and methods for measuring blood pressure of a user |
| US10779738B2 (en) | 2014-09-08 | 2020-09-22 | Apple Inc. | Electrical coupling of pulse transit time (PTT) measurement system to heart for blood pressure measurement |
| US10517489B2 (en) | 2014-09-08 | 2019-12-31 | Apple Inc. | Wrist worn accelerometer for pulse transit time (PTT) measurements of blood pressure |
| US11918324B2 (en) | 2014-09-08 | 2024-03-05 | Apple Inc. | Electrical coupling of pulse transit time (PTT) measurement system to heart for blood pressure measurement |
| US10588577B2 (en) | 2015-01-29 | 2020-03-17 | Siemens Healthcare Gmbh | Patient signal analysis based on affine template matching |
| US10962490B2 (en) | 2015-12-28 | 2021-03-30 | University Of Washington | Methods for aligning a spectrometer |
| US10709421B2 (en) * | 2016-02-10 | 2020-07-14 | Canon Medical Systems Corporation | Ultrasound diagnostic apparatus |
| US11918795B2 (en) | 2019-05-01 | 2024-03-05 | Bard Access Systems, Inc. | Puncturing devices, puncturing systems including the puncturing devices, and methods thereof |
Also Published As
| Publication number | Publication date |
|---|---|
| US20020055680A1 (en) | 2002-05-09 |
| WO2001000087A8 (en) | 2003-10-23 |
| AU5774100A (en) | 2001-01-31 |
| US6514211B1 (en) | 2003-02-04 |
| JP2003503094A (en) | 2003-01-28 |
| WO2001000087A9 (en) | 2002-07-25 |
| WO2001000087A1 (en) | 2001-01-04 |
| US6471655B1 (en) | 2002-10-29 |
| EP1196084A1 (en) | 2002-04-17 |
Similar Documents
| Publication | Publication Date | Title |
|---|---|---|
| US7503896B2 (en) | Method and apparatus for the noninvasive assessment of hemodynamic parameters including blood vessel location | |
| US7048691B2 (en) | Method and apparatus for assessing hemodynamic parameters within the circulatory system of a living subject | |
| Wright et al. | Aortic compliance measured by non-invasive Doppler ultrasound: description of a method and its reproducibility | |
| Lewis et al. | Measurement of volume flow in the human common femoral artery using a duplex ultrasound system | |
| US9204857B2 (en) | System and method for monitoring hemodynamic state | |
| Seo et al. | Noninvasive arterial blood pressure waveform monitoring using two-element ultrasound system | |
| US6261233B1 (en) | Method and device for a blood velocity determination | |
| Benetos et al. | Arterial alterations with aging and high blood pressure. A noninvasive study of carotid and femoral arteries. | |
| US6599251B2 (en) | Continuous non-invasive blood pressure monitoring method and apparatus | |
| JP3652791B2 (en) | Ultrasonic diagnostic equipment | |
| US8308644B2 (en) | Instantaneous ultrasonic measurement of bladder volume | |
| US6893401B2 (en) | Continuous non-invasive blood pressure monitoring method and apparatus | |
| Kazamias et al. | Blood pressure measurement with Doppler ultrasonic flowmeter. | |
| US20090030324A1 (en) | Ultrasonic diagnostic apparatus and method for controlling the same | |
| Vappou et al. | Non-invasive measurement of local pulse pressure by pulse wave-based ultrasound manometry (PWUM) | |
| JP2006524546A (en) | Apparatus and method for non-invasive diagnosis of coronary artery disease | |
| WO2005112774A1 (en) | Ultrasonic diagnostic apparatus and method for controlling ultrasonic diagnostic apparatus | |
| JP2020512918A (en) | Device and method for non-invasive measurement of intracranial pressure | |
| Uemura et al. | A novel minimally occlusive cuff method utilizing ultrasound vascular imaging for stress-free blood pressure measurement: A-proof-of-concept study | |
| Seo et al. | Non-Invasive evaluation of a carotid arterial pressure waveform using motion-tolerant ultrasound measurements during the valsalva maneuver | |
| US7946987B2 (en) | Ultrasonic diagnostic apparatus | |
| Greenwald et al. | Noninvasive measurement of vascular compliance by a photoplesythmographic technique | |
| AU2006200992B2 (en) | Method and apparatus for assessing hemodynamic parameters and blood vessel location within the circulatory system of a living subject | |
| Stergiopoulos et al. | NonInvasive Monitoring of Vital Signs and Traumatic Brain Injuries | |
| Patil et al. | A method for localized computation of Pulse Wave Velocity in carotid structure |
Legal Events
| Date | Code | Title | Description |
|---|---|---|---|
| AS | Assignment |
Owner name: TENSYS MEDICAL, INC., CALIFORNIA Free format text: ASSIGNMENT OF ASSIGNORS INTEREST;ASSIGNORS:MIELE, FRANK R.;MUCCI, RONALD;BAURA, GAIL D.;REEL/FRAME:012150/0210;SIGNING DATES FROM 20010702 TO 20010816 |
|
| AS | Assignment |
Owner name: MALLINCKRODT INC., MASSACHUSETTS Free format text: SECURITY AGREEMENT;ASSIGNOR:TENSYS MEDICAL, INC.;REEL/FRAME:018026/0938 Effective date: 20060801 |
|
| AS | Assignment |
Owner name: MALLINCKRODT INC., MASSACHUSETTS Free format text: AMENDED AND RESTATED PATENT SECURITY AGREEMENT;ASSIGNOR:TENSYS MEDICAL, INC.;REEL/FRAME:018505/0618 Effective date: 20061110 |
|
| STCF | Information on status: patent grant |
Free format text: PATENTED CASE |
|
| AS | Assignment |
Owner name: MALLINCKRODT INC., MASSACHUSETTS Free format text: AMENDMENT NO. 1 TO AMENDED AND RESTATED SECURITY AGREEMENT;ASSIGNOR:TENSYS MEDICAL, INC.;REEL/FRAME:027136/0734 Effective date: 20070618 |
|
| AS | Assignment |
Owner name: MALLINCKRODT INC., MASSACHUSETTS Free format text: AMENDMENT NO. 2 TO AMENDED AND RESTATED SECURITY AGREEMENT;ASSIGNOR:TENSYS MEDICAL, INC.;REEL/FRAME:027196/0414 Effective date: 20110502 |
|
| REMI | Maintenance fee reminder mailed | ||
| FPAY | Fee payment |
Year of fee payment: 4 |
|
| SULP | Surcharge for late payment | ||
| REMI | Maintenance fee reminder mailed | ||
| AS | Assignment |
Owner name: GAZDZINSKI, ROBERT F., CALIFORNIA Free format text: SECURITY INTEREST;ASSIGNOR:TENSYS MEDICAL, INC.;REEL/FRAME:040941/0936 Effective date: 20000309 |
|
| AS | Assignment |
Owner name: TENSYS MEDICAL, INC., CALIFORNIA Free format text: RELEASE BY SECURED PARTY;ASSIGNOR:GAZDZINSKI & ASSOCIATES, PC;REEL/FRAME:041453/0361 Effective date: 20170120 |
|
| FPAY | Fee payment |
Year of fee payment: 8 |
|
| SULP | Surcharge for late payment |
Year of fee payment: 7 |
|
| AS | Assignment |
Owner name: TENSYS MEDICAL, INC., CALIFORNIA Free format text: RELEASE BY SECURED PARTY;ASSIGNOR:UNITED STATES SURGICAL CORPORATION (AS SUCCESSOR-IN-INTEREST TO MALLINCKRODT INC.);REEL/FRAME:044421/0823 Effective date: 20171215 |
|
| FEPP | Fee payment procedure |
Free format text: MAINTENANCE FEE REMINDER MAILED (ORIGINAL EVENT CODE: REM.); ENTITY STATUS OF PATENT OWNER: SMALL ENTITY |
|
| LAPS | Lapse for failure to pay maintenance fees |
Free format text: PATENT EXPIRED FOR FAILURE TO PAY MAINTENANCE FEES (ORIGINAL EVENT CODE: EXP.); ENTITY STATUS OF PATENT OWNER: SMALL ENTITY |
|
| STCH | Information on status: patent discontinuation |
Free format text: PATENT EXPIRED DUE TO NONPAYMENT OF MAINTENANCE FEES UNDER 37 CFR 1.362 |
|
| FP | Lapsed due to failure to pay maintenance fee |
Effective date: 20210317 |