US6418387B1 - Method of and system for generating a binary shmoo plot in N-dimensional space - Google Patents
Method of and system for generating a binary shmoo plot in N-dimensional space Download PDFInfo
- Publication number
- US6418387B1 US6418387B1 US09/344,861 US34486199A US6418387B1 US 6418387 B1 US6418387 B1 US 6418387B1 US 34486199 A US34486199 A US 34486199A US 6418387 B1 US6418387 B1 US 6418387B1
- Authority
- US
- United States
- Prior art keywords
- test
- sub
- status
- regions
- region
- Prior art date
- Legal status (The legal status is an assumption and is not a legal conclusion. Google has not performed a legal analysis and makes no representation as to the accuracy of the status listed.)
- Expired - Lifetime
Links
- 238000000034 method Methods 0.000 title claims abstract description 60
- 238000012360 testing method Methods 0.000 claims abstract description 270
- 238000011056 performance test Methods 0.000 claims description 50
- 230000006870 function Effects 0.000 description 12
- 230000007704 transition Effects 0.000 description 4
- 238000010586 diagram Methods 0.000 description 3
- 238000011156 evaluation Methods 0.000 description 3
- 238000012545 processing Methods 0.000 description 3
- 238000003491 array Methods 0.000 description 1
- 238000012512 characterization method Methods 0.000 description 1
- 230000001788 irregular Effects 0.000 description 1
- 238000011160 research Methods 0.000 description 1
Images


Classifications
-
- G—PHYSICS
- G01—MEASURING; TESTING
- G01R—MEASURING ELECTRIC VARIABLES; MEASURING MAGNETIC VARIABLES
- G01R31/00—Arrangements for testing electric properties; Arrangements for locating electric faults; Arrangements for electrical testing characterised by what is being tested not provided for elsewhere
- G01R31/28—Testing of electronic circuits, e.g. by signal tracer
- G01R31/317—Testing of digital circuits
- G01R31/31708—Analysis of signal quality
- G01R31/31711—Evaluation methods, e.g. shmoo plots
-
- G—PHYSICS
- G01—MEASURING; TESTING
- G01R—MEASURING ELECTRIC VARIABLES; MEASURING MAGNETIC VARIABLES
- G01R31/00—Arrangements for testing electric properties; Arrangements for locating electric faults; Arrangements for electrical testing characterised by what is being tested not provided for elsewhere
- G01R31/28—Testing of electronic circuits, e.g. by signal tracer
- G01R31/317—Testing of digital circuits
- G01R31/3181—Functional testing
- G01R31/319—Tester hardware, i.e. output processing circuits
- G01R31/31901—Analysis of tester Performance; Tester characterization
-
- G—PHYSICS
- G01—MEASURING; TESTING
- G01R—MEASURING ELECTRIC VARIABLES; MEASURING MAGNETIC VARIABLES
- G01R31/00—Arrangements for testing electric properties; Arrangements for locating electric faults; Arrangements for electrical testing characterised by what is being tested not provided for elsewhere
- G01R31/28—Testing of electronic circuits, e.g. by signal tracer
- G01R31/317—Testing of digital circuits
- G01R31/3181—Functional testing
- G01R31/319—Tester hardware, i.e. output processing circuits
- G01R31/31903—Tester hardware, i.e. output processing circuits tester configuration
- G01R31/31908—Tester set-up, e.g. configuring the tester to the device under test [DUT], down loading test patterns
- G01R31/3191—Calibration
-
- G—PHYSICS
- G01—MEASURING; TESTING
- G01R—MEASURING ELECTRIC VARIABLES; MEASURING MAGNETIC VARIABLES
- G01R31/00—Arrangements for testing electric properties; Arrangements for locating electric faults; Arrangements for electrical testing characterised by what is being tested not provided for elsewhere
- G01R31/28—Testing of electronic circuits, e.g. by signal tracer
- G01R31/317—Testing of digital circuits
- G01R31/3181—Functional testing
- G01R31/319—Tester hardware, i.e. output processing circuits
- G01R31/3193—Tester hardware, i.e. output processing circuits with comparison between actual response and known fault free response
- G01R31/31935—Storing data, e.g. failure memory
-
- G—PHYSICS
- G01—MEASURING; TESTING
- G01R—MEASURING ELECTRIC VARIABLES; MEASURING MAGNETIC VARIABLES
- G01R31/00—Arrangements for testing electric properties; Arrangements for locating electric faults; Arrangements for electrical testing characterised by what is being tested not provided for elsewhere
- G01R31/28—Testing of electronic circuits, e.g. by signal tracer
- G01R31/317—Testing of digital circuits
- G01R31/3181—Functional testing
- G01R31/319—Tester hardware, i.e. output processing circuits
- G01R31/3193—Tester hardware, i.e. output processing circuits with comparison between actual response and known fault free response
- G01R31/31937—Timing aspects, e.g. measuring propagation delay
Definitions
- the present invention relates to methods of and systems for plotting data, and more particularly, to methods of and systems for efficiently plotting data in the form of N dimensional shmoo plots.
- a computer memory board designer could utilize data regarding how a dynamic random access memory (hereinafter referred to as DRAM) device performs with respect to various functional parameters, e.g., the supply voltage (V CC ) into the device, and the device read/write cycle time (i.e., the amount of time it takes to write to and subsequently read from the DRAM).
- DRAM dynamic random access memory
- V CC supply voltage
- V CC the supply voltage
- the device read/write cycle time i.e., the amount of time it takes to write to and subsequently read from the DRAM.
- a parametric test may be arranged to evaluate the device performance as V CC varies from 2.2V to 3.7V in steps of 0.1V (a total of 16 discrete voltages), and as the read/write cycle time varies from 4.5 to 12 nS in steps of 0.5 nS (for a total of 16 discrete cycle times).
- V CC varies from 2.2V to 3.7V in steps of 0.1V
- the read/write cycle time varies from 4.5 to 12 nS in steps of 0.5 nS (for a total of 16 discrete cycle times).
- Each individual combination of test parameters is referred to herein as a test condition.
- FIG. 1 shows these 256 pass/fail results in what is known in the art as a ‘shmoo’ (or alternatively, schmoo, smoo, shmu, schmu, etc.) plot.
- FIG. 1 is an example of a two dimensional shmoo plot, although in general, a shmoo plot may be N-dimensional, N being an integer greater than 1.
- the term ‘plot’ suggests a graphical depiction of the data (i.e., at most three dimensions), description the term ‘plot’ should be taken as a general representation of data in N-dimensional data space, memory space, etc. In the shmoo plot of FIG.
- an array of 16 rows and 16 columns represents the 256 individual performance tests; each row represents one of the 16 cycle times, and each column represents one of the 16 V CC voltages.
- the array element in the i th row and j th column corresponds to the performance test T ij in which the i th cycle time and the j th V CC voltage are applied to the device.
- a darkened array element represents a failed test T ij
- a white array element represents a passed test T ij .
- the invention in one aspect comprises a method of generating a plot that evinces common result regions of a test as a function of at least one controllable input parameter, where each parameter has a predetermined range and a predetermined resolution.
- the method defines an overall plot region that is a function of a maximum and a minimum of each predetermined range.
- the method further subdivides the overall plot region into at least two sub-regions, each of the sub-regions having a sub-region boundary.
- the method evaluates, for each of the sub-regions, a plurality of boundary test conditions on the sub-region boundary according to the test, so as to assign a test status to each of the plurality of boundary test conditions.
- the method designates that sub-region with the common test status. For each of the sub-regions not having at least the predetermined threshold number of boundary test conditions with a common test status, the method designates that sub-region with an indeterminate status.
- the method further including the step of recursively performing the subdividing step, the evaluating step and the designating step for each of the sub-regions designated with an unknown, indeterminate result status until all of the sub-regions are designated by a determinate test status.
- the evaluating step further includes the step of assigning either a pass test status or a fail test status to each of the plurality of boundary test conditions.
- the sub-region boundary includes a plurality of corner test conditions, and the plurality of boundary test conditions includes the corner test conditions.
- the predetermined threshold number of boundary test conditions includes all of the corner test conditions.
- the at least two sub-regions are substantially identical.
- the plot is an N-dimensional plot that corresponds to N controllable input parameters.
- the method further includes the step of searching for at least one discrepancy between (i) a test status of a test condition designated by the designating step, and (ii) a test status of the test condition according to the performance test.
- the method further includes the step of evaluating, via the performance test, those test conditions that have a test status designated by the designating step and are adjacent to a test condition having a test status assigned according to the performance test.
- the method further includes the step of reassigning the test condition according to the performance test.
- the invention comprises a method of generating a shmoo plot as a function of a performance test and a plurality of parameters, each of the parameters having a predetermined parameter range and a predetermined parameter resolution.
- the method defines an overall shmoo plot region as a function of a maximum and a minimum of each predetermined parameter range.
- the method further subdivides the overall shmoo plot region into sub-regions, and evaluates each of a plurality of corner test conditions of each of the sub-regions according to the performance test, so as to assign a test status, including either a pass status or a fail status, to each of the corner test conditions depending upon a result of the performance test.
- the method For each of the sub-regions having all of the corner test conditions assigned a common status, the method further designates those sub-regions with the common status. For each of the sub-regions not having all of the corner test conditions assigned a status, the method repeats the subdividing, evaluating and designating steps until all of those sub-regions have been designated with the test status.
- the invention comprises a method of generating an N dimensional shmoo plot as a function of a performance test and N parameters, each of the parameters having a predetermined parameter range and a predetermined parameter resolution.
- the method defines an overall shmoo plot region as a function of a maximum and a minimum of each predetermined parameter range.
- the method subdivides the overall shmoo plot region into 2 N equal sub-regions, each the sub-region having 2 N corner test conditions, and evaluates each of the 2 N corner test conditions of each of the 2 N sub-regions according to the performance test, so as to assign a test status, including either a pass status or a fail status, to each of the 2 2N corner test conditions depending upon a result of the performance test.
- the method designates the sub-region with the common status. For each of the 2 N subregions not having all of the 2 N corner test conditions assigned a status, the method repeats the subdividing, evaluating and designating steps until all of the sub-regions have been designated with the test status.
- the invention comprises a computer system for generating a plot that evinces common result regions of a test as a function of at least one controllable input parameter, each of the at least one input parameter having a predetermined range and a predetermined resolution.
- the computer system includes a layout tool for defining an overall plot region being a function of a maximum and a minimum of each the predetermined range.
- the system further includes a delineator for subdividing the overall plot region into at least two sub-regions, each of the sub-regions having a sub-region boundary, and an evaluator for evaluating a plurality of boundary test conditions on the sub-region boundary according to the test, so as to assign a test status to each of the plurality of boundary test conditions.
- the computer system also includes a designator (i) for designating the sub-region with the common test status for each of the sub-regions with at least a predetermined threshold number of boundary test conditions having a common test status, and (ii) for designating the sub-region with an indeterminate status for each of the sub-regions not having at least the predetermined threshold number of boundary test conditions with a common test status.
- the delineator, the evaluator and the designator recursively subdivide, evaluate and designate, respectively, each of the sub-regions designated with an indeterminate result status until all of the sub-regions are designated by a test status.
- the evaluator assigns either a pass test status or a fail test status to each of the plurality of boundary test conditions.
- the sub-region boundary includes a plurality of corner test conditions, and the plurality of boundary test conditions includes the corner test conditions.
- the predetermined threshold number of boundary points includes all of the corner test conditions.
- FIG. 1 illustrates an example of a two dimensional shmoo plot
- FIG. 2 shows a block diagram of one preferred embodiment of an system for generating a binary shmoo plot
- FIG. 3 graphically shows the results of the delineator subdividing the overall plot region of the shmoo plot of FIG. 1 into multiple sub-regions;
- FIG. 4 graphically shows the results of the evaluator identifying and assigning test statuses to each of the corner test conditions of the sub-regions of FIG. 3;
- FIG. 5 graphically shows the results of the delineator further subdividing the indeterminate sub-region into smaller sub-regions
- FIG. 6 graphically shows the results of the evaluator identifying and assigning test statuses to each of the corner test conditions of the smaller sub-regions of FIG. 5;
- FIG. 7 shows a block diagram of another embodiment of the system shown in FIG. 2;
- FIG. 8 illustrates a set of test conditions in which a designation error could occur
- FIG. 9A graphically illustrates a straight-line boundary between a failing region and a passing region
- FIG. 9B graphically illustrates the results of the edge detector identifying a first set of adjacent test conditions
- FIG. 9C graphically shows the identification of a second set of adjacent test conditions
- FIG. 9D graphically shows the identification of a third set of adjacent test conditions
- FIG. 9E graphically illustrates the partial results of the edge detector processing the straight-line boundary of FIG. 9A;
- FIG. 10A shows a prior art two dimensional shmoo plot generated by evaluating all possible test conditions defined by the input parameters
- FIG. 10B shows a two dimensional shmoo plot generated by the system shown in FIG. 2, without an edge detector
- FIG. 10C shows a two dimensional shmoo plot generated by the system shown in FIG. 2, with an edge detector.
- FIG. 2 shows a block diagram of one preferred embodiment of an system for generating a binary shmoo plot in N-dimensional space as a function of N controllable parameters, including a layout tool 102 , a delineator 104 , an evaluator 106 and a designator 108 .
- the layout tool 102 receives the maximum value and minimum value for each of the N parameters, and uses these extreme to determine and generate a model representing the overall plot region.
- the overall plot region thus defines all possible test conditions with respect to the N controllable parameters.
- the delineator 104 receives the model representing the overall plot region from the layout tool 102 and subdivides the overall plot region into sub-regions.
- the delineator 104 divides the overall region into 2 N substantially equal sub-regions each having 2 N corners, although in other embodiments the overall region could be divided into several sub-regions having various, non-uniform shapes. In one preferred embodiment, the sub-regions are contiguous, although in other embodiments some or all of the sub-regions may be non-contiguous.
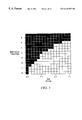
- FIG. 3 shows the results of the delineator 104 subdividing the overall plot region of the shmoo plot of FIG. 1 .
- Each corner represents a unique test condition of the overall plot region.
- the first sub-region 130 , the second sub-region 132 , the third sub-region 134 and the fourth subregion 136 are all rectangular arrays of 8 ⁇ 8.
- the delineator 104 provides models representing these sub-regions to the evaluator 106 , which evaluates the performance test for some or all of the parameter values at the boundary of each sub-region. In the exemplary case of FIG. 3, the evaluator evaluates the performance test for the parameter values corresponding to each of the corners of each of the sub-regions and assigns a test status (either pass or fail) to the corresponding corner.
- each corner represents a test condition corresponding to a discrete value of each input parameter (in this case, a discrete V CC voltage and a discrete cycle time).
- the first sub-region 130 includes corners (3.0, 4.5), (3.7, 4.5), (3.7, 8.0) and (3.0, 8.0), which result in the corresponding test results fail, fail, pass and pass, respectively.
- the designator 108 receives a model corresponding to the sub-region results shown in FIG. 4 .
- the designator designates each sub-region as a function of some or all of the sub-region boundary assignments.
- the designator 108 designates each sub-region as a function of the results of the corner performance tests as follows: if all corners in a particular sub-region are assigned the same test status, that entire sub-region is designated with the test status, and if any two corners are assigned different test status, that sub-region is designated as ‘indeterminate’. Note that if an entire sub-region is designated with a test status, the test statuses for all of the test conditions within the sub-region (except for those on the boundary that were actually tested) are assume test statuses.
- the designator designates the entire sub-region 132 as a “pass” region, because all four corners (3.0, 8.5), (3.7, 8.5), (3.7, 12.0) and (3.0, 12.0) have been assigned a “pass” test status by the evaluator 106 .
- This embodiment of the invention performs no further processing of a sub-region once that entire sub-region has been designated with a test status. Since none of the sub-regions 130 , 134 nor 136 have all four corners with identical test status, all three subregions 130 , 134 and 136 are designated as indeterminate by the designator 108 . As shown in FIG. 2, sub-regions designated as indeterminate return to the input of the delineator 104 for further processing.
- the delineator 104 receives the indeterminate sub-region from the designator 108 and further subdivides the indeterminate sub-region into 2 N smaller sub-regions, as shown in FIG. 5 (in this exemplary case, 4 smaller sub-regions).
- Sub-region 130 is divided into smaller subregions 140 , 142 , 144 and 146 .
- Sub-region 134 is divided into smaller sub-regions 148 , 150 , 152 and 154 .
- Sub-region 136 is divided into smaller sub-regions 156 , 158 , 160 and 162 .
- the evaluator 106 evaluates the performance test for the parameter values corresponding to each of the 2 N (in this exemplary case, four) corners of each of the smaller sub-regions and assigns a test status (either pass or fail) to the corresponding corner as shown in FIG. 5 .
- the designator 108 again designates each smaller sub-region as a function of the results of the corner performance tests, as described hereinbefore. For example, in sub-region 130 , the evaluator 106 assigns all four corners of the smaller sub-region 140 with a pass test status, so the designator 108 designates the entire smaller sub-region 140 with a fail test status, as shown in FIG. 6 . Likewise, the designator 108 designates the smaller sub-region 144 with a pass test status, and designates the smaller sub-regions 142 and 146 with an indeterminate test status.
- the delineator 104 further subdivides the sub-region 142 into four smaller sub-regions 164 , 166 , 168 and 170 .
- the evaluator 106 evaluates the four corners of the smaller sub-region 164 , all possible test conditions within smaller sub-region will have been evaluated, since the smaller sub-region 164 only includes those four corners and further sub-dividing is not possible.
- FIGS. 2-6 describe a system and method for generating a two-dimensional shmoo plot by recursively subdividing the overall plot into 2 N sub-regions having substantially identical shapes and sizes
- alternate embodiments of this invention using the same general concepts described herein can generate an N-dimensional shmoo plot and can recursively subdivide the overall plot into dissimilar shapes.
- a three dimensional shmoo plot provides a representation of performance test results as three functional parameters are varied over their respective ranges.
- the corners of each sub-region are evaluated according to the associated performance test and each corner is consequently assigned a pass or fail test status. If all eight corners of a sub-region are identical, that sub-region is designated with the test status of its corners. Otherwise, the sub-region is again subdivided and evaluated. This procedure is performed recursively as described herein for the two dimensional case until all sub-regions are designated with a test status or all test conditions have been evaluated.
- the exemplary embodiments describe a system and method that evaluates 2 N corners of each of the equal size and shape sub-regions
- alternate embodiments of the invention can designate the sub-regions by evaluating other portions of the sub-region. For example, for an irregular shaped sub-region (i.e., one without distinct corners), an embodiment of the evaluator 106 could evaluate all test conditions along the sub-region boundary, or the evaluator 106 could evaluate only predetermined ones of the test conditions along the sub-region boundary.
- the system further includes an edge detector 110 for identifying and correctly designating test conditions that may have been erroneously designated by the above-described embodiments.
- FIG. 8 illustrates a situation (i.e., a set of test conditions) for which such an error could occur.
- the transition line 202 describes the actual transition from passing to failing. The area to the left and above the line 202 represents failed performance tests, and the area to the right and below the line 202 represents passed performance tests.
- the edge detector 110 operates by first distinguishing between those test conditions that were actually evaluated and assigned a test status by the evaluator 106 during the above-described procedure, and those test conditions that were designated with a test status by the designator 108 due to the boundary conditions of the parent sub-region (i.e., assumed test statuses).
- the edge detector 110 evaluates all of the un-evaluated test conditions (having assumed test statuses) that are adjacent to, and were designated with a different test status from, the test conditions that were actually evaluated by the evaluator 106 . If the result of an actual evaluation of a previously un-evaluated test condition indicates that the assumed test status was incorrect, the edge detector 110 reassigns that test condition with the test status from the actual evaluation. A test condition that has its test status changed by this procedure is treated in the same manner as one of the test conditions that were actually evaluated by the evaluator 106 , i.e., all adjacent test conditions having an assumed test status that is different are actually evaluated. This procedure continues until no assumed value/adjacent test conditions remain.
- FIGS. 9A-9E A simple example of the operation of the edge detector 110 is shown in FIGS. 9A-9E.
- FIG. 9A shows a shmoo plot showing a substantially straight line transition from failing (black) to passing (white).
- the failing test result on the test condition labeled with an “X” is a test result that the evaluator 106 assigns as a result of an actual performance test. All other (unlabeled) test results were designated by the designator 108 , i.e., they are assumed test results.
- FIG. 9B shows the adjacent test conditions, each labeled with an “A,” that are initially analyzed by the edge detector 110 .
- the underlined “A” represents an adjacent test condition that when tested via the performance test, indicates a different actual test results (i.e., fail-black) as compared to the assumed test results (i.e., pass-white).
- the edge detector changes the test result of that test condition to its actual test result (i.e., fail-black).
- FIG. 9C also shows all of the test conditions adjacent to the newly-designated test condition.
- the underlined “A” represents an adjacent test condition that when tested via the performance test, indicates a different actual test results (i.e., fail-black) as compared to the assumed test results (i.e., pass-white).
- the edge detector 110 again changes the state of those two test conditions, as shown in FIG. 9 D.
- FIG. 9D shows that of the 9 adjacent test conditions with assumed test states, only two of them (designated with underlined “A's”) have incorrect test statuses, and those are shown designated with their actual test statuses in FIG. 9 E.
- the edge detector 110 analyzes those adjacent test conditions having assumed test statuses of the two newly designated test conditions. This procedure continues until all such adjacent test conditions are evaluated by the edge detector 110 . Comparing FIG. 9A with FIG.
- 9E shows how the edge detector 110 modifies the relatively straight line that delineates the failing region from the passing region to include a failing “bump” into the passing region.
- the edge detector 110 would detect and re-assign the test conditions about the erroneously designated test conditions 212 shown in FIG. 8 .
- the edge detector follows the line between the passing and failing regions of the shmoo plot, and modifies the line by selectively evaluating individual test conditions via the performance test.
- FIGS. 10A, 10 B and 10 C illustrate the performance differences among a prior art method, the method of the present invention without the edge detector, and the present invention with the edge detector, respectively.
- the two dimensional shmoo plot of FIG. 10A generated by the prior art method of evaluating all possible test conditions defined by the input parameters, took approximately 478 seconds to complete.
- the two dimensional shmoo plot of FIG. 10B generated by the system shown in FIG. 2, took approximately 36 seconds to complete.
- FIGS. 10A and 10B shows that the time to complete the plot using the system of FIG. 2 is reduced by more than an order of magnitude as compared to the prior art method.
- FIGS. 10A and 10B also shows a significant reduction in the plot accuracy from the prior art baseline. Comparing FIGS.
- FIG. 10A and 10C shows that although adding the edge detector requires an additional 11 seconds to complete the shmoo plot (as compared to FIG. 10 B), it is still more than an order of magnitude faster than the prior art method.
- FIG. 10C shows that the additional 11 seconds provides a significant amount of detail in the resulting shmoo plot; the plot in FIG. 10C is nearly indistinguishable from the prior art plot of FIG. 10 A.
Abstract
Description
Claims (26)
Priority Applications (1)
| Application Number | Priority Date | Filing Date | Title |
|---|---|---|---|
| US09/344,861 US6418387B1 (en) | 1999-06-28 | 1999-06-28 | Method of and system for generating a binary shmoo plot in N-dimensional space |
Applications Claiming Priority (1)
| Application Number | Priority Date | Filing Date | Title |
|---|---|---|---|
| US09/344,861 US6418387B1 (en) | 1999-06-28 | 1999-06-28 | Method of and system for generating a binary shmoo plot in N-dimensional space |
Publications (1)
| Publication Number | Publication Date |
|---|---|
| US6418387B1 true US6418387B1 (en) | 2002-07-09 |
Family
ID=23352370
Family Applications (1)
| Application Number | Title | Priority Date | Filing Date |
|---|---|---|---|
| US09/344,861 Expired - Lifetime US6418387B1 (en) | 1999-06-28 | 1999-06-28 | Method of and system for generating a binary shmoo plot in N-dimensional space |
Country Status (1)
| Country | Link |
|---|---|
| US (1) | US6418387B1 (en) |
Cited By (8)
| Publication number | Priority date | Publication date | Assignee | Title |
|---|---|---|---|---|
| US20040088126A1 (en) * | 2002-11-01 | 2004-05-06 | Weller Christopher Todd | System and method for generating a shmoo plot by varying the resolution thereof |
| US20040098644A1 (en) * | 2002-11-18 | 2004-05-20 | John Wuu | System and method for generating a graphical representation of fault data of a memory device under test |
| US6795788B2 (en) * | 2000-06-06 | 2004-09-21 | Hewlett-Packard Development Company, L.P. | Method and apparatus for discovery of operational boundaries for shmoo tests |
| US6820027B2 (en) | 2002-11-01 | 2004-11-16 | Hewlett-Packard Development Company, L.P. | System and method for generating a shmoo plot by avoiding testing in failing regions |
| US6847909B2 (en) | 2002-11-01 | 2005-01-25 | Hewlett-Packard Development Company, L.P. | System and method for generating a shmoo plot by tracking the edge of the passing region |
| US20070043994A1 (en) * | 2005-08-04 | 2007-02-22 | Rosen Mark E | Obtaining test data for a device |
| US20070156352A1 (en) * | 2005-12-19 | 2007-07-05 | Lokesh Johri | Estimating boundaries of schmoo plots |
| WO2010082330A1 (en) * | 2009-01-15 | 2010-07-22 | 株式会社アドバンテスト | Method and program for detecting characteristics of device under test (dut) and storage medium containing the program |
Citations (17)
| Publication number | Priority date | Publication date | Assignee | Title |
|---|---|---|---|---|
| US3633174A (en) * | 1970-04-14 | 1972-01-04 | Us Navy | Memory system having self-adjusting strobe timing |
| US3655959A (en) * | 1970-08-17 | 1972-04-11 | Computer Test Corp | Magnetic memory element testing system and method |
| US4502140A (en) * | 1983-07-25 | 1985-02-26 | Mostek Corporation | GO/NO GO margin test circuit for semiconductor memory |
| US5006807A (en) * | 1988-12-27 | 1991-04-09 | Blum Steven M | Method for determining undershoot resistance of an electronic device |
| US5107205A (en) * | 1990-07-25 | 1992-04-21 | Mitsubishi Denki Kabushiki Kaisha | Semiconductor device tester with a test waveform monitoring circuit |
| JPH04236372A (en) * | 1991-01-18 | 1992-08-25 | Mitsubishi Electric Corp | Testing apparatus for semiconductor integrated circuit |
| US5200696A (en) * | 1990-09-10 | 1993-04-06 | Ltx Corporation | Test system apparatus with Schottky diodes with programmable voltages |
| US5339269A (en) * | 1991-07-30 | 1994-08-16 | Sony Corporation | Semiconductor memory module |
| US5412349A (en) * | 1992-03-31 | 1995-05-02 | Intel Corporation | PLL clock generator integrated with microprocessor |
| JPH07218299A (en) * | 1994-01-27 | 1995-08-18 | Mitsubishi Electric Corp | Automatic judging device of test result |
| US5481550A (en) * | 1993-04-27 | 1996-01-02 | Schlumberger Technologies, Inc. | Apparatus for maintaining stimulation to a device under test after a test stops |
| US5631910A (en) * | 1990-06-18 | 1997-05-20 | Kabushiki Kaisha Toshiba | Information processing system provided with self-diagnosing circuit and the self-diagnosing method therefor |
| US5841271A (en) * | 1993-11-17 | 1998-11-24 | Nec Corporation | Test mode power circuit for integrated-circuit chip |
| US5889429A (en) * | 1996-01-22 | 1999-03-30 | Mitsubishi Denki Kabushiki Kaisha | Semiconductor integrated circuit and semiconductor integrated circuit device |
| JPH11190761A (en) * | 1997-12-26 | 1999-07-13 | Advantest Corp | Semiconductor test apparatus |
| US5952863A (en) * | 1996-12-09 | 1999-09-14 | Texas Instruments Incorporated | Circuit and method for generating non-overlapping clock signals for an integrated circuit |
| US6079038A (en) * | 1998-04-24 | 2000-06-20 | Credence Systems Corporation | Method for generating a Shmoo plot contour for integrated circuit tester |
-
1999
- 1999-06-28 US US09/344,861 patent/US6418387B1/en not_active Expired - Lifetime
Patent Citations (17)
| Publication number | Priority date | Publication date | Assignee | Title |
|---|---|---|---|---|
| US3633174A (en) * | 1970-04-14 | 1972-01-04 | Us Navy | Memory system having self-adjusting strobe timing |
| US3655959A (en) * | 1970-08-17 | 1972-04-11 | Computer Test Corp | Magnetic memory element testing system and method |
| US4502140A (en) * | 1983-07-25 | 1985-02-26 | Mostek Corporation | GO/NO GO margin test circuit for semiconductor memory |
| US5006807A (en) * | 1988-12-27 | 1991-04-09 | Blum Steven M | Method for determining undershoot resistance of an electronic device |
| US5631910A (en) * | 1990-06-18 | 1997-05-20 | Kabushiki Kaisha Toshiba | Information processing system provided with self-diagnosing circuit and the self-diagnosing method therefor |
| US5107205A (en) * | 1990-07-25 | 1992-04-21 | Mitsubishi Denki Kabushiki Kaisha | Semiconductor device tester with a test waveform monitoring circuit |
| US5200696A (en) * | 1990-09-10 | 1993-04-06 | Ltx Corporation | Test system apparatus with Schottky diodes with programmable voltages |
| JPH04236372A (en) * | 1991-01-18 | 1992-08-25 | Mitsubishi Electric Corp | Testing apparatus for semiconductor integrated circuit |
| US5339269A (en) * | 1991-07-30 | 1994-08-16 | Sony Corporation | Semiconductor memory module |
| US5412349A (en) * | 1992-03-31 | 1995-05-02 | Intel Corporation | PLL clock generator integrated with microprocessor |
| US5481550A (en) * | 1993-04-27 | 1996-01-02 | Schlumberger Technologies, Inc. | Apparatus for maintaining stimulation to a device under test after a test stops |
| US5841271A (en) * | 1993-11-17 | 1998-11-24 | Nec Corporation | Test mode power circuit for integrated-circuit chip |
| JPH07218299A (en) * | 1994-01-27 | 1995-08-18 | Mitsubishi Electric Corp | Automatic judging device of test result |
| US5889429A (en) * | 1996-01-22 | 1999-03-30 | Mitsubishi Denki Kabushiki Kaisha | Semiconductor integrated circuit and semiconductor integrated circuit device |
| US5952863A (en) * | 1996-12-09 | 1999-09-14 | Texas Instruments Incorporated | Circuit and method for generating non-overlapping clock signals for an integrated circuit |
| JPH11190761A (en) * | 1997-12-26 | 1999-07-13 | Advantest Corp | Semiconductor test apparatus |
| US6079038A (en) * | 1998-04-24 | 2000-06-20 | Credence Systems Corporation | Method for generating a Shmoo plot contour for integrated circuit tester |
Cited By (16)
| Publication number | Priority date | Publication date | Assignee | Title |
|---|---|---|---|---|
| US6795788B2 (en) * | 2000-06-06 | 2004-09-21 | Hewlett-Packard Development Company, L.P. | Method and apparatus for discovery of operational boundaries for shmoo tests |
| US20040088126A1 (en) * | 2002-11-01 | 2004-05-06 | Weller Christopher Todd | System and method for generating a shmoo plot by varying the resolution thereof |
| US6820027B2 (en) | 2002-11-01 | 2004-11-16 | Hewlett-Packard Development Company, L.P. | System and method for generating a shmoo plot by avoiding testing in failing regions |
| US6820021B2 (en) | 2002-11-01 | 2004-11-16 | Hewlett-Packard Development Company, L.P. | System and method for generating a shmoo plot by varying the resolution thereof |
| US20040230392A1 (en) * | 2002-11-01 | 2004-11-18 | Weller Christopher Todd | System and method for generating a SHMOO plot by varying the resolution thereof |
| US6847909B2 (en) | 2002-11-01 | 2005-01-25 | Hewlett-Packard Development Company, L.P. | System and method for generating a shmoo plot by tracking the edge of the passing region |
| US6870388B2 (en) * | 2002-11-01 | 2005-03-22 | Hewlett-Packard Development Company, L.P. | System and method for generating a SHMOO plot by varying the resolution thereof |
| US20040098644A1 (en) * | 2002-11-18 | 2004-05-20 | John Wuu | System and method for generating a graphical representation of fault data of a memory device under test |
| US20070043994A1 (en) * | 2005-08-04 | 2007-02-22 | Rosen Mark E | Obtaining test data for a device |
| JP2009512000A (en) * | 2005-08-04 | 2009-03-19 | テラダイン、 インコーポレイテッド | Obtain device test data |
| US7519878B2 (en) | 2005-08-04 | 2009-04-14 | Teradyne, Inc. | Obtaining test data for a device |
| US20070156352A1 (en) * | 2005-12-19 | 2007-07-05 | Lokesh Johri | Estimating boundaries of schmoo plots |
| US7711524B2 (en) * | 2005-12-19 | 2010-05-04 | Verigy (Singapore) Pte. Ltd. | Estimating boundaries of Schmoo plots |
| WO2010082330A1 (en) * | 2009-01-15 | 2010-07-22 | 株式会社アドバンテスト | Method and program for detecting characteristics of device under test (dut) and storage medium containing the program |
| US20110119010A1 (en) * | 2009-01-15 | 2011-05-19 | Advantest Corporation | Method of determining characteristics of device under test, program, and storage medium storing program |
| JPWO2010082330A1 (en) * | 2009-01-15 | 2012-06-28 | 株式会社アドバンテスト | Method for determining characteristics of device under test, program, and storage medium storing the same |
Similar Documents
| Publication | Publication Date | Title |
|---|---|---|
| Guillerme et al. | Shifting spaces: Which disparity or dissimilarity measurement best summarize occupancy in multidimensional spaces? | |
| US3659088A (en) | Method for indicating memory chip failure modes | |
| Murphy et al. | An approach to software testing of machine learning applications | |
| US8254661B2 (en) | System and method for generating spatial signatures | |
| US5950181A (en) | Apparatus and method for detecting and assessing a spatially discrete dot pattern | |
| JPS62214598A (en) | Allotment of redundant line for 2-d array | |
| US6418387B1 (en) | Method of and system for generating a binary shmoo plot in N-dimensional space | |
| JPH02252066A (en) | Simulation device | |
| US11409623B2 (en) | Integrated circuit (IC) power-up testing method and device, and electronic equipment | |
| US20240071557A1 (en) | Failure analysis method, computer equipment, and storage medium | |
| Lee et al. | A new ATPG algorithm to limit test set size and achieve multiple detections of all faults | |
| US20090172643A1 (en) | Program verification apparatus, program verification method, and program storage medium | |
| US5544175A (en) | Method and apparatus for the capturing and characterization of high-speed digital information | |
| CN112037844B (en) | Variable retention time pattern analysis method, device, equipment and readable storage medium | |
| US20030033561A1 (en) | Apparatus for testing memories with redundant storage elements | |
| US6701477B1 (en) | Method for identifying the cause of yield loss in integrated circuit manufacture | |
| KR19990006857A (en) | Apparatus and method for analyzing circuit test results and recording medium storing the analysis program | |
| US20050114811A1 (en) | Static timing and risk analysis tool | |
| US8402421B2 (en) | Method and system for subnet defect diagnostics through fault compositing | |
| US20080189582A1 (en) | Analysis techniques for multi-level memory | |
| JP4371488B2 (en) | Device test evaluation system and device test evaluation method | |
| Gómez-Pau et al. | Efficient production binning using octree tessellation in the alternate measurements space | |
| KR101314370B1 (en) | Memory device fail summary data reduction for improved redundancy analysis | |
| Jiang et al. | Misclassification cost-sensitive fault prediction models | |
| KR100200481B1 (en) | Test circuit |
Legal Events
| Date | Code | Title | Description |
|---|---|---|---|
| AS | Assignment |
Owner name: LTX CORPORATION, MASSACHUSETTS Free format text: ASSIGNMENT OF ASSIGNORS INTEREST;ASSIGNOR:CARNEY, MICHAEL D.;REEL/FRAME:010073/0021 Effective date: 19990624 |
|
| STCF | Information on status: patent grant |
Free format text: PATENTED CASE |
|
| FEPP | Fee payment procedure |
Free format text: PAYOR NUMBER ASSIGNED (ORIGINAL EVENT CODE: ASPN); ENTITY STATUS OF PATENT OWNER: LARGE ENTITY |
|
| FPAY | Fee payment |
Year of fee payment: 4 |
|
| FPAY | Fee payment |
Year of fee payment: 8 |
|
| FPAY | Fee payment |
Year of fee payment: 12 |
|
| AS | Assignment |
Owner name: SILICON VALLEY BANK, AS ADMINISTRATIVE AGENT, CALI Free format text: SECURITY AGREEMENT;ASSIGNORS:LTX-CREDENCE CORPORATION;EVERETT CHARLES TECHNOLOGIES LLC;REEL/FRAME:032086/0476 Effective date: 20131127 |
|
| AS | Assignment |
Owner name: XCERRA CORPORATION, MASSACHUSETTS Free format text: CHANGE OF NAME;ASSIGNOR:LTX-CREDENCE CORPORATION;REEL/FRAME:033032/0768 Effective date: 20140520 |
|
| AS | Assignment |
Owner name: XCERRA CORPORATION, MASSACHUSETTS Free format text: RELEASE OF SECURITY INTEREST IN UNITED STATES PATENTS;ASSIGNOR:SILICON VALLEY BANK, AS ADMINISTRATIVE AGENT;REEL/FRAME:034660/0394 Effective date: 20141215 Owner name: EVERETT CHARLES TECHNOLOGIES LLC, MASSACHUSETTS Free format text: RELEASE OF SECURITY INTEREST IN UNITED STATES PATENTS;ASSIGNOR:SILICON VALLEY BANK, AS ADMINISTRATIVE AGENT;REEL/FRAME:034660/0394 Effective date: 20141215 Owner name: SILICON VALLEY BANK, AS ADMINISTRATIVE AGENT, CALI Free format text: SECURITY AGREEMENT;ASSIGNORS:XCERRA CORPORATION;EVERETT CHARLES TECHNOLOGIES LLC;REEL/FRAME:034660/0188 Effective date: 20141215 |
|
| AS | Assignment |
Owner name: SILICON VALLEY BANK, AS ADMINISTRATIVE AGENT, CALI Free format text: CORRECTIVE ASSIGNMENT TO CORRECT THE INCORRECT PATENT NUMBER 7261561 AND REPLACE WITH PATENT NUMBER 7231561 PREVIOUSLY RECORDED ON REEL 034660 FRAME 0188. ASSIGNOR(S) HEREBY CONFIRMS THE SECURITY AGREEMENT;ASSIGNORS:XCERRA CORPORATION;EVERETT CHARLES TECHNOLOGIES LLC;REEL/FRAME:037824/0372 Effective date: 20141215 |
|
| AS | Assignment |
Owner name: DEUTSCHE BANK AG NEW YORK BRANCH, AS COLLATERAL AGENT, NEW YORK Free format text: PATENT SECURITY AGREEMENT;ASSIGNOR:XCERRA CORPORATION;REEL/FRAME:047185/0624 Effective date: 20181001 Owner name: DEUTSCHE BANK AG NEW YORK BRANCH, AS COLLATERAL AG Free format text: PATENT SECURITY AGREEMENT;ASSIGNOR:XCERRA CORPORATION;REEL/FRAME:047185/0624 Effective date: 20181001 |
|
| AS | Assignment |
Owner name: DEUTSCHE BANK AG NEW YORK BRANCH, AS COLLATERAL AGENT, NEW YORK Free format text: CORRECTIVE ASSIGNMENT TO CORRECT THE INCORRECT STATEMENT THAT THIS DOCUMENT SERVES AS AN OATH/DECLARATION PREVIOUSLY RECORDED ON REEL 047185 FRAME 0628. ASSIGNOR(S) HEREBY CONFIRMS THE PATENT SECURITY AGREEMENT;ASSIGNOR:XCERRA CORPORATION;REEL/FRAME:047675/0354 Effective date: 20181001 Owner name: DEUTSCHE BANK AG NEW YORK BRANCH, AS COLLATERAL AG Free format text: CORRECTIVE ASSIGNMENT TO CORRECT THE INCORRECT STATEMENT THAT THIS DOCUMENT SERVES AS AN OATH/DECLARATION PREVIOUSLY RECORDED ON REEL 047185 FRAME 0628. ASSIGNOR(S) HEREBY CONFIRMS THE PATENT SECURITY AGREEMENT;ASSIGNOR:XCERRA CORPORATION;REEL/FRAME:047675/0354 Effective date: 20181001 |
|
| AS | Assignment |
Owner name: XCERRA CORPORATION, MASSACHUSETTS Free format text: TERMINATION AND RELEASE OF SECURITY INTEREST IN PATENTS, RECORDED AT REEL 047185, FRAME 0624;ASSIGNOR:DEUTSCHE BANK AG NEW YORK BRANCH, AS AGENT;REEL/FRAME:066762/0811 Effective date: 20240209 |