US6353471B1 - Method and apparatus for non-destructive screening of specimen integrity - Google Patents
Method and apparatus for non-destructive screening of specimen integrity Download PDFInfo
- Publication number
- US6353471B1 US6353471B1 US08/871,606 US87160697A US6353471B1 US 6353471 B1 US6353471 B1 US 6353471B1 US 87160697 A US87160697 A US 87160697A US 6353471 B1 US6353471 B1 US 6353471B1
- Authority
- US
- United States
- Prior art keywords
- sample
- interferent
- concentration
- radiation
- spectrophotometer
- Prior art date
- Legal status (The legal status is an assumption and is not a legal conclusion. Google has not performed a legal analysis and makes no representation as to the accuracy of the status listed.)
- Expired - Lifetime
Links
- 238000000034 method Methods 0.000 title claims abstract description 62
- 238000012216 screening Methods 0.000 title abstract description 10
- 230000001066 destructive effect Effects 0.000 title abstract description 3
- 230000005855 radiation Effects 0.000 claims abstract description 53
- 238000002835 absorbance Methods 0.000 claims abstract description 30
- 238000004422 calculation algorithm Methods 0.000 claims abstract description 26
- 229940028435 intralipid Drugs 0.000 claims description 38
- BPYKTIZUTYGOLE-IFADSCNNSA-N Bilirubin Chemical compound N1C(=O)C(C)=C(C=C)\C1=C\C1=C(C)C(CCC(O)=O)=C(CC2=C(C(C)=C(\C=C/3C(=C(C=C)C(=O)N\3)C)N2)CCC(O)=O)N1 BPYKTIZUTYGOLE-IFADSCNNSA-N 0.000 claims description 32
- 238000001228 spectrum Methods 0.000 claims description 12
- 230000010354 integration Effects 0.000 claims description 11
- 238000011481 absorbance measurement Methods 0.000 claims description 8
- 238000003556 assay Methods 0.000 claims description 8
- 230000001678 irradiating effect Effects 0.000 claims description 6
- 238000005259 measurement Methods 0.000 abstract description 52
- 210000002966 serum Anatomy 0.000 abstract description 36
- 210000004369 blood Anatomy 0.000 abstract description 21
- 239000008280 blood Substances 0.000 abstract description 21
- 238000012360 testing method Methods 0.000 abstract description 13
- 239000000126 substance Substances 0.000 abstract description 11
- 238000004364 calculation method Methods 0.000 abstract description 7
- 238000000275 quality assurance Methods 0.000 abstract description 4
- 238000009534 blood test Methods 0.000 abstract 1
- 230000001010 compromised effect Effects 0.000 abstract 1
- 239000000523 sample Substances 0.000 description 141
- 102100036068 FERM domain-containing protein 8 Human genes 0.000 description 21
- 101710195878 FERM domain-containing protein 8 Proteins 0.000 description 21
- RCNSAJSGRJSBKK-NSQVQWHSSA-N Biliverdin IX Chemical compound N1C(=O)C(C)=C(C=C)\C1=C\C1=C(C)C(CCC(O)=O)=C(\C=C/2C(=C(C)C(=C/C=3C(=C(C=C)C(=O)N=3)C)/N\2)CCC(O)=O)N1 RCNSAJSGRJSBKK-NSQVQWHSSA-N 0.000 description 15
- 238000004458 analytical method Methods 0.000 description 15
- GWZYPXHJIZCRAJ-UHFFFAOYSA-N Biliverdin Natural products CC1=C(C=C)C(=C/C2=NC(=Cc3[nH]c(C=C/4NC(=O)C(=C4C)C=C)c(C)c3CCC(=O)O)C(=C2C)CCC(=O)O)NC1=O GWZYPXHJIZCRAJ-UHFFFAOYSA-N 0.000 description 14
- QBUVFDKTZJNUPP-UHFFFAOYSA-N biliverdin-IXalpha Natural products N1C(=O)C(C)=C(C=C)C1=CC1=C(C)C(CCC(O)=O)=C(C=C2C(=C(C)C(C=C3C(=C(C=C)C(=O)N3)C)=N2)CCC(O)=O)N1 QBUVFDKTZJNUPP-UHFFFAOYSA-N 0.000 description 14
- 238000012417 linear regression Methods 0.000 description 13
- 239000000835 fiber Substances 0.000 description 12
- 238000011179 visual inspection Methods 0.000 description 8
- 230000003287 optical effect Effects 0.000 description 7
- 238000012937 correction Methods 0.000 description 6
- 230000004044 response Effects 0.000 description 6
- 102000001554 Hemoglobins Human genes 0.000 description 5
- 108010054147 Hemoglobins Proteins 0.000 description 5
- 239000003809 bile pigment Substances 0.000 description 5
- 210000003743 erythrocyte Anatomy 0.000 description 5
- 238000002798 spectrophotometry method Methods 0.000 description 5
- 238000010521 absorption reaction Methods 0.000 description 4
- 239000000463 material Substances 0.000 description 4
- 239000002245 particle Substances 0.000 description 4
- 230000008569 process Effects 0.000 description 4
- 230000003595 spectral effect Effects 0.000 description 4
- 108010004103 Chylomicrons Proteins 0.000 description 3
- 239000004743 Polypropylene Substances 0.000 description 3
- 239000012491 analyte Substances 0.000 description 3
- 238000013459 approach Methods 0.000 description 3
- 238000011088 calibration curve Methods 0.000 description 3
- 201000010099 disease Diseases 0.000 description 3
- 208000037265 diseases, disorders, signs and symptoms Diseases 0.000 description 3
- 239000011521 glass Substances 0.000 description 3
- 229910052736 halogen Inorganic materials 0.000 description 3
- 239000013307 optical fiber Substances 0.000 description 3
- 239000004033 plastic Substances 0.000 description 3
- 229920003023 plastic Polymers 0.000 description 3
- -1 polypropylene Polymers 0.000 description 3
- 229920001155 polypropylene Polymers 0.000 description 3
- 230000000007 visual effect Effects 0.000 description 3
- 238000008050 Total Bilirubin Reagent Methods 0.000 description 2
- 210000000013 bile duct Anatomy 0.000 description 2
- 230000005540 biological transmission Effects 0.000 description 2
- 238000005119 centrifugation Methods 0.000 description 2
- 239000000470 constituent Substances 0.000 description 2
- 238000007405 data analysis Methods 0.000 description 2
- 208000036796 hyperbilirubinemia Diseases 0.000 description 2
- 150000002632 lipids Chemical class 0.000 description 2
- 230000002934 lysing effect Effects 0.000 description 2
- 238000000611 regression analysis Methods 0.000 description 2
- 230000009466 transformation Effects 0.000 description 2
- XLYOFNOQVPJJNP-UHFFFAOYSA-N water Substances O XLYOFNOQVPJJNP-UHFFFAOYSA-N 0.000 description 2
- 102000004506 Blood Proteins Human genes 0.000 description 1
- 108010017384 Blood Proteins Proteins 0.000 description 1
- 206010053567 Coagulopathies Diseases 0.000 description 1
- 108010010803 Gelatin Proteins 0.000 description 1
- 206010018901 Haemoglobinaemia Diseases 0.000 description 1
- 206010018910 Haemolysis Diseases 0.000 description 1
- 208000030546 Hyperbiliverdinemia Diseases 0.000 description 1
- 208000031226 Hyperlipidaemia Diseases 0.000 description 1
- 238000000862 absorption spectrum Methods 0.000 description 1
- 230000003466 anti-cipated effect Effects 0.000 description 1
- 238000000149 argon plasma sintering Methods 0.000 description 1
- 230000000903 blocking effect Effects 0.000 description 1
- 238000004159 blood analysis Methods 0.000 description 1
- 210000000601 blood cell Anatomy 0.000 description 1
- 230000036765 blood level Effects 0.000 description 1
- 238000006243 chemical reaction Methods 0.000 description 1
- 239000003153 chemical reaction reagent Substances 0.000 description 1
- 201000001883 cholelithiasis Diseases 0.000 description 1
- 208000019425 cirrhosis of liver Diseases 0.000 description 1
- 230000035602 clotting Effects 0.000 description 1
- 238000004040 coloring Methods 0.000 description 1
- 150000001875 compounds Chemical class 0.000 description 1
- 238000004590 computer program Methods 0.000 description 1
- 238000001514 detection method Methods 0.000 description 1
- 235000020931 dietary conditions Nutrition 0.000 description 1
- 239000012470 diluted sample Substances 0.000 description 1
- 230000009977 dual effect Effects 0.000 description 1
- 230000000694 effects Effects 0.000 description 1
- 239000000839 emulsion Substances 0.000 description 1
- 238000001914 filtration Methods 0.000 description 1
- 208000001130 gallstones Diseases 0.000 description 1
- 229920000159 gelatin Polymers 0.000 description 1
- 239000008273 gelatin Substances 0.000 description 1
- 235000019322 gelatine Nutrition 0.000 description 1
- 235000011852 gelatine desserts Nutrition 0.000 description 1
- 230000008588 hemolysis Effects 0.000 description 1
- 238000006897 homolysis reaction Methods 0.000 description 1
- 230000003993 interaction Effects 0.000 description 1
- 230000002452 interceptive effect Effects 0.000 description 1
- 238000009533 lab test Methods 0.000 description 1
- 239000002960 lipid emulsion Substances 0.000 description 1
- 230000001000 lipidemic effect Effects 0.000 description 1
- 239000006166 lysate Substances 0.000 description 1
- 238000012544 monitoring process Methods 0.000 description 1
- 230000007935 neutral effect Effects 0.000 description 1
- 230000000149 penetrating effect Effects 0.000 description 1
- 238000005375 photometry Methods 0.000 description 1
- 230000035479 physiological effects, processes and functions Effects 0.000 description 1
- 239000002243 precursor Substances 0.000 description 1
- 238000000513 principal component analysis Methods 0.000 description 1
- 238000004445 quantitative analysis Methods 0.000 description 1
- 238000009789 rate limiting process Methods 0.000 description 1
- 230000000284 resting effect Effects 0.000 description 1
- 238000005070 sampling Methods 0.000 description 1
- 239000010421 standard material Substances 0.000 description 1
- 238000010561 standard procedure Methods 0.000 description 1
- 230000007723 transport mechanism Effects 0.000 description 1
- 239000001052 yellow pigment Substances 0.000 description 1
Images


Classifications
-
- G—PHYSICS
- G01—MEASURING; TESTING
- G01N—INVESTIGATING OR ANALYSING MATERIALS BY DETERMINING THEIR CHEMICAL OR PHYSICAL PROPERTIES
- G01N21/00—Investigating or analysing materials by the use of optical means, i.e. using sub-millimetre waves, infrared, visible or ultraviolet light
- G01N21/17—Systems in which incident light is modified in accordance with the properties of the material investigated
- G01N21/25—Colour; Spectral properties, i.e. comparison of effect of material on the light at two or more different wavelengths or wavelength bands
- G01N21/31—Investigating relative effect of material at wavelengths characteristic of specific elements or molecules, e.g. atomic absorption spectrometry
- G01N21/35—Investigating relative effect of material at wavelengths characteristic of specific elements or molecules, e.g. atomic absorption spectrometry using infrared light
- G01N21/359—Investigating relative effect of material at wavelengths characteristic of specific elements or molecules, e.g. atomic absorption spectrometry using infrared light using near infrared light
-
- G—PHYSICS
- G01—MEASURING; TESTING
- G01N—INVESTIGATING OR ANALYSING MATERIALS BY DETERMINING THEIR CHEMICAL OR PHYSICAL PROPERTIES
- G01N21/00—Investigating or analysing materials by the use of optical means, i.e. using sub-millimetre waves, infrared, visible or ultraviolet light
- G01N21/17—Systems in which incident light is modified in accordance with the properties of the material investigated
- G01N21/25—Colour; Spectral properties, i.e. comparison of effect of material on the light at two or more different wavelengths or wavelength bands
- G01N21/31—Investigating relative effect of material at wavelengths characteristic of specific elements or molecules, e.g. atomic absorption spectrometry
Definitions
- This invention relates to spectrophotometry and the spectrophotometric analysis of blood samples.
- this invention relates to a method and apparatus for providing a non-destructive pre-test screen of specimen integrity for a blood analyzer by measurement of absorbance or reflectance.
- Haemoglobin (Hb), bilirubin (Bili) and light-scattering substances like lipid particles are typical substances which will interfere with, and affect spectrophotometric and other blood analytical measurements. Such substances are referred to as interferents. Elevated Bili can be due to disease states, and increased lipid particles in the blood, also known as hyperlipidemia, can be due to disease states and dietary conditions. Elevated Hb in the blood, hemoglobinemia, can be due to disease states and as a result of specimen handling. Clinical laboratories currently emphasize these three potential interferents as being of greatest concern with respect to affecting blood analysis. Biliverdin, (BV), a fourth potential interferent, is rarely mentioned.
- BV Biliverdin, a fourth potential interferent
- BV is the precursor of Bili, and if Bili becomes oxidized, it will revert to BV.
- BV and Bili are two of a class of compounds referred to as bile pigments.
- BV is not normally present in serum, but regularly accompanies Bili in the serum of patients with carcinomatous obstruction of the bile duct, and is frequently found in the blood of patients with liver cirrhosis, and bile duct occlusion by gallstones.
- Bili Upon visual inspection, Bili gives a yellow or orange colour to serum and 10 plasma and is considered to be the major bile pigment in serum or plasma. Bili is sometimes described as a greenish/yellow pigment (Guyton, A. C. and Hall, J. E., Textbook of Medical Physiology, 1996, page 886). However, it is likely BV, rather than Bili, that is responsible for the greenish colour. In fact, these specimens may, nevertheless, have acceptable levels of Bili. A yellow colour chart is available for visual grading of Bili levels in serum or plasma, but there is no known colour chart for green bile pigment or BV. Visual inspection may still provide any opportunity for rejection of green specimens, however, for automated systems, no method exists for screening serum or plasma specimens for increased blood levels of BV, also known as hyperbiliverdinemia.
- Specimen integrity is an essential part of quality assurance as it directly affects the accuracy of test results.
- the presence of interferents in a plasma or serum sample compromises specimen integrity.
- Spectrophotometric measurement uses infrared (IR) or near infrared radiation (NIR) to assess the concentration of various constituents in a blood sample. Examples of photometric measurements using containers which hold a blood sample are disclosed in U.S. Pat. Nos. 5,291,884; 5,288,646; 5,066,859; and 5,366,903.
- IR infrared
- NIR near infrared radiation
- U.S. Pat. No. 5,366,903 discloses a sampling device which allows photometric quantitative determination of an analyte in whole blood.
- the device overcomes the problems of having blood cells in a blood sample by effectively “squeezing out” red blood cells and providing a small volume of sample, free of red blood cell material, from which particular analytes can be measured.
- photometric methodology include non-invasive determinations of analyte concentrations such as described in U.S. Pat. Nos. 5,360,004; 5,353,790; and 5,351,685.
- none of these documents discloses a method of measuring interferents in the plasma or serum of a blood sample, in order to assess specimen integrity for further analysis.
- a sample of plasma or serum is normally transferred from an original or primary tube or container to a secondary tube or container.
- These secondary tubes are amber coloured to protect photo sensitive constituents. The amber colouring makes visual inspection virtually impossible. On occasion, labels cover portions of the tube further restricting a full visual examination.
- Pre-test screening of specimens by visual inspection is semi-quantitative at best, and highly subjective and may not provide sufficient quality assurance as required for some tests.
- spectral data is used in a novel way so as to determine if the specimen which is presented for such analysis in a primary container contains interferents and if so, to what extent.
- an apparatus and a method for determining blood specimen integrity of a specimen contained in a primary container using a spectrophotometer to irradiate and measure radiation from the specimen using a spectrophotometer to irradiate and measure radiation from the specimen.
- an apparatus and a method for determining blood specimen integrity where a primary sample tube containing a specimen has a sample identification label on the exterior surface of the sample tube, by using a spectrophotometer to irradiate and measure radiation from the specimen.
- an apparatus and a method for determining blood specimen integrity of a specimen contained in a primary container where light is transmitted through the label, container and specimen.
- an apparatus and a method for determining blood specimen integrity of a specimen contained in a primary container where the light is reflected from the backside of a label after penetrating the specimen and container through an unlabelled section of the container.
- specimen integrity of a specimen contained in a primary container is assessed by measuring:
- Bilirubin concentration as an assessment of bilirubinemia
- Bile pigments may be measured in accordance with the method and apparatus of the present invention.
- Hb concentration is determined by measurement of absorption of different wavelengths of light in serum or plasma specimens which are then compared with values obtained through calibration using reference measurements for haemoglobin in serum or plasma specimens.
- Bili and/or BV_concentration is determined by measurement of absorption of different wavelengths of light in serum or plasma specimens which are then compared with values obtained through calibration using reference measurements for Bili and/or BV in serum or plasma samples.
- Turbidity is determined by measurement of absorption of different wavelengths of light in serum or plasma specimens which are then compared with values obtained through calibration using serum samples spiked with known amounts of intralipid (IL).
- IL intralipid
- Intralipid is a fat emulsion in water which is similar to naturally-occurring chylomicrons and is used to simulate turbidity. On the basis of the results from measurements of any one or more of these interferents at a time, in comparison with reference measurements of various levels of interferents, a decision is made concerning whether to reject or accept the sample.
- Hb concentration is determined by measurement of reflectance of different wavelengths of light in serum or plasma specimens which are then compared with values obtained through calibration using reference measurements for haemoglobin in serum or plasma samples.
- Turbidity is determined by measurement of reflectance of different wavelengths of light in serum or plasma specimens which are then compared with values obtained through calibration using serum samples spiked with known amounts of intralipid (IL).
- Bili and/or BV concentration is determined by measurement of reflectance of different wavelengths of light in serum or plasma specimens which are then compared with values obtained through calibration using reference measurements for Bili and/or BV in serum or plasma samples. On the basis of the results from measurement of any one or more of these interferents at a time, _in comparison with reference measurements of various levels of interferents, a decision is made concerning whether to reject or accept the sample.
- the present invention provides an apparatus for determining specimen integrity of a specimen contained in a primary container
- the apparatus comprises: a housing for receiving a sample; a radiation source; a sensor; a means for optically connecting the radiation source with the sensor along a sample path through the housing and along a reference path which by-passes the sample; a means for selectively passing a beam from the sample path and from the reference path to the sensor; and a means for correlating a sensor response, from the sample path relative to a sensor response from the reference path, to a quantity of a known substance in said sample.
- the housing has a cavity for receiving a sample and a lid for selectively opening and closing the cavity.
- the radiation source is for emitting a beam of radiation, and the sensor is responsive to receipt of radiation.
- the present invention provides an apparatus for determining specimen integrity of a of a specimen contained in a primary container where the apparatus comprises a housing which contains a cavity for receiving a sample and a lid for selectively opening and closing said cavity. It is understood that any means for excluding from the sample, light other than that from the radiation source of the apparatus, is within the scope of this invention. Also, if dark current, i.e., sensor response when sensor is not exposed to the instrument light, is subtracted from both the reference and sample measurements, the room light impinging on the detector can be effectively subtracted without affecting the instrument performance significantly.
- the apparatus further comprises a quartz-tungsten-halogen bulb capable of emitting a near infrared, and adjacent visible region light beam having wavelengths from 475 nm to 1080 nm and a beam splitter for splitting the light beam from the quartz-tungsten-halogen bulb into a sample path beam for travel along a sample path and a reference path beam for travel along a reference path.
- This apparatus further comprises a shutter for selectively blocking the sample path light beam which travels along the sample path and the reference path light beam which travels along the reference path, as well as optical fibre bundles for transmitting the sample path light beam through a sample enclosed in the housing, and optical fibre bundles for transmitting the sample path light beam from the sample to a beam combiner.
- the beam combiner combines the beam from the sample path and the beam from the reference path into a combined beam.
- the combined beam of this apparatus is then passed onto a sensor.
- This apparatus further comprises a series of mirrors along the reference path and the sample path to optically connect the near infrared, and adjacent visible region light source with the sensor, and a grating for dispersing the combined beam into component wavelengths which are passed onto the sensor.
- the sensor of this apparatus is a photodiode array comprised of a plurality of pixels wherein each of the pixels is set to measure one of a plurality of predetermined light frequencies. Based on the measurement of the frequencies, the sensor generates a plurality of signals wherein each of the signals is responsive to an amount of radiation received by each of the pixels.
- This apparatus further comprises an analog-to-digital converter to generate digital information from the plurality of signals and a microprocessor, which is connected to the convertor, to correlate the digital information to a quantity of a known substance in the sample.
- the apparatus provides a means for determining specimen integrity of a of a specimen contained in a primary container by determining the concentrations of a known substance which is selected from a group comprising haemoglobin, bilirubin, _biliverdin and intralipid.
- a method for determining serum and plasma specimen integrity of a specimen contained in a primary container comprises the following steps. First, transmitting a beam of radiation along a sample path through a sample and along a reference path by-passing the sample. Next, selectively receiving the beam of radiation from the sample path and the reference path, and analyzing the received beams of radiation from the sample path and from the reference path for an amplitude of at least one predetermined light frequency. Finally, correlating the amplitude of the at least one predetermined light frequency with a quantity of a known substance.
- a method for determining serum and plasma specimen integrity of a specimen contained in a primary container wherein the method allows for the determination of the concentrations of a known substance which is selected from a group comprising haemoglobin, bilirubin, biliverdin and intralipid.
- a method whereby the method for determining serum and plasma specimen integrity of the present invention is carried out on one apparatus of the present invention and a second apparatus is used, based on the calibrations of the first apparatus to provide accurate determinations of interferents on the second apparatus, without calibration of the second apparatus.
- specimen integrity may be determined on a variety of primary specimen container types without recalibration of the apparatus in use to determine interferent concentration and type.
- container types include pipette tips, PVC tubing, as well as tubes, cuvettes, syringe barrels all made of plastic or glass materials.
- a method for rejecting a sample contained in a sample container from further clinical assay based on determining the concentration of at least one interferent in the sample comprises the steps of:
- Yet another aspect of the present invention provides a method for rejecting a plasma sample contained in a sample container from further clinical assay based on determining the concentration of at least one interferent in the sample, where the method comprises the steps of:
- correlating absorbance of the radiation by the plasma sample with a standard for the interferent(s) to determine the concentration of the interferent(s) including calculating the first derivatives of at least two portions of a spectrum generated from a scan for a particular interferent which are used in an algorithm in respect of the interferent(s) to calculate the particular interferent(s) concentration(s); and
- said algorithm(s) in respect of hemoglobin, bilirubin and intralipids are, respectively:
- Another aspect of the present invention features a method for rejecting a sample contained in a sample container from further clinical assay based on determining the concentration of at least one interferent in the sample, where the method comprises the steps of:
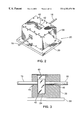
- FIG. 1 is a perspective view of a system incorporating an apparatus of the present invention for analyzing specimen integrity
- FIG. 2 is a perspective view illustrating the sample head of the apparatus of FIG. 1;
- FIG. 3 is a sectional view illustrating the sample head of the apparatus of FIG. 1;
- FIG. 4 is a schematic representation of elements of the apparatus of FIG. 1;
- FIG. 5 is a graphic representation of a linear regression fit of data for haemoglobin calibration in units of grams per liter on the abscissa and ordinant axes;
- FIG. 6 is a graphic representation of a linear regression fit of data for total bilirubin calculation in units of micromoles per liter on the abscissa and ordinant axes;
- FIG. 7 is a graphic representation of a linear regression fit of data for turbidity calibration in terms of intralipid concentration in units of grams per liter on the abscissa and ordinant axes;
- FIG. 8 is a graphic representation of a linear regression fit of data in respect of predicted unadjusted and predicted adjusted haemoglobin concentration for sample measured on a different instrument
- FIG. 9 is a graphic representation of a linear regression fit of data in respect of predicted unadjusted and predicted adjusted intralipid concentration for sample measured on a different instrument
- FIG. 10 is a graphic representation of a linear regression fit of data in respect of predicted unadjusted and predicted adjusted biliverdin concentration for sample measured on a different instrument
- FIG. 11 is a graphic representation of a linear regression fit of data for predicted unadjusted and predicted adjusted haemoglobin concentration for sample in a different container type
- FIG. 12 is a graphic representation of a linear regression fit of data for predicted unadjusted and predicted adjusted intralipid concentration for sample in a different container type.
- FIG. 13 is a graphic representation of a linear regression fit of data for predicted unadjusted and predicted adjusted biliverdin concentration for sample in a different container type.
- FIG. 1 A system incorporating the apparatus of the present invention is generally illustrated in FIG. 1 .
- the apparatus 10 generally comprises a spectrophotometer 12 optically coupled to, or communicating with a sample head or sample holder 20 through fibre optic bundles 16 , 18 .
- Apparatus 10 is mounted or installed adjacent to an automated conveyor 22 which carries a plurality of sample tubes 24 .
- a robotic arm 26 is installed to transport a primary specimen tube 24 between the conveyor 22 and the specimen head 20 . It is understood that other conveyor transport mechanisms could be employed and are within the scope of the present invention.
- the input and output fibre optic bundles 16 , 18 can be configured to advance toward the serum or plasma specimen container on the conveyer line thereby eliminating the use of a robotic arm to move the specimen container.
- any means by which the input and output fibre optic bundles are brought into alignment for measurement of absorption or reflectance in a specimen container is within scope of the present invention.
- the fibres optic bundles 16 , 18 which traffic radiation to and from the sample, respectively, allow the bulk of the instrumentation to be placed remotely from the specimens.
- Sample head 20 comprises a canister 38 having a lid 40 preferably mounted for sliding back and forth to open and close cavity 42 .
- Canister 38 is mounted on a platform 39 for support.
- Fibre optic bundle 16 extends through a bore 44 in a wall of canister 38 such that the end of fibre optic bundle 16 communicates with cavity 42 to transmit radiation therein.
- fibre optic bundle 18 extends through a bore 46 in a wall of canister 38 opposite to fibre optic bundle 16 . Fibre optic bundle 18 communicates with cavity 42 to receive radiation impinging upon the portion of fibre optic bundle 18 which communicates with cavity 42 .
- the radiation is channelled through an optical fibre bundle 16 to the serum or plasma specimen in a labelled primary or secondary tube 24 , and the radiation transmitted through the tube, label and specimen, is received by fibre optic bundle 18 which returns the collected radiation to the spectrophotometer 12 .
- spectrophotometer 12 has a light source 28 .
- the light source is a quartz-tungsten-halogen 50 watt lamp.
- the light source is preferably powered by a stabilized alternating current supply.
- a direct current power supply may also be used depending upon the location or requirements.
- the spectral output from light source 28 is broadband covering the visible and NIR regions.
- the beam of radiation from light source 28 is directed through a first collimating lens 58 then through a band-pass filter 30 to reduce unwanted radiation outside of 450-1080 nm and through a shape-filter 32 to “flatten” the system optical response.
- This radiation is passed through a first focussing lens 59 and the beam of radiation then proceeds through a beam splitter 34 , which in a preferred embodiment is a BK7 glass window.
- a portion of the beam of radiation is directed along a sample path through the fibre optic bundle 16 , through the sample contained within tube 24 and back through optic fibre bundle 18 .
- Another portion of radiation is directed along a reference path through a second collimating lens 58 then through a neutral density filter 48 , by-passing the sample.
- Mirrors 36 direct the two portions of the beams of radiation along respective paths.
- a beam shutter 50 selects which of the beams of radiation are to be passed.
- a lamp shutter 56 turns the optical radiation arriving from the beam combiner 54 “on” or “off” to a sensor or a linear photodiode array (PDA) 52 .
- a dispersing element or grating 60 separates out the component wavelengths. In a preferred embodiment dichromated gelatin is used as the grating material.
- Various lenses 58 serve to collimate, while various lenses 59 serve to focus the spectral output at several points along the respective paths.
- the returning radiation beam is transmitted from the sample path to the spectrophotometer, and about 11% from the reference is reflected and directed into the spectrometer.
- Spectrophotometer 12 is preferably a dual beam spectrophotometer with a fixed integration time for the reference beam and a choice of integration time for the sample beam.
- the beams of radiation are focused by lenses 58 onto the PDA 52 .
- Each element or pixel of the PDA is set to receive and collect a predetermined wavelength.
- the PDA 52 comprises 256 pixels. The pixels are rectangular shaped to optimize the amount of optical radiation detected.
- each pixel or wavelength portion is measured approximately simultaneously during a particular scan.
- the optical radiation falling on each sensor element is integrated for a specified time and the individual pixels, or wavelengths are sampled sequentially by a 16 bit analog-to-digital convertor or ADC.
- a filter-wheel system may be used.
- each analyte uses from one to four wavelengths or pixels.
- the first derivative of absorbance with respect to measurements with the PDA is the difference between the absorbance at two adjacent pixels
- the first derivative of absorbance at one wavelength with a filter-wheel system will require the absorbance measured with two different narrow band-pass filters.
- the filters do not need to be assembled on a rotating wheel, but that any structure which achieves the result of a narrow band-pass filtration of absorbed radiation is within the scope of the present invention.
- the near infra-red region of the electromagnetic spectrum is generally considered to be the interval extending from 650 nm through to 2,700 nm
- the nominal wavelength range of a preferred embodiment is from 450 nm to 1,080 nm, which is referred to herein as the “near infrared and adjacent visible region”.
- Transmission is preferred over reflectance because there is little variation in absorbance due to the tubes in which the serum or plasma specimens reside or due to any labels on the tubes and as such do not significantly affect transmission results.
- determination of the concentration of interferents using reflectance is within the scope of this invention.
- the variation in apparent absorbance due to markings on the labels can be handled effectively by using the first derivative of the absorbance when the amount transmitted is measured.
- the PDA integrates the optical radiation over a specified time and converts the optical signal to a time multiplexed analog electronic signal called a scan where absorbance is calculated as:
- Reference i reference pixel i readings
- Sample measure i sample measurement pixel i reading
- ITS Integration time for sample measurements
- ITR Integration time for reference measurements
- i the particular pixel in the PDA.
- absorbance can also equal
- the electronic signal is proportional to the time that the sensor integrates the optical signal.
- the electronic signal is amplified by analog electronic amplifiers and converted to a digital signal by an analog-to-digital converter or ADC 61 .
- the digital information from the converter 61 is interpreted for data analysis by a microprocessor or MP 62 which is in turn connected via an RS232 connector to a computer 64 or COMP.
- the results of the data analysis can be shown oil an output device (OD) 66 such as a display and on a printer.
- OD output device
- a user can control the device to specify a particular interferent to be analyzed and to determine the number and timing of measurements.
- the present invention allows for rapid pre-screening of samples by taking successive sample measurements at intervals of 5 seconds for all 4 interferents.
- a robot arm 26 will remove successive samples from a conveyor line 22 for measurement. Samples removed from the conveyor line 22 are inserted into a canister 38 with a lid 40 which is closed to shield the sample from extraneous light. The sample is then measured; the sample holder 20 opened; the sample is placed according to the controlling process which may include acceptance or rejection of the, sample for further analysis; and another sample is picked up by the robotic arm and placed into the sample holder to allow for another measurement. This set of operations takes 5 seconds.
- the controlling process includes flagging any assays run on a clinical analyser using samples from the containers measured according to the method of the present invention if the results of the measurements in the primary containers exceed predetermined thresholds for any of the interferents measured.
- the integration time for the sample beam is low for clear sample since there is less scattered light and therefore more light is transmitted to the detector 52 .
- the spectrophotometer 12 will automatically switch to a higher integration time.
- the higher integration time chosen will be within a pre-selected range, such that the detector's response is optimal. This feature will allow all samples, from the clearest to the most turbid, to be efficiently screened without exceeding the linear response range of the detector.
- the integration time for said sample beam is low for clear samples and is automatically switched to a higher integration time for turbid samples.
- measurements can be taken where the sample is contained in a sample tube which carries a sample identification, or similar type of label.
- this invention can be used with all varieties of sample tubes used in the blood collection and analysis field.
- the spectrophotometer in use can be calibrated using one sample tube type and measurements for determining the concentrations of interferents of a sample in a different container type, such as a pipette tip, may be carried out without recalibration of the spectrophotometer.
- the first part of the process for generating a calibration curve is to store spectral data for the calibration set.
- the calibration algorithm for each interferent must be installed in a microprocessor so that when an unknown sample is tested for a particular interferent the result is quickly produced.
- any one of several different methods may be used.
- One approach would be to use multiple linear regression and choose wavelengths using standard procedures and statistics to find optimal wavelengths at which to describe concentrations of interferents.
- significant changes in the spectrum brought about by lipemia influence the outcome of calculations for haemoglobin or for bilirubin, or biliverdin, and consequently it is necessary to select additional wavelengths to compensate for these interactions. Nevertheless, this is not a preferred approach.
- Another method which may be employed is to use all of the spectrum, and perform either a principal component analysis or partial least squares analysis and effectively determine from the components that are optimised the concentration of these different elements.
- a disadvantage of using either of these methods is that they are computationally intensive and consequently take more time to calculate and increase the length of time required to assess each sample.
- a preferred method is to calculate the first derivative of certain portions of the spectra in respect of the particular interferent being measured. It is also possible to calculate the second, or third derivatives, and such calculations are within the scope of this invention. However, each step of taking differences to calculate those derivatives is more time consuming and introduces more noise.
- the correlating includes calculating the first derivatives of at least two portions of a spectrum generated from a scan for a particular interferent which are used in an algorithm in respect of the interferent(s) to calculate the particular interferent(s) concentration(s); wherein the first derivative of absorbance is used to correlate said quantity of interferent.
- Hb optimal results may be obtained by calculating the first derivative of measurements at wavelengths of approximately 603 nm, 679 nm and 1044 nm.
- X in the regression analysis is replaced with ln(1+X) where X is g/L of Hb.
- X is g/L of Hb.
- lipemic or turbid samples measurements are taken at wavelengths in the region of about 975 nm which is a water peak. 975 nm is chosen because significant absorbances due to Hb, Bili and BV do not occur in this region.
- the transformation of X to ln (1+X) is not necessary for all sample containers as demonstrated below by the second calibration algorithm for Hb.
- turbidity may be simulated by adding IL tb clear serum or plasma; IL is an emulsion of fat particles similar to naturally-occurring chylomicrons.
- results may be obtained by using the raw absorbance measurements at a wavelength of approximately 975 nm.
- the subsequent discussion deals with the raw absorbance measurement it is understood that the first derivative of the measurement at this wavelength may be used and is within the scope of the present invention. This is illustrated in the present disclosure where the first derivative of the measurement is used in respect of the IL data presented in Table 1 and Table 2.
- the first derivative of absorbance is preferred because any markings on a label or a dirty label will result in over estimation of turbidity if the raw absorbance is used for the calculation. Markings or a dirty label on a container wall will diminish the light transmitted to the detector, and will result in an increase in the calculated absorbance.
- X is replaced by In X where X is g/L of IL. This InX transformation of X is necessary when raw absorbance is used, but is not necessary when the first derivative of raw absorbance is used.
- the calibration equations outlined below cover the broad range of variability anticipated for the interferents. If low-end accuracy becomes a concern, separate calibrations can be developed: one for the high end, and a second, if the result predicted by the previous calibration is less than a predetermined level.
- the Hb was prepared by removing the plasma and lysing the erythrocytes with an equal volume of lysing reagent. The Hb content of the lysates was measured on a Coulter-STKSTM. Five atypical Hbs were included in the sample set. Immediately after the samples were prepared, they were run on a spectrophotometer in different labelled tubes, and the spectra stored on diskettes. The analysis on a sample set of 115 was performed by a statistical computer program and an algorithm developed for Hb.
- FIG. 5 is a graphic representation of the results of a linear regression fit of the data generated from the Hb calibration.
- the algorithm which was developed for Hb based on this data is as follows:
- ⁇ moles/L Bili ⁇ 3601(641 nm)+3415(662 nm)+12710(731 nm) ⁇ 8214(763 nm) ⁇ 120
- the method described above is one wherein the frequencies of radiation are 603 nm, 679 nm and 1044 nm all of which are used to correlate to quantities of hemoglobin; 641 nm, 662 nm, 731 nm, and 763 nm all of which are used to correlate to quantities of bilirubin; and 975 nm which is used to correlate to quantities of intralipids.
- the correction adjustment consists of calculating the slope and intercept from a small set of samples with known concentrations wherein the actual or known concentrations of interferents are plotted on the X axis and the predicted concentrations are plotted on the Y axis.
- the “predicted concentrations” are obtained by measurement of the known concentrations with the second spectrophotometer and calculation of the predicted concentrations using the respective algorithms from the first spectrophotometer.
- the expression “small sample set slope” refers to the slope obtained from this same plot.
- the predicted values as obtained by the second spectrophotometer in respect of samples with unknown concentrations of interferents are then submitted to the following adjustments: the intercept value obtained from a plot of actual versus predicted concentrations, referred to above, is subtracted from the predicted measurement and the result of this subtraction is then divided by the slope obtained of the plot of the actual versus predicted referred to above.
- Table 1 An application of the method provided the results presented in Table 1.
- the Table contains data from samples with known concentrations of haemoglobin, intralipid, and biliverdin and provides “predicted” and “corrected predicted” results from samples measured in a spectrophotometer other than the first spectrophotometer using the calibration set obtained using the first spectrophotometer.
- the calibration algorithms were developed using the first (a different) spectrophotometer.
- FIGS. 8, 9 , and 10 illustrate the regression analysis with respect to the data obtained and provided in Table 1.
- a similar correction to the predicted concentration of interferents can be made when an instrument is calibrated using sample containers of a first type, for example, hard translucent plastic such as a pipette tip made of polypropylene and predicting on the same instrument using sample containers of a second type, for example, soft translucent plastics such as PVC tubing with markings on the surface.
- a first type for example, hard translucent plastic such as a pipette tip made of polypropylene
- sample containers of a second type for example, soft translucent plastics such as PVC tubing with markings on the surface.
- calibration of a spectrophotometer for samples in one container type can be transferred to a second spectrophotometer and, on samples in a different container type by making similar adjustments to the predicted results as set out above.
- Table 2 provides data from samples measured in EktachemTM pipette tips made from polypropylene with known concentrations of haemoglobin, intralipid, and biliverdin.
- Table 2 also provides results using the above calibration set from the pipette tips on the same spectrophotometer for samples contained in PVC tubing with markings on the surface.
- the algorithms developed with the pipette tips are used on the raw data derived from measurements of samples in the PVC tubing to provide a small sample set from which the slope and intercept are obtained.
- the correction adjustment then consists of calculating the slope (“small sample set slope”) and intercept (“small sample set intercept”) from a small sample set of known concentrations wherein the actual or known concentrations of interferents are plotted on the X axis and the predicted concentrations of these known concentrations are plotted on the Y axis.
Abstract
Description

| TABLE 1 | ||||||
| Hemoglobin (g/L) | Intralipid (g/L) | Biliverdin (mg/dL) | ||||
| Sample # | Known | Unadjusted | Adjusted | Known | Unadjusted | Adjusted | Known | Unadjusted | Adjusted |
| 1 | 6.64 | 7.01 | 6.44 | 2.15 | 4.32 | 1.93 | 3.57 | 4.58 | 3.89 |
| 2 | 1.06 | 0.20 | 0.66 | 3.19 | 5.96 | 3.49 | 5.30 | 5.86 | 5.20 |
| 3 | 1.79 | 1.42 | 1.69 | 1.56 | 3.78 | 1.42 | 3.33 | 3.66 | 2.94 |
| 4 | 2.07 | 1.90 | 2.10 | 1.15 | 2.96 | 0.64 | 1.15 | 1.75 | 0.99 |
| 5 | 7.60 | 8.22 | 7.46 | 3.04 | 5.63 | 3.18 | 2.21 | 2.98 | 2.25 |
| 6 | 2.39 | 2.38 | 2.50 | 3.04 | 5.23 | 2.80 | 1.80 | 2.48 | 1.74 |
| 7 | 6.30 | 6.96 | 6.40 | 3.54 | 5.98 | 3.51 | 1.31 | 2.13 | 1.38 |
| 8 | 2.81 | 2.89 | 2.94 | 2.60 | 4.73 | 2.33 | 2.16 | 2.91 | 2.18 |
| 9 | 6.98 | 7.61 | 6.95 | 1.55 | 4.84 | 2.43 | 4.50 | 5.67 | 5.01 |
| 10 | 3.75 | 4.42 | 4.24 | 0.83 | 3.26 | 0.93 | 6.23 | 6.61 | 5.98 |
| TABLE 2 | ||||
| Hemoglobin (g/L) | Intralipid (g/L) | Biliverdin (mg/dL) | ||
| Sample # | Known | Unadjusted | Adjusted | Known | Unadjusted | Adjusted | Known | Unadjusted | Adjusted |
| 1 | 0 | −0.23 | −0.21 | 5.96 | 3.35 | 5.23 | 2.47 | 0.69 | 2.02 |
| 2 | 0.55 | 0.22 | 0.49 | 2.65 | 1.73 | 2.55 | 4.41 | 1.76 | 4.25 |
| 3 | 0.83 | 0.47 | 0.87 | 4.44 | 3.07 | 4.76 | 0.74 | 0.01 | 0.60 |
| 4 | 1.15 | 0.60 | 1.07 | 0.93 | 0.44 | 0.40 | 3.07 | 1.43 | 3.55 |
| 5 | 1.58 | 1.04 | 1.75 | 3.83 | 2.74 | 4.22 | 3.89 | 1.52 | 3.75 |
| 6 | 2.94 | 1.94 | 3.13 | 3.66 | 2.71 | 4.17 | 1.43 | 0.40 | 1.43 |
| 7 | 3.1 | 2.09 | 3.35 | 2.08 | 1.57 | 2.27 | 6.23 | 2.89 | 6.59 |
| 8 | 3.92 | 2.58 | 4.10 | 1.27 | 0.94 | 1.22 | 5.60 | 2.42 | 5.62 |
| 9 | 4.29 | 2.63 | 4.18 | 2.81 | 1.95 | 2.90 | 0.72 | 0.25 | 1.11 |
| 10 | 4.71 | 2.84 | 4.51 | 2.80 | 1.79 | 2.64 | 5.64 | 2.33 | 5.42 |
| 11 | 5.17 | 3.27 | 5.17 | 1.67 | 1.12 | 1.52 | 4.15 | 1.66 | 4.05 |
| 12 | 5.39 | 3.31 | 5.23 | 5.14 | 3.13 | 4.87 | 1.64 | 0.37 | 1.36 |
| 13 | 6.12 | 3.82 | 6.00 | 0.62 | 0.51 | 0.51 | 5.47 | 2.30 | 5.38 |
| 14 | 6.86 | 4.46 | 6.99 | 3.16 | 2.46 | 3.76 | 2.95 | 1.29 | 3.28 |
Claims (15)
Priority Applications (1)
| Application Number | Priority Date | Filing Date | Title |
|---|---|---|---|
| US08/871,606 US6353471B1 (en) | 1995-10-10 | 1997-06-09 | Method and apparatus for non-destructive screening of specimen integrity |
Applications Claiming Priority (2)
| Application Number | Priority Date | Filing Date | Title |
|---|---|---|---|
| US54139095A | 1995-10-10 | 1995-10-10 | |
| US08/871,606 US6353471B1 (en) | 1995-10-10 | 1997-06-09 | Method and apparatus for non-destructive screening of specimen integrity |
Related Parent Applications (1)
| Application Number | Title | Priority Date | Filing Date |
|---|---|---|---|
| US54139095A Continuation-In-Part | 1995-10-10 | 1995-10-10 |
Publications (1)
| Publication Number | Publication Date |
|---|---|
| US6353471B1 true US6353471B1 (en) | 2002-03-05 |
Family
ID=24159394
Family Applications (1)
| Application Number | Title | Priority Date | Filing Date |
|---|---|---|---|
| US08/871,606 Expired - Lifetime US6353471B1 (en) | 1995-10-10 | 1997-06-09 | Method and apparatus for non-destructive screening of specimen integrity |
Country Status (1)
| Country | Link |
|---|---|
| US (1) | US6353471B1 (en) |
Cited By (37)
| Publication number | Priority date | Publication date | Assignee | Title |
|---|---|---|---|---|
| US20030027341A1 (en) * | 1996-06-12 | 2003-02-06 | James Samsoondar | Quality control material for reagentless measurement of analytes |
| US20040011961A1 (en) * | 2002-07-22 | 2004-01-22 | The Automation Partnership (Cambridge) Ltd A British Company Of York Way | IR analysis system |
| US20040092803A1 (en) * | 2002-10-25 | 2004-05-13 | Hormoz Azizian | Method of in-vivo measurement of fat content of a body and apparatus therefor |
| WO2006040387A1 (en) * | 2004-10-11 | 2006-04-20 | Thermo Fisher Scientific Oy | Method for automatically detecting factors that disturb analysis by a photometer |
| US20060275906A1 (en) * | 2005-06-03 | 2006-12-07 | Devlin William J Sr | Method for ascertaining interferents in small liquid samples in an automated clinical analyzer |
| WO2007028233A1 (en) | 2005-09-06 | 2007-03-15 | Nir Diagnostics Inc. | Method and apparatus for measuring analytes |
| US20070110621A1 (en) * | 2005-09-06 | 2007-05-17 | Macintyre Duncan | Method and apparatus for measuring analytes |
| WO2007056869A1 (en) | 2005-11-21 | 2007-05-24 | Nir Diagnostics Inc. | Modified method and apparatus for measuring analytes |
| EP1840555A1 (en) * | 2006-03-30 | 2007-10-03 | Sysmex Corporation | Sample analyzer and sample analyzing method |
| US20070291250A1 (en) * | 2006-06-20 | 2007-12-20 | Lacourt Michael W | Solid control and/or calibration element for use in a diagnostic analyzer |
| US20080044912A1 (en) * | 2006-08-18 | 2008-02-21 | Sysmex Corporation | Blood coagulation analyzer and blood coagulation analyzing method |
| US20080070318A1 (en) * | 2005-03-29 | 2008-03-20 | Sysmex Corporation | Method of specimen analysis and specimen analyzer |
| US20080144005A1 (en) * | 2006-12-19 | 2008-06-19 | Cytyc Corporation | Method for analyzing blood content of cytological specimens |
| US20090051898A1 (en) * | 2007-08-24 | 2009-02-26 | Samsung Electronics Co., Ltd. | Non-invasive probe for measuring body components and a non-invasive body component measurement system including the non-invasive probe |
| US20100161097A1 (en) * | 2008-12-18 | 2010-06-24 | Siemens Aktiengesellschaft | Method and system for managing results of an analysis process on objects handled along a technical process line |
| US20100174491A1 (en) * | 2009-01-08 | 2010-07-08 | Samsung Electronics Co., Ltd. | Methods of measuring concentration of component in biochemical sample and estimating reliability of test result |
| WO2011019576A1 (en) | 2009-08-13 | 2011-02-17 | Siemens Healthcare Diagnostics Inc. | Methods and apparatus for ascertaining interferents and physical dimensions in liquid samples and containers to be analyzed by a clinical analyzer |
| US9028756B2 (en) | 2005-03-29 | 2015-05-12 | Sysmex Corporation | Specimen analyzing method and specimen analyzing apparatus |
| US20160349237A1 (en) * | 2014-02-19 | 2016-12-01 | Roche Diagnostics Operations, Inc. | Method and device for assigning a blood plasma sample |
| US9535053B1 (en) * | 2016-02-04 | 2017-01-03 | Nova Biomedical Corporation | Analyte system and method for determining hemoglobin parameters in whole blood |
| US9638686B1 (en) | 2016-02-04 | 2017-05-02 | Nova Biomedical Corporation | Analyte system and method for determining hemoglobin parameters in whole blood |
| US9933411B2 (en) | 2016-02-04 | 2018-04-03 | Nova Biomedical Corporation | Analyte system and method for determining hemoglobin parameters in whole blood |
| US10088468B2 (en) | 2016-02-04 | 2018-10-02 | Nova Biomedical Corporation | Analyte system and method for determining hemoglobin parameters in whole blood |
| US10088360B2 (en) | 2016-02-04 | 2018-10-02 | Nova Biomedical Corporation | Spectroscopic analyte system and method for determining hemoglobin parameters in whole blood |
| US10151630B2 (en) | 2016-02-04 | 2018-12-11 | Nova Biomedical Corporation | Analyte system and method for determining hemoglobin parameters in whole blood |
| WO2019027769A1 (en) | 2017-07-31 | 2019-02-07 | Siemens Healthcare Diagnostics Inc. | Methods and apparatus for imaging specimens and/or sample containers |
| US10337984B2 (en) | 2013-07-18 | 2019-07-02 | Nueon, Inc. | Spectroscopic measurements with parallel array detector |
| CN110520737A (en) * | 2017-04-13 | 2019-11-29 | 美国西门子医学诊断股份有限公司 | Method and apparatus for carrying out label compensation during sample characterizes |
| US10760965B2 (en) | 2016-03-21 | 2020-09-01 | Nueon Inc. | Porous mesh spectrometry methods and apparatus |
| US10928310B2 (en) | 2016-01-28 | 2021-02-23 | Siemens Healthcare Diagnostics Inc. | Methods and apparatus for imaging a specimen container and/or specimen using multiple exposures |
| US11060967B2 (en) | 2014-02-28 | 2021-07-13 | Nueon Inc. | Method and apparatus for determining markers of health by analysis of blood |
| US11073472B2 (en) | 2016-11-14 | 2021-07-27 | Siemens Healthcare Diagnostics Inc. | Methods and apparatus for characterizing a specimen using pattern illumination |
| US11333553B2 (en) | 2017-07-19 | 2022-05-17 | Siemens Healthcare Diagnostics Inc. | Methods and apparatus for specimen characterization using hyperspectral imaging |
| US11428574B2 (en) | 2015-04-14 | 2022-08-30 | Nueon Inc. | Method and apparatus for determining markers of health by analysis of blood |
| US11445953B2 (en) | 2016-11-04 | 2022-09-20 | Nueon Inc. | Combination blood lancet and analyzer |
| US11815519B2 (en) | 2017-07-19 | 2023-11-14 | Siemens Healthcare Diagnostics Inc. | Stray light compensating methods and apparatus for characterizing a specimen |
| US11815446B2 (en) | 2016-01-28 | 2023-11-14 | Siemens Healthcare Diagnostics Inc. | Methods and apparatus for characterizing a specimen container and specimen |
Citations (10)
| Publication number | Priority date | Publication date | Assignee | Title |
|---|---|---|---|---|
| US3702736A (en) * | 1971-06-18 | 1972-11-14 | John C Coggeshall | Spectrophotometer |
| CA2019511A1 (en) | 1989-06-21 | 1990-12-21 | Mark Ries Robinson | Method of and apparatus for determining the similarity of a biological analyte from known biological fluids |
| US5066859A (en) | 1990-05-18 | 1991-11-19 | Karkar Maurice N | Hematocrit and oxygen saturation blood analyzer |
| US5288646A (en) | 1988-12-22 | 1994-02-22 | Radiometer A/S | Method of photometric in vitro determination of the content of an analyte in a sample of whole blood |
| US5291884A (en) | 1991-02-07 | 1994-03-08 | Minnesota Mining And Manufacturing Company | Apparatus for measuring a blood parameter |
| US5351685A (en) | 1991-08-05 | 1994-10-04 | Nellcor Incorporated | Condensed oximeter system with noise reduction software |
| US5353790A (en) | 1992-01-17 | 1994-10-11 | Board Of Regents, The University Of Texas System | Method and apparatus for optical measurement of bilirubin in tissue |
| US5360004A (en) | 1992-12-09 | 1994-11-01 | Diasense, Inc. | Non-invasive determination of analyte concentration using non-continuous radiation |
| US5734468A (en) | 1995-08-18 | 1998-03-31 | Beckman Instruments, Inc. | Probe and method for determining serum indices of a serum sample |
| US5846492A (en) * | 1997-03-11 | 1998-12-08 | Johnson & Johnson Clinical Diagnostics, Inc. | Sample quality measurement and/or analyte measurement in the dispensing tip of an analyzer |
-
1997
- 1997-06-09 US US08/871,606 patent/US6353471B1/en not_active Expired - Lifetime
Patent Citations (11)
| Publication number | Priority date | Publication date | Assignee | Title |
|---|---|---|---|---|
| US3702736A (en) * | 1971-06-18 | 1972-11-14 | John C Coggeshall | Spectrophotometer |
| US5288646A (en) | 1988-12-22 | 1994-02-22 | Radiometer A/S | Method of photometric in vitro determination of the content of an analyte in a sample of whole blood |
| US5366903A (en) | 1988-12-22 | 1994-11-22 | Radiometer A/S | Method of photometric in vitro determination of the content of an analyte in a sample of whole blood |
| CA2019511A1 (en) | 1989-06-21 | 1990-12-21 | Mark Ries Robinson | Method of and apparatus for determining the similarity of a biological analyte from known biological fluids |
| US5066859A (en) | 1990-05-18 | 1991-11-19 | Karkar Maurice N | Hematocrit and oxygen saturation blood analyzer |
| US5291884A (en) | 1991-02-07 | 1994-03-08 | Minnesota Mining And Manufacturing Company | Apparatus for measuring a blood parameter |
| US5351685A (en) | 1991-08-05 | 1994-10-04 | Nellcor Incorporated | Condensed oximeter system with noise reduction software |
| US5353790A (en) | 1992-01-17 | 1994-10-11 | Board Of Regents, The University Of Texas System | Method and apparatus for optical measurement of bilirubin in tissue |
| US5360004A (en) | 1992-12-09 | 1994-11-01 | Diasense, Inc. | Non-invasive determination of analyte concentration using non-continuous radiation |
| US5734468A (en) | 1995-08-18 | 1998-03-31 | Beckman Instruments, Inc. | Probe and method for determining serum indices of a serum sample |
| US5846492A (en) * | 1997-03-11 | 1998-12-08 | Johnson & Johnson Clinical Diagnostics, Inc. | Sample quality measurement and/or analyte measurement in the dispensing tip of an analyzer |
Cited By (82)
| Publication number | Priority date | Publication date | Assignee | Title |
|---|---|---|---|---|
| US6689612B2 (en) * | 1996-06-12 | 2004-02-10 | Spectromedical Inc. | Indicator of hemolysis |
| US20030027341A1 (en) * | 1996-06-12 | 2003-02-06 | James Samsoondar | Quality control material for reagentless measurement of analytes |
| US20040011961A1 (en) * | 2002-07-22 | 2004-01-22 | The Automation Partnership (Cambridge) Ltd A British Company Of York Way | IR analysis system |
| US7711411B2 (en) | 2002-10-25 | 2010-05-04 | Nir Technologies Inc. | Method of in-vivo measurement of fat content of a body and apparatus therefor |
| US20040092803A1 (en) * | 2002-10-25 | 2004-05-13 | Hormoz Azizian | Method of in-vivo measurement of fat content of a body and apparatus therefor |
| US20090009750A1 (en) * | 2004-10-11 | 2009-01-08 | Henrik Johansson | Method for automatically detecting factors that disturb analysis by a photometer |
| WO2006040387A1 (en) * | 2004-10-11 | 2006-04-20 | Thermo Fisher Scientific Oy | Method for automatically detecting factors that disturb analysis by a photometer |
| US7663738B2 (en) | 2004-10-11 | 2010-02-16 | Thermo Fisher Scientific Oy | Method for automatically detecting factors that disturb analysis by a photometer |
| US10261016B2 (en) * | 2005-03-29 | 2019-04-16 | Sysmex Corporation | Specimen analyzing method and specimen analyzing apparatus |
| US20160195560A1 (en) * | 2005-03-29 | 2016-07-07 | Sysmex Corporation | Specimen analyzing method and specimen analyzing apparatus |
| US9316583B2 (en) | 2005-03-29 | 2016-04-19 | Sysmex Corporation | Specimen analyzing method and specimen analyzing apparatus |
| US9028756B2 (en) | 2005-03-29 | 2015-05-12 | Sysmex Corporation | Specimen analyzing method and specimen analyzing apparatus |
| US20080070318A1 (en) * | 2005-03-29 | 2008-03-20 | Sysmex Corporation | Method of specimen analysis and specimen analyzer |
| US7854891B2 (en) | 2005-03-29 | 2010-12-21 | Sysmex Corporation | Method of specimen analysis and specimen analyzer |
| US20060275906A1 (en) * | 2005-06-03 | 2006-12-07 | Devlin William J Sr | Method for ascertaining interferents in small liquid samples in an automated clinical analyzer |
| US8597208B2 (en) | 2005-09-06 | 2013-12-03 | Covidien Lp | Method and apparatus for measuring analytes |
| US8523785B2 (en) | 2005-09-06 | 2013-09-03 | Covidien Lp | Method and apparatus for measuring analytes |
| EP1928314A1 (en) * | 2005-09-06 | 2008-06-11 | NIR Diagnostics Inc. | Method and apparatus for measuring analytes |
| EP1931257A1 (en) * | 2005-09-06 | 2008-06-18 | NIR Diagnostics Inc. | Method and apparatus for measuring analytes |
| EP1931257A4 (en) * | 2005-09-06 | 2009-08-26 | Nir Diagnostics Inc | Method and apparatus for measuring analytes |
| US20070110621A1 (en) * | 2005-09-06 | 2007-05-17 | Macintyre Duncan | Method and apparatus for measuring analytes |
| WO2007028233A1 (en) | 2005-09-06 | 2007-03-15 | Nir Diagnostics Inc. | Method and apparatus for measuring analytes |
| US20090221886A1 (en) * | 2005-09-06 | 2009-09-03 | Nir Diagnostics, Inc. | Method and apparatus for measuring analytes |
| US20090168049A1 (en) * | 2005-09-06 | 2009-07-02 | Nir Diagnostics, Inc | Method and apparatus for measuring analytes |
| EP1928314A4 (en) * | 2005-09-06 | 2009-08-12 | Nir Diagnostics Inc | Method and apparatus for measuring analytes |
| EP1968447A1 (en) * | 2005-11-21 | 2008-09-17 | NIR Diagnostics Inc. | Modified method and apparatus for measuring analytes |
| WO2007056869A1 (en) | 2005-11-21 | 2007-05-24 | Nir Diagnostics Inc. | Modified method and apparatus for measuring analytes |
| US20070177130A1 (en) * | 2005-11-21 | 2007-08-02 | Macintyre Duncan | Modified method and apparatus for measuring analytes |
| EP1968447A4 (en) * | 2005-11-21 | 2009-09-02 | Nir Diagnostics Inc | Modified method and apparatus for measuring analytes |
| US7933005B2 (en) | 2005-11-21 | 2011-04-26 | Nir Diagnostics Inc. | Modified method and apparatus for measuring analytes |
| EP1840555A1 (en) * | 2006-03-30 | 2007-10-03 | Sysmex Corporation | Sample analyzer and sample analyzing method |
| US20070229830A1 (en) * | 2006-03-30 | 2007-10-04 | Sysmex Corporation | Sample analyzer and sample analyzing method |
| US8064061B2 (en) | 2006-03-30 | 2011-11-22 | Sysmex Corporation | Sample analyzer and sample analyzing method |
| US20070291250A1 (en) * | 2006-06-20 | 2007-12-20 | Lacourt Michael W | Solid control and/or calibration element for use in a diagnostic analyzer |
| EP1870697A2 (en) * | 2006-06-20 | 2007-12-26 | Ortho-Clinical Diagnostics, Inc. | Solid control and/or calibration element for use in a diagnostic analyzer |
| EP1870697A3 (en) * | 2006-06-20 | 2008-02-20 | Ortho-Clinical Diagnostics, Inc. | Solid control and/or calibration element for use in a diagnostic analyzer |
| US20080044912A1 (en) * | 2006-08-18 | 2008-02-21 | Sysmex Corporation | Blood coagulation analyzer and blood coagulation analyzing method |
| CN101126761B (en) * | 2006-08-18 | 2012-07-18 | 希森美康株式会社 | Blood coagulation analyzer and blood coagulation analyzing method |
| US10073078B2 (en) | 2006-08-18 | 2018-09-11 | Sysmex Corporation | Blood coagulation analyzer having a plurality of measurement sections |
| EP1890142A3 (en) * | 2006-08-18 | 2009-12-23 | Sysmex Corporation | Blood coagulation analyzer and blood coagulation analyzing method |
| US11262346B2 (en) | 2006-08-18 | 2022-03-01 | Sysmex Corporation | Blood coagulation analyzer having a plurality of light sources and a plurality of measurement sections |
| US20080144005A1 (en) * | 2006-12-19 | 2008-06-19 | Cytyc Corporation | Method for analyzing blood content of cytological specimens |
| US8107059B2 (en) * | 2007-08-24 | 2012-01-31 | Samsung Electronics Co., Ltd. | Non-invasive probe for measuring body components and a non-invasive body component measurement system including the non-invasive probe |
| US20090051898A1 (en) * | 2007-08-24 | 2009-02-26 | Samsung Electronics Co., Ltd. | Non-invasive probe for measuring body components and a non-invasive body component measurement system including the non-invasive probe |
| US20100161097A1 (en) * | 2008-12-18 | 2010-06-24 | Siemens Aktiengesellschaft | Method and system for managing results of an analysis process on objects handled along a technical process line |
| US9020624B2 (en) * | 2008-12-18 | 2015-04-28 | Siemens Aktiengesellschaft | Method and system for managing results of an analysis process on objects handled along a technical process line |
| US8380444B2 (en) | 2009-01-08 | 2013-02-19 | Samsung Electronics Co., Ltd. | Methods of measuring concentration of component in biochemical sample and estimating reliability of test result |
| US20100174491A1 (en) * | 2009-01-08 | 2010-07-08 | Samsung Electronics Co., Ltd. | Methods of measuring concentration of component in biochemical sample and estimating reliability of test result |
| WO2011019576A1 (en) | 2009-08-13 | 2011-02-17 | Siemens Healthcare Diagnostics Inc. | Methods and apparatus for ascertaining interferents and physical dimensions in liquid samples and containers to be analyzed by a clinical analyzer |
| EP3974838A2 (en) | 2009-08-13 | 2022-03-30 | Siemens Healthcare Diagnostics Inc. | Methods and apparatus for ascertaining interferents and physical dimensions in liquid samples and containers to be analyzed by a clinical analyzer |
| US9322761B2 (en) | 2009-08-13 | 2016-04-26 | Siemens Healthcare Diagnostics Inc. | Methods and apparatus for ascertaining interferents and physical dimensions in liquid samples and containers to be analyzed by a clinical analyzer |
| EP2464959A4 (en) * | 2009-08-13 | 2016-03-09 | Siemens Healthcare Diagnostics | Methods and apparatus for ascertaining interferents and physical dimensions in liquid samples and containers to be analyzed by a clinical analyzer |
| US11709129B2 (en) | 2013-07-18 | 2023-07-25 | Cor Health, Inc. | Spectroscopic measurements with parallel array detector |
| US11079315B2 (en) | 2013-07-18 | 2021-08-03 | Nueon Inc. | Spectroscopic measurements with parallel array detector |
| US10337984B2 (en) | 2013-07-18 | 2019-07-02 | Nueon, Inc. | Spectroscopic measurements with parallel array detector |
| US9983192B2 (en) * | 2014-02-19 | 2018-05-29 | Roche Diagnostics Operations, Inc. | Method and device for assigning a blood plasma sample |
| US20160349237A1 (en) * | 2014-02-19 | 2016-12-01 | Roche Diagnostics Operations, Inc. | Method and device for assigning a blood plasma sample |
| US10359416B2 (en) | 2014-02-19 | 2019-07-23 | Roche Diagnostics Operations, Inc. | Method and device for assigning a blood plasma sample |
| US11060967B2 (en) | 2014-02-28 | 2021-07-13 | Nueon Inc. | Method and apparatus for determining markers of health by analysis of blood |
| US11428574B2 (en) | 2015-04-14 | 2022-08-30 | Nueon Inc. | Method and apparatus for determining markers of health by analysis of blood |
| US10928310B2 (en) | 2016-01-28 | 2021-02-23 | Siemens Healthcare Diagnostics Inc. | Methods and apparatus for imaging a specimen container and/or specimen using multiple exposures |
| US11815446B2 (en) | 2016-01-28 | 2023-11-14 | Siemens Healthcare Diagnostics Inc. | Methods and apparatus for characterizing a specimen container and specimen |
| US10088360B2 (en) | 2016-02-04 | 2018-10-02 | Nova Biomedical Corporation | Spectroscopic analyte system and method for determining hemoglobin parameters in whole blood |
| US10151630B2 (en) | 2016-02-04 | 2018-12-11 | Nova Biomedical Corporation | Analyte system and method for determining hemoglobin parameters in whole blood |
| US10337980B2 (en) | 2016-02-04 | 2019-07-02 | Nova Biomedical Corporation | Analyte system and method for determining hemoglobin parameters in whole blood |
| US9535053B1 (en) * | 2016-02-04 | 2017-01-03 | Nova Biomedical Corporation | Analyte system and method for determining hemoglobin parameters in whole blood |
| US10732038B2 (en) | 2016-02-04 | 2020-08-04 | Nova Biomedical Corporation | Analyte system and method for determining hemoglobin parameters in whole blood |
| US9638686B1 (en) | 2016-02-04 | 2017-05-02 | Nova Biomedical Corporation | Analyte system and method for determining hemoglobin parameters in whole blood |
| US10338058B2 (en) | 2016-02-04 | 2019-07-02 | Sanvita Medical Llc | Analyte system and method for determining hemoglobin parameters in whole blood |
| US10088468B2 (en) | 2016-02-04 | 2018-10-02 | Nova Biomedical Corporation | Analyte system and method for determining hemoglobin parameters in whole blood |
| US10345146B2 (en) | 2016-02-04 | 2019-07-09 | Nova Biomedical Corporation | Analyte system and method for determining hemoglobin parameters in whole blood |
| US9933411B2 (en) | 2016-02-04 | 2018-04-03 | Nova Biomedical Corporation | Analyte system and method for determining hemoglobin parameters in whole blood |
| US11371882B2 (en) | 2016-03-21 | 2022-06-28 | Nueon Inc. | Porous mesh spectrometry methods and apparatus |
| US10760965B2 (en) | 2016-03-21 | 2020-09-01 | Nueon Inc. | Porous mesh spectrometry methods and apparatus |
| US11445953B2 (en) | 2016-11-04 | 2022-09-20 | Nueon Inc. | Combination blood lancet and analyzer |
| US11073472B2 (en) | 2016-11-14 | 2021-07-27 | Siemens Healthcare Diagnostics Inc. | Methods and apparatus for characterizing a specimen using pattern illumination |
| CN110520737B (en) * | 2017-04-13 | 2023-09-05 | 美国西门子医学诊断股份有限公司 | Method and apparatus for label compensation during sample characterization |
| CN110520737A (en) * | 2017-04-13 | 2019-11-29 | 美国西门子医学诊断股份有限公司 | Method and apparatus for carrying out label compensation during sample characterizes |
| US11333553B2 (en) | 2017-07-19 | 2022-05-17 | Siemens Healthcare Diagnostics Inc. | Methods and apparatus for specimen characterization using hyperspectral imaging |
| US11815519B2 (en) | 2017-07-19 | 2023-11-14 | Siemens Healthcare Diagnostics Inc. | Stray light compensating methods and apparatus for characterizing a specimen |
| WO2019027769A1 (en) | 2017-07-31 | 2019-02-07 | Siemens Healthcare Diagnostics Inc. | Methods and apparatus for imaging specimens and/or sample containers |
| EP3662258A4 (en) * | 2017-07-31 | 2020-07-15 | Siemens Healthcare Diagnostics Inc. | Methods and apparatus for imaging specimens and/or sample containers |
Similar Documents
| Publication | Publication Date | Title |
|---|---|---|
| US6353471B1 (en) | Method and apparatus for non-destructive screening of specimen integrity | |
| EP0967954B1 (en) | APPARATUS FOR determining the concentration of INTERFERENTS IN PLASMA | |
| US6195158B1 (en) | Apparatus and method for rapid spectrophotometric pre-test screen of specimen for a blood analyzer | |
| US4882492A (en) | Non-invasive near infrared measurement of blood analyte concentrations | |
| US6013528A (en) | Analyzer throughput featuring through-the-tip analysis | |
| US6470279B1 (en) | Method for calibrating spectrophotometric apparatus with synthetic fluids to measure plasma and serum analytes | |
| US7688448B2 (en) | Through-container optical evaluation system | |
| US6522398B2 (en) | Apparatus for measuring hematocrit | |
| US6791674B2 (en) | Analytical method and apparatus for blood using near infrared spectroscopy | |
| US7663738B2 (en) | Method for automatically detecting factors that disturb analysis by a photometer | |
| US20050037505A1 (en) | Spectroscopic method and apparatus for analyte measurement | |
| EP1586887B1 (en) | Spectroscopic method for total hemoglobin measurement | |
| CA2283154C (en) | Method and apparatus for measurement of blood substitutes | |
| US20020186363A1 (en) | Method and apparatus for screening plasma for interferents in plasma from donor blood bags | |
| US6882425B1 (en) | Method and apparatus for examining fluids of biological origin | |
| US20070190637A1 (en) | Apparatus for handling fluids | |
| US6995835B2 (en) | Method and apparatus for measuring analytes in blood bags | |
| CA2323442C (en) | Method and apparatus for measuring proteins | |
| US7198955B1 (en) | Method and apparatus for measurement of blood substitutes | |
| US20020110487A1 (en) | Apparatus and method for handling fluids | |
| US5939327A (en) | Measurement of bile pigments in serum or plasma | |
| US20070291250A1 (en) | Solid control and/or calibration element for use in a diagnostic analyzer |
Legal Events
| Date | Code | Title | Description |
|---|---|---|---|
| STCF | Information on status: patent grant |
Free format text: PATENTED CASE |
|
| AS | Assignment |
Owner name: NIR DIAGNOSTICS INC., CANADA Free format text: CHANGE OF NAME;ASSIGNOR:CME TELEMETRIX INC.;REEL/FRAME:016164/0976 Effective date: 20040715 |
|
| FPAY | Fee payment |
Year of fee payment: 4 |
|
| AS | Assignment |
Owner name: SHAKLEE CORPORATION, CALIFORNIA Free format text: EXCLUSIVE LICENSE;ASSIGNOR:NIR DIAGNOSTICS INC.;REEL/FRAME:019140/0111 Effective date: 20060804 |
|
| AS | Assignment |
Owner name: NIR DIAGNOSTICS INC., CANADA Free format text: LICENSE TERMINATION;ASSIGNOR:NIR DIAGNOSTICS INC.;REEL/FRAME:021523/0155 Effective date: 20080905 |
|
| FEPP | Fee payment procedure |
Free format text: PAT HOLDER CLAIMS SMALL ENTITY STATUS, ENTITY STATUS SET TO SMALL (ORIGINAL EVENT CODE: LTOS); ENTITY STATUS OF PATENT OWNER: SMALL ENTITY |
|
| AS | Assignment |
Owner name: NIRESULTS INC., CANADA Free format text: ASSIGNMENT OF ASSIGNORS INTEREST;ASSIGNOR:NIR DIAGNOSTICS INC.;REEL/FRAME:022473/0568 Effective date: 20090122 |
|
| FPAY | Fee payment |
Year of fee payment: 8 |
|
| AS | Assignment |
Owner name: NELLCOR PURITAN BENNETT LLC, COLORADO Free format text: ASSIGNMENT OF ASSIGNORS INTEREST;ASSIGNOR:NIRESULTS, INC.;REEL/FRAME:027064/0516 Effective date: 20100917 |
|
| FPAY | Fee payment |
Year of fee payment: 12 |
|
| AS | Assignment |
Owner name: COVIDIEN LP, MASSACHUSETTS Free format text: CHANGE OF NAME;ASSIGNOR:NELLCOR PURITAN BENNETT LLC;REEL/FRAME:031704/0514 Effective date: 20120929 |
|
| SULP | Surcharge for late payment |