US6146897A - Method for the detection of cellular abnormalities using Fourier transform infrared spectroscopy - Google Patents
Method for the detection of cellular abnormalities using Fourier transform infrared spectroscopy Download PDFInfo
- Publication number
- US6146897A US6146897A US08/851,776 US85177697A US6146897A US 6146897 A US6146897 A US 6146897A US 85177697 A US85177697 A US 85177697A US 6146897 A US6146897 A US 6146897A
- Authority
- US
- United States
- Prior art keywords
- cell sample
- cells
- spectra
- normal
- infrared
- Prior art date
- Legal status (The legal status is an assumption and is not a legal conclusion. Google has not performed a legal analysis and makes no representation as to the accuracy of the status listed.)
- Expired - Lifetime
Links
- 238000000034 method Methods 0.000 title claims abstract description 201
- 230000001413 cellular effect Effects 0.000 title abstract description 9
- 230000005856 abnormality Effects 0.000 title abstract description 7
- 238000005033 Fourier transform infrared spectroscopy Methods 0.000 title description 15
- 238000001514 detection method Methods 0.000 title description 10
- 206010058314 Dysplasia Diseases 0.000 claims abstract description 80
- 201000010099 disease Diseases 0.000 claims abstract description 47
- 208000037265 diseases, disorders, signs and symptoms Diseases 0.000 claims abstract description 47
- 206010028980 Neoplasm Diseases 0.000 claims description 70
- 201000011510 cancer Diseases 0.000 claims description 68
- 238000010521 absorption reaction Methods 0.000 claims description 66
- 239000000126 substance Substances 0.000 claims description 56
- 210000001519 tissue Anatomy 0.000 claims description 45
- 238000004458 analytical method Methods 0.000 claims description 42
- 238000009826 distribution Methods 0.000 claims description 40
- 238000004971 IR microspectroscopy Methods 0.000 claims description 19
- 238000000862 absorption spectrum Methods 0.000 claims description 19
- 238000000491 multivariate analysis Methods 0.000 claims description 17
- 238000000701 chemical imaging Methods 0.000 claims description 15
- 238000011282 treatment Methods 0.000 claims description 7
- 210000000988 bone and bone Anatomy 0.000 claims description 6
- 210000000481 breast Anatomy 0.000 claims description 6
- 210000004996 female reproductive system Anatomy 0.000 claims description 6
- 210000004995 male reproductive system Anatomy 0.000 claims description 6
- 230000002068 genetic effect Effects 0.000 claims description 5
- 210000000496 pancreas Anatomy 0.000 claims description 5
- 210000003932 urinary bladder Anatomy 0.000 claims description 5
- 206010020880 Hypertrophy Diseases 0.000 claims description 4
- 210000003491 skin Anatomy 0.000 claims description 4
- 210000004556 brain Anatomy 0.000 claims 3
- 210000001035 gastrointestinal tract Anatomy 0.000 claims 3
- 210000004072 lung Anatomy 0.000 claims 3
- 230000001575 pathological effect Effects 0.000 claims 3
- 238000001228 spectrum Methods 0.000 abstract description 241
- 230000003211 malignant effect Effects 0.000 abstract description 54
- 238000002329 infrared spectrum Methods 0.000 abstract description 31
- 238000009595 pap smear Methods 0.000 abstract description 31
- 238000000513 principal component analysis Methods 0.000 abstract description 19
- 230000008569 process Effects 0.000 abstract description 16
- 239000011159 matrix material Substances 0.000 abstract description 15
- 206010008263 Cervical dysplasia Diseases 0.000 abstract description 14
- 206010008342 Cervix carcinoma Diseases 0.000 abstract description 6
- 208000006105 Uterine Cervical Neoplasms Diseases 0.000 abstract description 6
- 201000010881 cervical cancer Diseases 0.000 abstract description 6
- 230000036961 partial effect Effects 0.000 abstract description 5
- 238000003338 vibrational spectroscopic imaging Methods 0.000 abstract description 4
- 238000012417 linear regression Methods 0.000 abstract description 2
- 230000002829 reductive effect Effects 0.000 abstract description 2
- 210000004027 cell Anatomy 0.000 description 434
- 239000000523 sample Substances 0.000 description 146
- 230000003595 spectral effect Effects 0.000 description 47
- 230000009102 absorption Effects 0.000 description 38
- 238000012628 principal component regression Methods 0.000 description 31
- 230000001747 exhibiting effect Effects 0.000 description 26
- 238000007790 scraping Methods 0.000 description 26
- 239000000463 material Substances 0.000 description 22
- 238000004611 spectroscopical analysis Methods 0.000 description 22
- 230000002159 abnormal effect Effects 0.000 description 17
- 238000003384 imaging method Methods 0.000 description 16
- 238000004566 IR spectroscopy Methods 0.000 description 14
- 238000003745 diagnosis Methods 0.000 description 12
- 230000001186 cumulative effect Effects 0.000 description 11
- 238000002360 preparation method Methods 0.000 description 11
- 238000010238 partial least squares regression Methods 0.000 description 10
- 238000001574 biopsy Methods 0.000 description 8
- 238000001634 microspectroscopy Methods 0.000 description 8
- 239000000243 solution Substances 0.000 description 8
- 230000001594 aberrant effect Effects 0.000 description 7
- 238000002835 absorbance Methods 0.000 description 7
- 208000007951 cervical intraepithelial neoplasia Diseases 0.000 description 7
- 230000000875 corresponding effect Effects 0.000 description 7
- 238000007405 data analysis Methods 0.000 description 7
- 239000003755 preservative agent Substances 0.000 description 7
- 230000002335 preservative effect Effects 0.000 description 7
- 238000012545 processing Methods 0.000 description 7
- 229920002527 Glycogen Polymers 0.000 description 6
- 229910000661 Mercury cadmium telluride Inorganic materials 0.000 description 6
- 238000013459 approach Methods 0.000 description 6
- MCMSPRNYOJJPIZ-UHFFFAOYSA-N cadmium;mercury;tellurium Chemical compound [Cd]=[Te]=[Hg] MCMSPRNYOJJPIZ-UHFFFAOYSA-N 0.000 description 6
- 230000002380 cytological effect Effects 0.000 description 6
- 239000006185 dispersion Substances 0.000 description 6
- 229940096919 glycogen Drugs 0.000 description 6
- 238000012216 screening Methods 0.000 description 6
- 238000007619 statistical method Methods 0.000 description 6
- 238000012360 testing method Methods 0.000 description 6
- 241000701806 Human papillomavirus Species 0.000 description 5
- 208000006994 Precancerous Conditions Diseases 0.000 description 5
- 230000008901 benefit Effects 0.000 description 5
- 210000003679 cervix uteri Anatomy 0.000 description 5
- 201000003565 cervix uteri carcinoma in situ Diseases 0.000 description 5
- 238000011156 evaluation Methods 0.000 description 5
- 239000012530 fluid Substances 0.000 description 5
- 208000022159 squamous carcinoma in situ Diseases 0.000 description 5
- 210000004085 squamous epithelial cell Anatomy 0.000 description 5
- 208000022625 uterine cervix carcinoma in situ Diseases 0.000 description 5
- 229910052984 zinc sulfide Inorganic materials 0.000 description 5
- WUKWITHWXAAZEY-UHFFFAOYSA-L calcium difluoride Chemical compound [F-].[F-].[Ca+2] WUKWITHWXAAZEY-UHFFFAOYSA-L 0.000 description 4
- 229910001634 calcium fluoride Inorganic materials 0.000 description 4
- 238000010276 construction Methods 0.000 description 4
- 230000003247 decreasing effect Effects 0.000 description 4
- 238000001035 drying Methods 0.000 description 4
- 239000000835 fiber Substances 0.000 description 4
- 238000001727 in vivo Methods 0.000 description 4
- WPYVAWXEWQSOGY-UHFFFAOYSA-N indium antimonide Chemical compound [Sb]#[In] WPYVAWXEWQSOGY-UHFFFAOYSA-N 0.000 description 4
- 230000003902 lesion Effects 0.000 description 4
- 210000003097 mucus Anatomy 0.000 description 4
- 238000010606 normalization Methods 0.000 description 4
- 238000007781 pre-processing Methods 0.000 description 4
- 239000013074 reference sample Substances 0.000 description 4
- 238000010186 staining Methods 0.000 description 4
- 238000012935 Averaging Methods 0.000 description 3
- 241000233866 Fungi Species 0.000 description 3
- 241001465754 Metazoa Species 0.000 description 3
- 241000700605 Viruses Species 0.000 description 3
- 230000002411 adverse Effects 0.000 description 3
- 230000004075 alteration Effects 0.000 description 3
- 239000012620 biological material Substances 0.000 description 3
- 210000004369 blood Anatomy 0.000 description 3
- 239000008280 blood Substances 0.000 description 3
- 239000003795 chemical substances by application Substances 0.000 description 3
- 210000003743 erythrocyte Anatomy 0.000 description 3
- 238000009499 grossing Methods 0.000 description 3
- 230000036210 malignancy Effects 0.000 description 3
- 238000004476 mid-IR spectroscopy Methods 0.000 description 3
- 238000012986 modification Methods 0.000 description 3
- 230000004048 modification Effects 0.000 description 3
- 230000007170 pathology Effects 0.000 description 3
- -1 polyethylene Polymers 0.000 description 3
- 239000010453 quartz Substances 0.000 description 3
- 238000000926 separation method Methods 0.000 description 3
- VYPSYNLAJGMNEJ-UHFFFAOYSA-N silicon dioxide Inorganic materials O=[Si]=O VYPSYNLAJGMNEJ-UHFFFAOYSA-N 0.000 description 3
- 238000012306 spectroscopic technique Methods 0.000 description 3
- 238000010561 standard procedure Methods 0.000 description 3
- WGPCGCOKHWGKJJ-UHFFFAOYSA-N sulfanylidenezinc Chemical compound [Zn]=S WGPCGCOKHWGKJJ-UHFFFAOYSA-N 0.000 description 3
- 238000011179 visual inspection Methods 0.000 description 3
- XLYOFNOQVPJJNP-UHFFFAOYSA-N water Substances O XLYOFNOQVPJJNP-UHFFFAOYSA-N 0.000 description 3
- XKRFYHLGVUSROY-UHFFFAOYSA-N Argon Chemical compound [Ar] XKRFYHLGVUSROY-UHFFFAOYSA-N 0.000 description 2
- IJGRMHOSHXDMSA-UHFFFAOYSA-N Atomic nitrogen Chemical compound N#N IJGRMHOSHXDMSA-UHFFFAOYSA-N 0.000 description 2
- 241000894006 Bacteria Species 0.000 description 2
- 208000009458 Carcinoma in Situ Diseases 0.000 description 2
- 201000003883 Cystic fibrosis Diseases 0.000 description 2
- LFQSCWFLJHTTHZ-UHFFFAOYSA-N Ethanol Chemical compound CCO LFQSCWFLJHTTHZ-UHFFFAOYSA-N 0.000 description 2
- WSFSSNUMVMOOMR-UHFFFAOYSA-N Formaldehyde Chemical compound O=C WSFSSNUMVMOOMR-UHFFFAOYSA-N 0.000 description 2
- 241001670157 Gymnura Species 0.000 description 2
- 206010020843 Hyperthermia Diseases 0.000 description 2
- 241000124008 Mammalia Species 0.000 description 2
- 238000005481 NMR spectroscopy Methods 0.000 description 2
- 229910019142 PO4 Inorganic materials 0.000 description 2
- WCUXLLCKKVVCTQ-UHFFFAOYSA-M Potassium chloride Chemical compound [Cl-].[K+] WCUXLLCKKVVCTQ-UHFFFAOYSA-M 0.000 description 2
- FAPWRFPIFSIZLT-UHFFFAOYSA-M Sodium chloride Chemical compound [Na+].[Cl-] FAPWRFPIFSIZLT-UHFFFAOYSA-M 0.000 description 2
- 239000003570 air Substances 0.000 description 2
- 239000012472 biological sample Substances 0.000 description 2
- 238000004364 calculation method Methods 0.000 description 2
- 239000006285 cell suspension Substances 0.000 description 2
- 230000008859 change Effects 0.000 description 2
- 238000004590 computer program Methods 0.000 description 2
- 238000011161 development Methods 0.000 description 2
- 230000003292 diminished effect Effects 0.000 description 2
- 230000000694 effects Effects 0.000 description 2
- 230000007613 environmental effect Effects 0.000 description 2
- 239000011521 glass Substances 0.000 description 2
- 230000036031 hyperthermia Effects 0.000 description 2
- 230000002631 hypothermal effect Effects 0.000 description 2
- 230000001900 immune effect Effects 0.000 description 2
- 201000004933 in situ carcinoma Diseases 0.000 description 2
- 239000012678 infectious agent Substances 0.000 description 2
- 238000007689 inspection Methods 0.000 description 2
- 230000002452 interceptive effect Effects 0.000 description 2
- 210000004185 liver Anatomy 0.000 description 2
- 210000004962 mammalian cell Anatomy 0.000 description 2
- 238000000386 microscopy Methods 0.000 description 2
- 239000000203 mixture Substances 0.000 description 2
- 230000000877 morphologic effect Effects 0.000 description 2
- 230000008722 morphological abnormality Effects 0.000 description 2
- 230000004660 morphological change Effects 0.000 description 2
- 201000006417 multiple sclerosis Diseases 0.000 description 2
- 230000009826 neoplastic cell growth Effects 0.000 description 2
- 210000001672 ovary Anatomy 0.000 description 2
- 244000052769 pathogen Species 0.000 description 2
- 230000001717 pathogenic effect Effects 0.000 description 2
- NBIIXXVUZAFLBC-UHFFFAOYSA-K phosphate Chemical compound [O-]P([O-])([O-])=O NBIIXXVUZAFLBC-UHFFFAOYSA-K 0.000 description 2
- 239000010452 phosphate Substances 0.000 description 2
- IOLCXVTUBQKXJR-UHFFFAOYSA-M potassium bromide Chemical compound [K+].[Br-] IOLCXVTUBQKXJR-UHFFFAOYSA-M 0.000 description 2
- 210000002307 prostate Anatomy 0.000 description 2
- 239000007787 solid Substances 0.000 description 2
- 238000010972 statistical evaluation Methods 0.000 description 2
- 239000003053 toxin Substances 0.000 description 2
- 231100000765 toxin Toxicity 0.000 description 2
- 208000030507 AIDS Diseases 0.000 description 1
- 241000251468 Actinopterygii Species 0.000 description 1
- 241000196324 Embryophyta Species 0.000 description 1
- 238000001157 Fourier transform infrared spectrum Methods 0.000 description 1
- 241000282412 Homo Species 0.000 description 1
- XQFRJNBWHJMXHO-RRKCRQDMSA-N IDUR Chemical compound C1[C@H](O)[C@@H](CO)O[C@H]1N1C(=O)NC(=O)C(I)=C1 XQFRJNBWHJMXHO-RRKCRQDMSA-N 0.000 description 1
- 206010030247 Oestrogen deficiency Diseases 0.000 description 1
- 238000010222 PCR analysis Methods 0.000 description 1
- 239000004698 Polyethylene Substances 0.000 description 1
- 238000001069 Raman spectroscopy Methods 0.000 description 1
- 239000005083 Zinc sulfide Substances 0.000 description 1
- 230000004308 accommodation Effects 0.000 description 1
- 230000009471 action Effects 0.000 description 1
- 208000009956 adenocarcinoma Diseases 0.000 description 1
- 238000007605 air drying Methods 0.000 description 1
- 239000012491 analyte Substances 0.000 description 1
- 230000002547 anomalous effect Effects 0.000 description 1
- 239000003242 anti bacterial agent Substances 0.000 description 1
- 230000003466 anti-cipated effect Effects 0.000 description 1
- 239000002260 anti-inflammatory agent Substances 0.000 description 1
- 229940121363 anti-inflammatory agent Drugs 0.000 description 1
- 229940088710 antibiotic agent Drugs 0.000 description 1
- 229940121375 antifungal agent Drugs 0.000 description 1
- 239000003429 antifungal agent Substances 0.000 description 1
- 239000002246 antineoplastic agent Substances 0.000 description 1
- 239000003443 antiviral agent Substances 0.000 description 1
- 229910052786 argon Inorganic materials 0.000 description 1
- 239000012298 atmosphere Substances 0.000 description 1
- 229910001632 barium fluoride Inorganic materials 0.000 description 1
- 239000013060 biological fluid Substances 0.000 description 1
- 230000001680 brushing effect Effects 0.000 description 1
- XQPRBTXUXXVTKB-UHFFFAOYSA-M caesium iodide Inorganic materials [I-].[Cs+] XQPRBTXUXXVTKB-UHFFFAOYSA-M 0.000 description 1
- 230000000711 cancerogenic effect Effects 0.000 description 1
- 231100000315 carcinogenic Toxicity 0.000 description 1
- 239000003183 carcinogenic agent Substances 0.000 description 1
- 230000019522 cellular metabolic process Effects 0.000 description 1
- 210000003169 central nervous system Anatomy 0.000 description 1
- 150000004770 chalcogenides Chemical class 0.000 description 1
- 238000006243 chemical reaction Methods 0.000 description 1
- 239000013626 chemical specie Substances 0.000 description 1
- 210000001072 colon Anatomy 0.000 description 1
- 238000007906 compression Methods 0.000 description 1
- 230000006835 compression Effects 0.000 description 1
- 238000012790 confirmation Methods 0.000 description 1
- 239000000470 constituent Substances 0.000 description 1
- 238000011109 contamination Methods 0.000 description 1
- 238000012937 correction Methods 0.000 description 1
- 230000002596 correlated effect Effects 0.000 description 1
- 238000002681 cryosurgery Methods 0.000 description 1
- 210000004748 cultured cell Anatomy 0.000 description 1
- 229940127089 cytotoxic agent Drugs 0.000 description 1
- 238000013144 data compression Methods 0.000 description 1
- 230000008021 deposition Effects 0.000 description 1
- 238000001212 derivatisation Methods 0.000 description 1
- 238000002405 diagnostic procedure Methods 0.000 description 1
- 230000004069 differentiation Effects 0.000 description 1
- 229940079593 drug Drugs 0.000 description 1
- 239000003814 drug Substances 0.000 description 1
- 238000002651 drug therapy Methods 0.000 description 1
- 238000013399 early diagnosis Methods 0.000 description 1
- 238000005516 engineering process Methods 0.000 description 1
- 210000002919 epithelial cell Anatomy 0.000 description 1
- 238000001704 evaporation Methods 0.000 description 1
- 230000008020 evaporation Effects 0.000 description 1
- 238000002474 experimental method Methods 0.000 description 1
- 239000000834 fixative Substances 0.000 description 1
- 238000010438 heat treatment Methods 0.000 description 1
- 208000006454 hepatitis Diseases 0.000 description 1
- 231100000283 hepatitis Toxicity 0.000 description 1
- 239000012535 impurity Substances 0.000 description 1
- 238000011503 in vivo imaging Methods 0.000 description 1
- 239000011261 inert gas Substances 0.000 description 1
- 238000003331 infrared imaging Methods 0.000 description 1
- 230000000977 initiatory effect Effects 0.000 description 1
- 238000005305 interferometry Methods 0.000 description 1
- 238000011835 investigation Methods 0.000 description 1
- 230000005865 ionizing radiation Effects 0.000 description 1
- 210000001165 lymph node Anatomy 0.000 description 1
- 238000005259 measurement Methods 0.000 description 1
- 230000007246 mechanism Effects 0.000 description 1
- 238000007479 molecular analysis Methods 0.000 description 1
- 238000012544 monitoring process Methods 0.000 description 1
- 239000003471 mutagenic agent Substances 0.000 description 1
- 229910052757 nitrogen Inorganic materials 0.000 description 1
- 150000007523 nucleic acids Chemical class 0.000 description 1
- 102000039446 nucleic acids Human genes 0.000 description 1
- 108020004707 nucleic acids Proteins 0.000 description 1
- 230000003287 optical effect Effects 0.000 description 1
- 239000013307 optical fiber Substances 0.000 description 1
- 210000000056 organ Anatomy 0.000 description 1
- 210000004789 organ system Anatomy 0.000 description 1
- 239000008177 pharmaceutical agent Substances 0.000 description 1
- 229920000573 polyethylene Polymers 0.000 description 1
- 230000002265 prevention Effects 0.000 description 1
- 230000002250 progressing effect Effects 0.000 description 1
- 230000000135 prohibitive effect Effects 0.000 description 1
- 238000004445 quantitative analysis Methods 0.000 description 1
- 230000005855 radiation Effects 0.000 description 1
- 230000009467 reduction Effects 0.000 description 1
- 238000012552 review Methods 0.000 description 1
- SBIBMFFZSBJNJF-UHFFFAOYSA-N selenium;zinc Chemical compound [Se]=[Zn] SBIBMFFZSBJNJF-UHFFFAOYSA-N 0.000 description 1
- 230000035945 sensitivity Effects 0.000 description 1
- 229910052709 silver Inorganic materials 0.000 description 1
- 239000004332 silver Substances 0.000 description 1
- 239000011780 sodium chloride Substances 0.000 description 1
- 229910052950 sphalerite Inorganic materials 0.000 description 1
- 206010041823 squamous cell carcinoma Diseases 0.000 description 1
- 239000012086 standard solution Substances 0.000 description 1
- 238000003860 storage Methods 0.000 description 1
- 239000000758 substrate Substances 0.000 description 1
- 239000000725 suspension Substances 0.000 description 1
- 210000001550 testis Anatomy 0.000 description 1
- 230000001225 therapeutic effect Effects 0.000 description 1
- 230000009466 transformation Effects 0.000 description 1
- 230000007704 transition Effects 0.000 description 1
- 238000011269 treatment regimen Methods 0.000 description 1
- GZXOHHPYODFEGO-UHFFFAOYSA-N triglycine sulfate Chemical class NCC(O)=O.NCC(O)=O.NCC(O)=O.OS(O)(=O)=O GZXOHHPYODFEGO-UHFFFAOYSA-N 0.000 description 1
- 210000004291 uterus Anatomy 0.000 description 1
- DRDVZXDWVBGGMH-UHFFFAOYSA-N zinc;sulfide Chemical compound [S-2].[Zn+2] DRDVZXDWVBGGMH-UHFFFAOYSA-N 0.000 description 1
Images


Classifications
-
- G—PHYSICS
- G01—MEASURING; TESTING
- G01J—MEASUREMENT OF INTENSITY, VELOCITY, SPECTRAL CONTENT, POLARISATION, PHASE OR PULSE CHARACTERISTICS OF INFRARED, VISIBLE OR ULTRAVIOLET LIGHT; COLORIMETRY; RADIATION PYROMETRY
- G01J3/00—Spectrometry; Spectrophotometry; Monochromators; Measuring colours
- G01J3/28—Investigating the spectrum
- G01J3/45—Interferometric spectrometry
- G01J3/453—Interferometric spectrometry by correlation of the amplitudes
-
- G—PHYSICS
- G01—MEASURING; TESTING
- G01J—MEASUREMENT OF INTENSITY, VELOCITY, SPECTRAL CONTENT, POLARISATION, PHASE OR PULSE CHARACTERISTICS OF INFRARED, VISIBLE OR ULTRAVIOLET LIGHT; COLORIMETRY; RADIATION PYROMETRY
- G01J3/00—Spectrometry; Spectrophotometry; Monochromators; Measuring colours
- G01J3/28—Investigating the spectrum
- G01J2003/2866—Markers; Calibrating of scan
-
- G—PHYSICS
- G01—MEASURING; TESTING
- G01N—INVESTIGATING OR ANALYSING MATERIALS BY DETERMINING THEIR CHEMICAL OR PHYSICAL PROPERTIES
- G01N21/00—Investigating or analysing materials by the use of optical means, i.e. using sub-millimetre waves, infrared, visible or ultraviolet light
- G01N21/17—Systems in which incident light is modified in accordance with the properties of the material investigated
- G01N21/25—Colour; Spectral properties, i.e. comparison of effect of material on the light at two or more different wavelengths or wavelength bands
- G01N21/31—Investigating relative effect of material at wavelengths characteristic of specific elements or molecules, e.g. atomic absorption spectrometry
- G01N21/35—Investigating relative effect of material at wavelengths characteristic of specific elements or molecules, e.g. atomic absorption spectrometry using infrared light
- G01N2021/3595—Investigating relative effect of material at wavelengths characteristic of specific elements or molecules, e.g. atomic absorption spectrometry using infrared light using FTIR
-
- G—PHYSICS
- G01—MEASURING; TESTING
- G01N—INVESTIGATING OR ANALYSING MATERIALS BY DETERMINING THEIR CHEMICAL OR PHYSICAL PROPERTIES
- G01N21/00—Investigating or analysing materials by the use of optical means, i.e. using sub-millimetre waves, infrared, visible or ultraviolet light
- G01N21/17—Systems in which incident light is modified in accordance with the properties of the material investigated
- G01N21/25—Colour; Spectral properties, i.e. comparison of effect of material on the light at two or more different wavelengths or wavelength bands
- G01N21/31—Investigating relative effect of material at wavelengths characteristic of specific elements or molecules, e.g. atomic absorption spectrometry
- G01N21/35—Investigating relative effect of material at wavelengths characteristic of specific elements or molecules, e.g. atomic absorption spectrometry using infrared light
Definitions
- Pap smear The detection of premalignant and malignant cells by the Papanicolaou smear (Pap smear) has greatly reduced the high mortality rate due to cervical cancer. Nevertheless, the Pap screening process is labor intensive and has remained essentially unchanged since it was first described by Papanicolaou almost 50 years ago.
- To perform the test cells are exfoliated from a patient's cervix by scraping using a spatula or brush. The scraping is then smeared on a slide, and the slide is stained and microscopically examined.
- the microscopic examination is a tedious process, and requires a cytotechnologist to visually scrutinize all the fields within a slide to detect the often few aberrant cells in a specimen. Consequently, the detection of abnormal specimens depends on the level of a cytotechnologist's experience and workload, and also on the quality of the smear preparation.
- HPV human papilloma virus
- FT-IR Fourier Transform Infrared
- the spectra of specimens diagnosed with cancer exhibited significant changes in the intensity of the bands at 1025 cm -1 and 1047 cm -1 , and demonstrated a peak at 970 cm -1 which was absent in normal specimens. Samples with cancer also showed a significant shift in the normally appearing peaks at 1082 cm -1 , 1155 cm -1 and 1244 cm -1 .
- the cervical specimens diagnosed cytologically as dysplasia exhibited spectra intermediate in appearance between normal and malignant. Based on these observations, Wong et al. concluded that FT-IR spectroscopy may provide a reliable and cost effective alternative for screening cervical specimens.
- the method of selecting peak intensity ratios to discriminate between spectra has its problems as well.
- This technique identifies general shapes and patterns, and like the previous approach can lack acuity in the detection of subtle differences between spectra.
- Other disadvantages of this method include its inability to model for interferences that can be caused by nondiagnostic debris, and/or errors that can result from sample preparation and handling techniques. Aside from the latter, this method can also fail to adequately model for baseline shifts, spectral fringes, batch to batch variations in samples and/or to account for the nonlinearities that can arise from spectroscopic instrumentation and refractive dispersion of infrared light.
- dysplastic cells to malignant cells
- a generally useful method using IR spectroscopy must be capable of this rather fine distinction.
- the present invention provides such methods.
- the present invention provides methods for the spectroscopic detection of chemical differences between cells in a sample of cells or tissue.
- the methods provided include single-cell infrared microspectroscopy and infrared spectroscopic imaging.
- the data acquired by the microspectroscopic or imaging process is analyzed using multivariate analysis.
- the detected chemical difference is associated with a disease state, particularly a malignant or premalignant state.
- the invention provides a method for the early detection of a malignant or premalignant state.
- the invention provides a spectroscopic method for distinguishing between cells in a cell sample which are cytologically and chemically "normal” and those cells in a cell sample which appear cytologically normal but which are, in fact, "chemically aberrant.”
- the invention provides a spectroscopic method for the identification of women who are at high risk for developing cervical dysplasia.
- cervical cells are utilized as an exemplary cell type.
- the exemplary use of cervical cells does not limit or define the scope of the present invention.
- the invention provides a method for detecting chemical differences between a cell sample and a reference cell sample, utilizing single-cell infrared microspectroscopy, the method comprising:
- the invention provides a method for detecting chemical differences between a cell sample and a reference cell sample utilizing single-cell infrared microspectroscopy, the method comprising:
- the invention is a method for detecting chemical differences between a cell sample and a reference cell sample utilizing infrared spectroscopic imaging, the method comprising:
- the invention is a method for identifying women at high risk for developing cervical dysplasia utilizing single-cell infrared microspectroscopy, the method comprising:
- FIG. 1 shows the mid-infrared spectrum (from 950 cm -1 -1300 cm -1 ) of a normal cervical scraping.
- FIG. 2 shows the mid-infrared spectrum (from 950 cm -1 -1300 cm -1 ) of two populations of squamous epithelial cells.
- FIG. 3 shows the mid-infrared spectrum (from 950 cm -1 -1300 cm -1 ) of a malignant cervical scraping.
- FIG. 4 shows a comparison of the mid-infrared spectra (from 950 cm -1 -1300 cm -1 ) from parabasal cells and endocervical cells.
- FIG. 5 shows a comparison of the mid-infrared spectra (from 950 cm 1 -1300 cm -1 ) from a dysplastic cell and a squamous cancer cell.
- FIG. 6 shows two typical mid-infrared spectra (from 1000 cm -1 -1300 cm -1 ) of individual normal cells in a cervical smear.
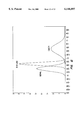
- FIG. 7 shows a histogram representation of a set of predicted scores in a normal smear.
- FIG. 8 summarizes the cumulative percentage of predicted scores at the 0.5 cut off interval based on histogram computations from all smears with reference set I.
- FIG. 9 summarizes the cumulative percentage of predicted scores at the 0.5 cut off interval based on histogram computations from all smears with reference set II.
- FIG. 10 summarizes the cumulative percentage of predicted scores at the 0.5 cut off interval based on histogram computations from all smears with reference set III.
- FIG. 11 summarizes the cumulative percentage of predicted scores at the 0.5 cut off interval based on histogram computations from all smears with reference set IV.
- FIG. 12 is a normal distribution curve displaying the means and standard deviations of 4 each of normal, dysplasia and cancer specimens. The curve was constructed using Pattern I spectra of normal cells versus Pattern I of cancer cells.
- FIG. 13 is a normal distribution curve displaying the means and standard deviations of 4 each of normal, dysplasia and cancer specimens. The curve was constructed using Pattern II spectra of normal cells versus Pattern II of cancer cells.
- FIG. 14 is a normal distribution curve displaying the means and standard deviations of 4 each of normal, dysplasia and cancer specimens. The curve was constructed using Pattern II spectra of normal cells versus Pattern II spectra of dysplastic cells.
- FIG. 15 is a normal distribution curve displaying the means and standard deviations of four each of normal, dysplasia and cancer specimens. The curve was constructed using combined Pattern I and Pattern II spectra of cytologically normal cells from normal smears and combined Pattern I and Pattern II spectra of cytologically normal cells from cancer smears.
- PCA principal component analysis
- PCR principal component regression
- PLS partial least squares analysis
- PRESS prediction residual error sum of squares
- FT-IR Fourier Transform infrared spectroscopy
- SPIFF spectral image files
- FPA focal plane array
- CIN cervical intraepithelial neoplasia
- HPV human papilloma virus
- MCT mercury-cadmium-telluride
- InSb indium antimonide
- DTGS deuterated triglycine sulfate.
- cell sample denotes the collection of cells which is studied using the methods of the invention.
- a “cell sample” is, for example, a smear, biopsy sample or pathology sample.
- the “cell sample” is placed on an infrared-transparent matrix and used as isolated or is further manipulated (e.g., dispersed, preserved, etc.) as desired.
- the word “cell” refers to individual cells which when grouped together with other cells comprise a "cell sample.”
- the phrase “cells of interest,” as used herein, defines those cells which have been collected from a population of cells and which are studied by comparing them, using the methods of the invention, to a reference cell sample.
- Cell samples which are "normal” are those taken from a patient with no prior history of disease.
- Normal-dysplastic cells are those which appear normal by Pap cytology, but which are taken from patients with a history of dysplasia.
- the term “chemical differences” refers to alterations in cellular chemistry which are associated with, for example, a disease state (e.g., cancer, dysplasia, etc.). These "chemical differences” give rise to a cellular milieu which is altered from that of normal cells and this alteration is detectable by infrared spectroscopy.
- infrared light is intended to encompass energy in the infrared region of the electromagnetic spectrum.
- spectra and “absorption data” are used interchangeably. It is understood that either of these terms can refer to the raw data generated by the spectroscopic measurement, a fully processed spectrum or a spectrum which has undergone additional manipulation such smoothing or derivatization.
- underivatized and “unsmoothed” are used to refer to a process whereby no arithmetic manipulations have been applied to 1) enhance the slope or changes in the slope of spectra, and 2) reduce the random noise in spectra, respectively.
- Spectra acquired practicing the instant invention are processed, manipulated or analyzed by a number of methods including both classical spectroscopic analytical methods and multivariate analysis.
- classical spectroscopic analytical methods denotes methods such as, for example, analysis and/or comparison of peak heights, peak areas, peak intensities and analysis and/or comparison of ratios of any of these parameters (e.g., peak height A:peak height B, peak height A:peak intensity B, peak height A:peak area A, etc.).
- classical spectroscopic analytical methods is the use of the K-matrix, the P-matrix and/or linear discriminant analysis.
- multivariate analysis denotes a method of data analysis such as, for example, PCA, PLS 1, PLS 2 and PCR.
- mean denotes the arithmetic mean (i.e., the mean obtained by adding several quantities together and dividing the sum by the number of quantities).
- score denotes quantities derived from processing spectral data by either classical spectroscopic analytical methods or multivariate analysis.
- a “score” is any quantity which is used to compare a spectrum, or spectra, from a diagnostic cell sample with a reference set of spectra (e.g., peak height, peak height:peak area, etc.).
- Predicted scores are a product of multivariate analysis and are generated by assigning different dummy variables to the spectra of cells falling into known categories of reference spectra (e.g., spectra associated with cells identified as normal, normal-dysplastic, dysplastic, malignant, etc.). The predicted scores indicate how closely the infrared spectra resemble the various known categories of reference spectra.
- “Frequency distribution profiles” are tabulations of the frequencies of the predicted scores for each biological specimen.
- human cervical cells are used as an example of a cell type with which the methods of the instant invention can be practiced.
- the exemplary use of human cervical cells is intended neither to limit nor restrict the scope of cell types with which the present invention can be used.
- the instant invention can be used with cell samples derived from animals other than human. It will be clear to those of skill in the art that the methods of the instant invention will be of use with a wide range of cell types from an array of different tissues. Detection of altered cellular chemistry in cell samples (e.g., biopsy, surgical pathology samples, etc.) and cultured cells is encompassed by the instant invention.
- the present invention is directed to detecting chemical differences between cells in a cell sample and cells in a reference cell sample.
- the chemical differences between the cell sample and the reference cell sample can arise from any process known to cause chemical changes in cells. Different cell types can possess inherent chemical differences which are spectroscopically accessible.
- the chemical differences arise as a result of a disease state in the tissue under study (e.g., cancer, dysplasia, hypertrophy, etc.).
- the disease state is one caused by a pathogen (e.g., bacteria, virus, fungus, etc.), an insult or a toxin, or can arise due to a genetic anomaly (e.g., multiple sclerosis, cystic fibrosis, etc.).
- Chemical differences in cells may also arise due to the action of agent or an environmental condition upon the cell.
- the methods of the invention can also be used to monitor the course of a disease state which is progressing, resolving or in steady-state. For example, as the disease state progresses, the spectral data acquired from the cells of interest will diverge more sharply, over time, from the spectral data acquired from normal cells which serve as a reference. In contrast, as a disease state resolves, the spectral data from the cells of interest will converge on the spectral data acquired from the normal reference cells. Also within the scope of the invention is the study of tissue in which the disease state is in remission. The invention can also be practiced using diseased cells as the reference cells.
- the chemical differences, or the changes in the chemical differences over time are due to the treatment of a disease state.
- the treatment can take any form known to those of skill in the art.
- the effects of treating cancer with drug therapy, radiation, hyperthermia, hypothermia, cryosurgery, etc. can be monitored using the techniques of the instant invention.
- samples taken from the remaining lesion and/or the tissue which surrounded the lesion can be examined for the presence or absence of chemically aberrant cells.
- the methods of the invention are not limited; however, to use in conjunction with cancer. It will be apparent to those of skill in the art that the methods provided herein are not limited to distinguishing between malignant and normal tissues and cells are useful with tissue in any disease state which gives rise to a spectroscopically detectable chemical difference between the diseased and the normal cells.
- the scope of the instant invention includes probing chemical changes in cells which arise as a result of, for example, administration of pharmaceutical agents (e.g., chemotherapeutic agents, agents which alter cellular metabolism, antibiotics, antiviral agents, antifungal agents, anti-inflammatory agents, etc.), administration of carcinogenic or mutagenic agents.
- pharmaceutical agents e.g., chemotherapeutic agents, agents which alter cellular metabolism, antibiotics, antiviral agents, antifungal agents, anti-inflammatory agents, etc.
- Other agents which, when administered to cells, will cause detectable chemical changes will be apparent to those of skill in the art.
- the chemical change is due to the presence of a drug or a probe which is itself detectable as a chemical species by the methods of the present invention.
- the reference set of absorption spectra will be collected from the spectra of a normal, or undamaged tissue, and the diagnostic absorption data will be acquired from a diseased or damaged tissue. Monitoring the effect of a treatment regimen by comparing the treated tissue with the normal tissue is also within the scope of this embodiment.
- the reference set is assembled from spectra of the diseased or damaged tissue and the course of treatment followed by comparison of the treated tissue with this reference set.
- Also within the scope of the present invention is the detection of altered cellular chemistry induced by environmental conditions such as, for example, hyperthermia, hypothermia and ionizing radiation.
- the cell or tissue sample comprising the reference set and/or the cell of interest can originate from the tissue of any living organism including, for example, mammals (e.g., humans, domestic animals, farm animals), fish, plants, fungi, etc.
- mammals e.g., humans, domestic animals, farm animals
- fish plants
- fungi etc.
- the tissue is from any structure or organ system within the body including, but not limited to, bladder, breast, male or female reproductive system (e.g., prostate, testicles, ovaries, uterus, cervix, etc.), central nervous system, blood, liver, bone, colon, pancreas or skin.
- the discussion which follows is equally applicable to the preparation of the cell sample comprising the cells of interest as it is to the preparation of the reference cell sample(s).
- the cell or tissue sample is collected and prepared by any of the methods known in the art. For example, tissue and cell samples are taken from biopsy samples, scrapings or from pathology samples following surgical excision. Samples are prepared as standard histology or cytology samples and can be fixed and/or preserved and/or stained. Cell samples can be dispersed on a substrate. Preferably, non-diagnostic debris is removed from cell or tissue samples. Alternatively, the cell or tissue samples are utilized as isolated, and without further preparation, to acquire IR spectroscopic data.
- the exfoliated cervical cell sample are collected by standard methods such as those used in collecting samples for Pap screening or biopsy and applied to an infrared transparent-matrix.
- infrared-transparent matrices are available for use in the present invention.
- Preferred matrices for mid-infrared studies are BaF 2 , ZnS, polyethylene film, CsI, KCl, KBr, CaF 2 , NaCl and ZnSe.
- the sample is dried to remove moisture which interferes with the infrared spectra.
- the methods used for drying will typically involve air-drying at ambient temperatures.
- the sample is dried with controlled gentle heating, and by passing a stream of air or inert gas over the sample.
- matrices with applied samples are placed at 30° C. to 35° C. (e.g., a hot plate with temperature control knob to about 30-35° C.) and an atmosphere of, for example, air, nitrogen or argon can be passed over the samples to expedite their drying.
- tissue fluids also absorb strongly in the mid-infrared region and contribute to changes in intensity at several frequencies.
- the methods of the present invention use samples that are easy to manipulate and which provide high quality spectra. More importantly, drying eliminates the problems associated with tissue fluids, and reduces the risk of contamination by infectious agents. In a study of more than 100 cervical scrapings processed by this method, the direct deposition and drying of specimens was found to provide spectra with minimal or no fringes.
- Clumping of cells in a cervical smear or other tissue sample is generally problematic and complicates the diagnosis.
- a thorough dispersion of the cell sample causes the separation of cells from surrounding nondiagnostic debris and mucus, provides a relatively uniform suspension of cells for spectral acquisition, and enhances the possibility of detecting the abnormal cells.
- the samples will be dispersed prior to their application to the infrared matrix.
- Dispersion of the cell sample is preferably carried out in a preservative solution which maintains the integrity of the exfoliated cells. The selection criteria for a preservative solution also necessitate that the preservative solution evaporates readily, and upon evaporation, leaves no residues that create interference in the infrared spectra of cervical scrapings.
- PRESERV CYT® CYTYC Corporation, Marlborough, Mass., USA
- Other solutions will be apparent to those of skill in the art and can include standard solutions such as, for example, ethanol/water mixtures, formalin, Carnoy's fixative, etc.
- the methods of the present invention can also be practiced on tissue and cell samples which are not preserved. Following dispersion of the cell sample, the mixture is filtered to remove the nondiagnostic debris and the solution of cells is applied in a uniform layer to an infrared matrix, as described above, and dried.
- a beam of infrared light is directed at individual cells within the sample and the absorption of the sample is monitored using any of a number of commercially available infrared spectrometers.
- An example of an appropriate instrumental setup is a Bio-Rad Digilab FTS 165 spectrometer coupled to a Bio-Rad FT-IR UMA-500 microscope.
- Other suitable spectrometers and microscopes are known to those of skill in the art.
- Detectors useful in practicing the instant invention include, for example, a single-element MCT (mercury-cadmium-telluride) detector or an array detector.
- a fundamental advantage of FT-IR microspectroscopy lies in the spatial selectivity of the procedures.
- the spatial selectivity can be better understood by way of comparison with bulk IR spectroscopy.
- the IR beam is directed towards all components of a cell sample, cellular and non-cellular, and no specific components or cells in the cell sample can be targeted for spectral acquisition. Consequently, in bulk spectroscopy, the final spectrum represents the average spectra of all components in a cell sample.
- the IR beam is directed towards any of several objects within a smear. For example, if the spectra of only red blood cells are desired, the microscope stage is simply moved so as to position the red blood cells in the path of the IR beam.
- FT-IR microspectroscopy is also a sensitive method allowing the study of objects with sizes approaching the diffraction limit.
- this method can provide a spectrum of each type of cervical cell; whether be it a 7-12 micron parabasal, or endocervical cell, or a 35-45 micron intermediate squamous epithelial cell.
- IR microspectroscopy demonstrates that the infrared spectra of individual cells allow the chemical changes in a cell sample to be detected. For example, it is the infrared spectra of individual cervical cells in a cervical cell scraping that are useful for the discriminating between normal, dysplastic and malignant cervical scrapings. More importantly, techniques have been developed and are described herein (see Examples 1-5), for constructing distribution profiles of spectra of individual cells based on predicted scores generated by Principle Component Analysis (PCA) and Partial Least Squares (PLS). The distribution profiles are used to diagnose normal cells and chemically aberrant cells in a cell sample. Chemically aberrant cells can include cytologically normal and cytologically abnormal cells.
- PCA Principle Component Analysis
- PLS Partial Least Squares
- the distribution profiles allow the cells to be classed according the presence or absence of distinctive chemical changes associated with disease states.
- distribution profiles generated from cervical cell samples display a separation between the spectra of cytologically "normal” cells in "normal” smears (i.e., smears that were cytologically diagnosed as normal and which were derived from women with no prior history of dysplasia) and in smears with "normal-dysplasia” (i.e., smears that were cytologically diagnosed as normal and which were derived from women with a past history of dysplasia).
- the methods of the present invention allow separation between the spectra of "normal” cells in "normal” smears and cytologically "normal” cells in smears diagnosed as cancer.
- the infrared spectra are generally collected at a resolution of from about 2 cm -1 to about 10 cm -1 , preferably from about 4 cm -1 to about 8 cm -1 . Additionally, a number of scans are taken and co-added. Preferably about 50-1000 scans are co-added, more preferably about 100-800 scans are co-added.
- the spectra are normalized by setting the minimum absorbance at 0.0 and the maximum absorbance at 1.0 in the frequency regions between 3000 cm -1 to 950 cm -1 ; however, in some embodiments, the techniques of the invention are practiced without normalizing the spectra. In one group of embodiments, the data is neither smoothed nor derivatized.
- the data is smoothed but not derivatized or derivatized but not smoothed. In other embodiments the data is smoothed and/or derivatized. Thus, in one group of embodiments the data is first smoothed then derivatized. In another group of embodiments, the data is first derivatized then smoothed.
- the reference set of infrared absorption data is obtained from cell samples which have previously been identified by Pap cytology as normal, dysplastic or malignant samples.
- the reference set of infrared absorption data from cervical cells is obtained from a representative group of females with varying degrees of cervical conditions including, but not limited to dysplasia and cancer. Identification of these cell types is typically made by cytological examination such as the one performed on cervical smears. More preferably, the reference set of infrared absorption data is prepared from about 10 to about 1000 reference cell samples.
- the infrared absorption spectra for each of the identified cell types is preferably obtained for the mid-infrared region from about 3000 cm -1 to about 950 cm -1 .
- the frequencies between 12,500 cm -1 to 4000 cm -1 is preferred.
- sample holders are used which are made of a material appropriate for use in this region such as those made of glass, quartz or CaF 2 .
- the number of individual cells, present in each reference cell sample, on which spectroscopy is performed is preferably from about 10 to about 1000 and more preferably from about 100 to about 500. It will be appreciated by those of skill in the art that both the number of cell samples and the number of cells within those cell samples which are spectroscopically studied can be varied over a wide range. As it becomes larger (i.e., more cell samples and more cells) the reference set becomes a more accurate portrayal of the spectrum of a particular cell type. Thus, it is desirable to vary the size of the reference set to achieve as adequate a portrayal of the cell type as is necessary under the circumstances.
- the chemical difference is associated with a malignant or premalignant phenotype.
- the cell sample comprises cervical cells which are premalignant and/or malignant.
- comparison of the infrared absorption data for the sample and the data for the reference set preferably utilizes principal component analysis in the frequency region of about 3000 cm -1 to about 950 cm -1 and more preferably in the frequency regions of about 1250 cm -1 to 1000 cm -1 , about 1420 cm -1 to 1330 cm -1 and about 3000 cm -1 to 2800 cm -1 .
- Vibrational spectroscopic imaging is a comparatively new imaging modality with utility in the biological, chemical and material sciences (Lewis, E. N., et al. Anal. Chem., 67:3377-3381(1995)).
- a flexible and robust technique, vibrational spectroscopic imaging combines the molecular identification powers of spectroscopic molecular analysis with the ability to visualize the morphology and regional chemical properties of a tissue sample through 2-D and, potentially, 3-D imaging. Further, vibrational spectroscopic imaging provides access to both qualitative and quantitative data about the distribution of the molecules of interest in the sample under investigation.
- a typical near-IR imaging instrument utilizes a step-scan Fourier transform Michelson interferometer (Bio-Rad FTS-60A) coupled to an IR microscope (Bio-Rad UMA 500A) and an indium antimonide (InSb) focal plane array (FPA) detector (ImagIR, Santa Barbara Focalplane).
- the microscope optics and the interferometer electronics are modified to couple efficiently to the InSb detector.
- the optical modification consists of placing a CaF 2 lens between the microscope objective and the FPA.
- the electronic modification consists of adding a counter/timer board which synchronizes the stepping of the interferometer and the FPA detector. Data acquisition and processing is similar to that performed during a conventional FT-IR study.
- the interferograms are organized as spectral image files (SPIFF) and Fourier transformed.
- SPIFF files can be visualized using commercially available image processing and visualization software (e.g., ChemImage 1.0, Chemlcon, Optimas 4.02, etc.).
- image processing and visualization software e.g., ChemImage 1.0, Chemlcon, Optimas 4.02, etc.
- a typical mid-IR imaging system will have many of the same components described above, but will differ in that the FPA can be a MCT (mercury cadmium telluride) detector.
- the lens between the microscope objective and the detector can be CaF 2 , glass or quartz.
- Infrared spectroscopic imaging instruments are commercially available, e.g., Bio-Rad's FTS StingRay 6000 (Bio-Rad, Cambridge, Mass.). Infrared imaging is made possible by combining the multiplexing power of interferometry with a multichannel detector.
- the multichannel detector allows spectra at every pixel to be collected simultaneously and the interferometer allows all relevant wavelengths to be monitored concurrently.
- state-of-the-art FPA detectors have as many as one million detector elements and readout rates in excess of 16,000,000 pixels per second. The resolution of the images produced in IR imaging is limited only by the number of detector elements on the FPA.
- the FPA detectors can be constructed of materials that are sensitive to light in the wavelength range between 10,000 cm -1 -500 cm -1 .
- the multiplex/multichannel instrument set up affords rapid data acquisition.
- Lewis and coworkers have reported collecting data sets containing 16,384 pixels at 16 cm -1 resolution in only 12 seconds (Lewis, E. N., et al. Anal. Chem., 67:3377-3381 (1995)).
- the use of infrared spectroscopic imaging instruments such as the FTS StingRay 6000, above, equipped with optic fibers finds application with dried cell samples, in vivo imaging, and cell samples in a preservative fluid.
- an infrared-sensitive "camera” comprised of a two-dimensional array of detectors, captures an image of the field of view of the infrared microscope. Each detector in the array captures one pixel of the image. The data from each pixel consists of the entire infrared absorption spectrum for that point in the image, over the spectral range specified. The result of this process is a large data file which contains the complete spectrum of each pixel in the image. The field of view of the microscope and the camera are adjusted so that the image of a typical cell of interest covers at least 9 pixels. Collection of this data takes a very short time, typically seconds to minutes. Since the data is being collected over the entire image, all the data necessary for a diagnostic test is acquired simultaneously; a process denoted by the term "multiplex advantage.”
- spectra from approximately 100 cytologically normal cells it is preferable to obtain spectra from approximately 100 cytologically normal cells, and then to extract from this set the spectra of those cells which meet the criterion being used for the evaluation (e.g., either Pattern I or Pattern II).
- the cells are identified by the operator through the microscope, the spectra are obtained one at a time, and the spectra are then examined by the operator and classified as to pattern. The spectra of those cells which exhibit the appropriate pattern are then analyzed by the chemometric software.
- the imaging approach the spectra of the entire image are obtained simultaneously by the instrument and stored in a computer.
- spectra are then examined by software to: first, locate individual cells and group the several spectra obtained from each cell; second, classify the located cells as to pattern; and third, compare the spectra of the appropriate pattern against the reference set.
- This process can be carried out entirely automatically in software, and can be completed in a very short time.
- the output of the imaging process is a completed diagnosis, since it yields the scores for each of the cells which were spectroscopically probed.
- the imaging aspect of the invention can be performed using either mid- or near-infrared light.
- the beam of infrared light has a frequency of from about 3000 cm -1 to about 950 cm -1 .
- the beam of infrared light has a frequency of from about 4000 cm -1 to about 12000 cm -1 .
- the data is compared to the reference set of spectra, acquired under the same experimental spectroscopic conditions, to determine if variations exist in the spectra which are characteristic of chemical differences.
- the chemical changes are due to a malignant or premalignant condition.
- a number of means of performing this comparison are used.
- multivariate analysis is used.
- Discrimination between spectra of specimens that have subtle variations requires the use of robust and sensitive methods of analysis. These methods must model for the nonlinearities that can arise due to various causes as well as account for the day to day drifts in instrument settings. Sample handling errors, spectral fringes, baseline shifts, batch to batch variations, the presence of nondiagnostic debris and all other factors that adversely affect discrimination must be also adequately accounted for and modeled. Water absorbs strongly in the mid-infrared region and contributes to changes in intensity at several frequencies. Thus, the method of analysis must also consider the varying amounts of moisture in cervical specimens. Lastly, for a method to prove robust it must distinguish between good and poor quality spectra, and exclude samples not representative of the reference set.
- the non-representative samples are referred to as outlier samples.
- An outlier sample is a sample that is statistically different from all other samples in the reference set. In the case of cervical scrapings, an outlier spectrum can result from samples with less than an optimal number of cells, and/or specimens that are rich in blood, mucus and/or nondiagnostic debris.
- the reference set should be representative of all expected variations in the spectra.
- the infrared absorption data of all samples is then processed using methods such as, for example, classical methods of spectroscopic analysis or multivariate analysis.
- spectral characteristics as peak height, peak shape, peak area, peak intensity and ratios of these characteristics.
- the ratios may be taken between peak characteristics derived from the same peak or from peak characteristics derived from different peaks. Once a first ratio is taken, a second ratio may be taken between the first ratio and another spectral characteristic or the first ratio and another ratio of spectral characteristics.
- Other methods of data analysis of use in practicing the instant invention include, for example, the K-matrix, the P-matrix and linear discriminant analysis. Data analysis methods in addition to those enumerated above will be apparent to those of skill in the art.
- Multivariate analysis has been used to analyze biological samples.
- Robinson, et al. in U.S. Pat. No. 4,975,581 describe a quantitative method to determine the similarities of a biological analyte in known biological fluids using multivariate analysis.
- Robinson, et al. describes the in vivo evaluation of analytes in fluids, and uses noninvasive techniques. No accommodations are made to discriminate between solid biological material such as mammalian cells or to address the issues that can arise while discriminating the IR spectra of solid biological materials with varied path lengths outside the body. Nevertheless, multivariate analysis is a useful method of data analysis in the methods described and claimed herein.
- PCA Principal Component Analysis
- discriminate analysis has recently been employed to distinguish between normal and abnormal cervical scrapings. See, Ge, et al., Applied Spectroscopy 49:432-436 (1995). However, the methods described therein did not describe single-cell microscopy nor did it rely on the removal of interfering and nondiagnostic material from the cervical specimens. Further, Ge, et al. also relied on preprocessing algorithms that smoothed the spectra. Smoothing of spectra can obscure the subtle differences which exist between spectral patterns, and consequently can affect the discriminate analysis.
- Haaland, et al. in U.S. Pat. No. 5,596,992 (issued Jan. 28, 1997) teach the use of multivariate methods to detect differences between normal and malignant cell samples. Haaland, et al. do not describe any single-cell infrared microscopy. Further, Haaland, et al. teach that the spectra have to be preprocessed by linear base-line corrections and subtracting water vapor absorptions.
- PCR and PLS have been used in various fields of science and in many types of applications, these techniques have never been used to discriminate in the mid-infrared region of the spectra, chemical differences between single cells in diagnostic samples and single cells in reference samples. Both PCR and PLS can reduce massive amounts of data into sets that can be readily managed for analysis. More importantly, when these methods are used to evaluate the spectra of mammalian cells, the techniques analyze entire regions of a spectrum and allow discrimination between the spectra of different groups of specimens.
- the comparison of absorption data is typically carried out by a partial least squares (PLS) or principal component analysis (PCA) statistical method on data which can be preprocessed (i.e., smoothed and/or derivatized), but which is preferentially unsmoothed and underivatized.
- PLS partial least squares
- PCA principal component analysis
- comparisons using principle component regression (PCR) are carried out using PCA.
- PCA principle component regression
- PCR and PLS use a library of spectra derived from single cells of a reference cell sample to create a reference set, wherein each of the spectra are acquired under identical conditions.
- the data analysis techniques consist of spectral data compression (in the case of PCR, this step is known as PCA), and linear regression. Using a linear combination of factors or principal components, a reconstructed spectrum is derived. This reconstructed spectrum is compared with the spectra of unknown specimens which serves as the basis for classification.
- the predicted scores generated for individual cells are "averaged” over the sample.
- the "averaged” score from the individual cells over the sample are “averaged” over the collection of samples.
- the method of "averaging” can consist of simply taking the arithmetic mean of the predicted scores or can rely on other statistical methods for determining population distributions known in the art.
- the methods include, for example, determining the median and determining the mean of the predicted score population.
- the extent to which a population is scattered on either side of the determined center is assessed by establishing a measure of dispersion such as, for example, the standard deviation, the interquartile range, the range and the mean deviation.
- Other methods, of use in practicing the present invention, for establishing both the "average” value for the population of prediction scores and the extent of population scatter will be apparent to those of skill in the art.
- Another set of spectra of the same materials are typically used to validate and optimize the reference.
- This second set of spectra enhance the prediction accuracy of the PCR or PLS model by determining the rank of the model.
- the optimal rank is determined from a range of ranks by comparing the PCR or PLS predictions with known diagnoses. Increasing or decreasing the rank from what was determined optimal can adversely affect the PLS or PCR predictions. For example, as the rank is gradually decreased from optimal to suboptimal, PCR or PLS would account for less and less variations in the reference spectra. In contrast, a gradual increase in the rank beyond what was determined optimal would cause the PCR or PLS methodologies to model random variation rather than significant information in the reference spectra.
- PCR and PLS analysis measure the spectral noise level of unknown samples relative to the reference spectra.
- Biological samples are subject to numerous sources of perturbations. Some of these perturbations drastically affect the quality of spectra, and adversely influence the results of a "diagnosis". Consequently, it is preferable to distinguish between spectra that conform with the reference spectra, and those that do not (e.g. the outlier samples).
- the F-ratio is a powerful tool in detecting conformity or a lack of fit of a spectrum (sample) to the reference spectra. In general F-ratios considerably greater than those of the reference indicate "lack of fit" and should be excluded from the analysis.
- F-ratios can be calculated by the methods described in Haaland, et al., Anal. Chem. 60:1193-1202 (1988), and Cahn, et al., Applied Spectroscopy 42:865-872 (1988).
- the reference spectra should determine the range of variation allowed for a sample to be classified as a member of that reference, and should also include preprocessing algorithms to account for diversities in path length.
- One normalization approach that aids in the discrimination of cervical specimens is locating the maximum and minimum points in a spectral region, and resealing the spectrum so that the minimum remains at 0.0, and the maximum at 1.0 absorbance (e.g. in the frequency region between 3000 cm -1 to 950 cm -1 ).
- Another normalization procedure is to select a specific peak(s) at a certain frequency(ies) of the IR spectra, and relate all other peaks to the selected peak(s).
- a third type of normalization is to normalize the magnitude of the absorbance vector before processing.
- the techniques and methods of certain aspects and embodiments of the present invention combine the spatial resolution of single-cell microscopy with infrared spectroscopy's powerful ability to probe the chemical structure and/or environment of a sample.
- the methods of one aspect of the present invention are carried out using a beam of mid-infrared light which is directed through an aperture of individual cell size, thereby providing absorption data for single cells.
- the invention provides a method for detecting chemical differences between a cell sample and a reference cell sample, utilizing single-cell infrared microspectroscopy, the method comprising:
- the beam of infrared light is preferably directed from a source located within the spectrometer through the sample adsorbed onto an infrared-transparent matrix.
- the infrared light impinges on a detector, whereby the absorption data is produced.
- the absorption spectra for the reference sample is produced using a substantially similar method.
- the reference sample and the cells of interest are from human tissue.
- the tissue is isolated from the cervix.
- the beam of infrared light has a frequency of from about 3000 cm -1 to about 950 cm -1 .
- the cervical cells of the reference set are cytologically determined to correspond to a normal, malignant or premalignant phenotype.
- the cell sample is a cervical cell sample and the phenotype of the cells in the reference set is determined by standard methods (e.g., Pap cytology, biopsy, etc.).
- the comparison data is used to generate scores for the absorption data and the scores are then used to construct frequency distribution profiles.
- the scores are generated using multivariate analysis and the scores are predicted scores.
- the methods of classical spectroscopic analysis are utilized to generate the scores.
- the infrared spectra are generally collected at a resolution of from about 2 cm -1 to about 10 cm -1 , preferably from about 4 cm -1 to about 8 cm -1 . Additionally, a number of scans are taken and co-added. Preferably about 50-1000 scans are co-added, more preferably about 100-800 scans are co-added. In general, the spectra are normalized by setting the minimum absorbance at 0.0 and the maximum absorbance at 1.0 in the frequency regions between 3000 cm -1 to 950 cm -1 ; however, the techniques of the invention can be practiced without normalizing the spectra.
- the data is smoothed and/or derivatized; however, the invention can be practiced using spectral data which is unsmoothed and/or underivatized.
- the steps of smoothing and derivatizing can be carried out in any order.
- comparison of the absorption data and the reference absorption spectra is made using any technique or instrumentation known to those of skill in the art for comparing spectral data sets.
- comparison of the infrared absorption data for the sample and the data for the reference set utilizes principal component analysis in the frequency region of from about 3000 cm -1 to about 950 cm -1 .
- the comparison is conducted in the range of from about 1200 cm -1 to about 1000 cm -1 , more preferably in the frequency regions of from about 1250 cm -1 to about 1000 cm -1 , from about 1420 cm -1 to about 1330 cm -1 and from about 3000 cm -1 to about 2000 cm -1 .
- the spectral data is unsmoothed and underivatized.
- the data analysis technique utilizes multivariate analysis.
- the number of cells from which spectra are acquired is from about 10 to about 10 6 and is more preferably from about 10 to about 1000.
- the number of cell samples whose predicted scores constitute the calculated mean is preferably from about 2 to about 1000.
- the reference sample and the sample are substantially freed of non-diagnostic debris and dried on the infrared matrix prior to initiating the spectroscopic studies.
- the chemical differences arise as a result of a disease state in the cells or tissue being studied.
- the disease state is a malignancy or any of an array of diseases caused by a pathogen (e.g., bacteria, virus, fungus, etc.), an insult or a toxin, or can arise due to a genetic anomaly (e.g., cancer, multiple sclerosis, cystic fibrosis, etc.).
- a pathogen e.g., bacteria, virus, fungus, etc.
- an insult or a toxin e.g., cancer, multiple sclerosis, cystic fibrosis, etc.
- the chemical differences between the cells or tissues of interest and the reference sample are due to the therapeutic treatment of the disease state.
- the disease state is cancer or dysplasia.
- the invention provides a method for detecting chemical differences between a cell sample and a reference cell sample utilizing single-cell infrared microspectroscopy, the method comprising:
- the scores generated for individual cells are "averaged” over the sample to produce an averaged score.
- the scores are generated using the techniques of classical spectroscopic analysis or, preferably, multivariate analysis.
- using more than one cell sample the averaged score from each of the cell samples are averaged over the population of cell samples.
- the method of "averaging" can consist of simply taking the arithmetic mean of the predicted scores or can rely on other statistical methods for determining population distributions known in the art.
- the averaging is performed by taking the arithmetic mean.
- the extent to which a population is scattered on either side of the determined center is assessed by establishing a measure of dispersion such as, for example, the standard deviation, the interquartile range, the range and the mean deviation.
- a measure of dispersion such as, for example, the standard deviation, the interquartile range, the range and the mean deviation.
- the standard deviation serves as a measure of the scatter.
- the invention is a method for detecting chemical differences between a cell sample and a reference cell sample utilizing infrared spectroscopic imaging, the method comprising:
- sample preparation and data processing used in the imaging aspect of the invention are generally the same as those described above in connection with infrared microspectroscopy. Further, the different embodiments and uses of this aspect of the invention are generally similar to those detailed above.
- spectroscopic imaging acquires the data from a population of individual cells in a substantially simultaneous manner.
- substantially simultaneously refers to the ability of this aspect of the invention to acquire spectra for each of a collection of single cells in a cell sample at approximately the same time. This method stands in contrast to methods which use bulk spectroscopy and those aspects of the present invention utilizing single cell microspectroscopy.
- the spectra of a population of cells is taken simultaneously resulting in an average spectrum for all cells across the sample. Importantly, there is no method to deconvolute the resulting average spectrum to get information for individual cells.
- single-cell microspectroscopy the operator focuses the microscope on a single cell and acquires a spectrum from that cell; the operator then focuses on a second cell and acquires a spectrum for that cell. This process is continued until a spectrum set of the desired size is obtained.
- the microspectroscopic aspect of the present invention affords access to single cell spectroscopic data this technique is time consuming, particularly when multiple acquisitions are required to produce a spectrum.
- the imaging aspect of the present invention provides the capability to simultaneously collect spectra from all of the cells within a selected window of the sample (i.e., a portion of the sample) and to deconvolute the spectral data to arrive at spectra for each of the individual cells within the window.
- An additional advantage offered by the imaging aspect of the present invention is the ability to prepare reference sets of absorption spectra which consist entirely of spectra of diseased cells.
- a cytologist depends on the presence of a few abnormal cells (e.g., malignant, dysplastic, etc.) in a cell sample to arrive at a diagnosis of abnormality. Most often, the diagnosis is arrived at following examination of a cell sample which has been stained. Unstained cell samples, such as those preferred in practicing the instant invention, do not allow the ready differentiation between normal and abnormal cells achieved with stained cell samples. Thus, in the single cell microspectroscopic aspect of the invention, it is generally not possible to locate, with the microscope, the abnormal cells in a sample and construct a reference set of spectra from these cells.
- spectroscopic imaging when using spectroscopic imaging, a window of the sample is imaged and spectra from all of the cells within the window are acquired. Following imaging, the sample is stained and, using the stained sample as a "roadmap" the abnormal cells and their spectra are identified from among the cells in the cell sample and the corresponding collection of spectra, respectively.
- the imaging aspect of the invention can also be used for in vivo diagnosis of cellular chemical abnormality.
- the techniques used in this embodiment are generally the same as described above. Differences are in the fundamental approach of in vivo collection of data and the use of an optic fiber to direct the beam of mid- or near-infrared light.
- Typical optic fibers used for mid-infrared include chalcogenide and silver halide.
- a typical optical fiber for near-infrared use is quartz fiber.
- One advantage to in vivo analysis is that it directs the physician to the site of the anomalous tissue and minimizes the size of the tissue taken for biopsy. Moreover, this method can provide a rapid objective screening of patients in a doctor's office.
- the invention is a method for identifying women at high risk for developing cervical dysplasia utilizing single-cell infrared microspectroscopy, the method comprising:
- the reference set comprises absorption spectra from individual cervical cells in cervical cell reference samples taken from women having no history of dysplasia, each of the reference samples having a combination of individual cells exhibiting at least one first spectrum pattern and at least one second spectrum pattern differing from each other in either source or pattern.
- the techniques of sample preparation, data acquisition and data analysis discussed above in conjunction with the other aspects of the present invention are used in conjunction with this aspect of the invention and the preferred embodiments are generally the same as those detailed in conjunction with the other aspects of the invention.
- Both single cell microspectroscopic and spectroscopic imaging techniques are of use in conjunction with this aspect of the invention.
- the phenotype of the cells in the reference set is determined by standard methods (e.g., cervical biopsy, Pap cytology).
- the method uses infrared spectroscopy to generate the first and second spectrum patterns.
- the reference set of absorption spectra is selected from infrared spectra with patterns corresponding to those defined as Pattern I and Pattern II (FIGS.
- Examples 1-5 demonstrate the use of single-cell FT-IR microspectroscopy and the acquisition of spectra from single cells in a dried cervical cell sample to obtain data, subsequently processed by PCA and/or PLS.
- the processed data is used to construct distribution profiles for the spectra of phenotypically differentiated cells.
- the distribution profiles have a clearly demonstrable diagnostic utility and allow distinction between normal, normal-dysplastic, dysplastic and malignant cells.
- Example 1 illustrates the use of single-cell infrared microspectroscopy in conjunction with principal component analysis (PCA) to detect malignant and premalignant conditions in cervical cells.
- Example 2 demonstrates the construction of a reference set of IR spectra derived from cytologically normal cells which exhibit distinct spectral patterns (i.e, Pattern I and Pattern II).
- Example 3 demonstrates the construction of a reference set of IR spectra derived from cytologically normal cells exhibiting Pattern I spectra and cytologically dysplastic cells exhibiting Pattern II spectra.
- Example 4 illustrates a reference set composed of spectra from cytologically normal cells exhibiting Pattern I spectra and cytologically malignant cells exhibiting Pattern II spectra.
- Example 5 provides a reference set of IR spectra derived from cytologically normal cells with Pattern II spectra and cytologically malignant cells exhibiting Pattern II spectra.
- the reference set was compared to FT-IR spectra from cervical smears. The comparison was made using PLS and/or PCR.
- Examples 6-8 demonstrate that there exist clearly distinguishable IR spectroscopic differences between cytologically normal cells in a cervical smear diagnosed as "normal” and cytologically normal cells in a cervical smear diagnosed as “cancer” or "dysplasia.”
- a reference set is assembled from IR spectra of individual cells.
- Example 6 illustrates a reference set obtained from IR spectra of cytologically normal cells exhibiting Pattern I spectra and cytologically normal cells that were obtained from smears diagnosed as malignant which exhibited Pattern I spectra.
- Example 7 demonstrates a reference set composed of IR spectra from normal cells exhibiting Pattern II spectra and cytologically normal cells that were obtained from smears diagnosed as malignant exhibiting Pattern II spectra.
- Example 8 illustrates a reference set obtained from IR spectra of cytologically normal cells exhibiting Pattern II spectra and cytologically normal cells that were obtained from smears diagnosed as dysplasia which exhibited Pattern II spectra.
- This example illustrates the use of single cell infrared spectroscopy for the detection of malignant and premalignant conditions in cells.
- the present invention provides a novel method for the acquisition of spectra from cervical scrapings on a cell by cell basis.
- Cervical scrapings were collected by the standard brushing procedure. Exfoliated cells from each brush were gently shaken in vials which contained preservative solution (Preserv Cyt, CYTYC Corporation, Marlborough, Mass.). The preservative solution maintained the integrity of the exfoliated cells during transport and storage, and also served to lyse the red blood cells in the cervical scrapings. Vials containing the exfoliated cells were then treated with a CYTYC THIN PREP PROCESSOR®. The processor filtered out the mucus and non-diagnostic debris, and spread the cells in a uniform layer on the ZnS slides.
- preservative solution Preserv Cyt, CYTYC Corporation, Marlborough, Mass.
- Infrared microspectroscopy was performed on unstained exfoliated cells which were recorded for their position by a cellfinder.
- a cellfinder is a microscope slide with a numbered grid. In practice, the cellfinder overlays the cell sample slide providing a numbered grid over the cell sample. Locations on the cell sample can be reconstructed using the grid and its numbering system. Thereafter the slides were stained by the Papanicolaou stain, and were cytologically examined. The results of spectroscopy were then correlated with the cytological findings.
- FIG. 1 shows the spectra of the two squamous cells. Squamous cells that had the typical spectrum of normal cells are referred to as Population 1, and those that lacked the 1025 cm -1 band characteristic for glycogen are referred to as Population 2.
- the parabasal cells which are normally found in abundance in the cervical scrapings of menopausal patients with estrogen deficiency e.g. a condition referred to as atrophic
- atrophic a condition referred to as atrophic
- FIG. 4 provides a comparison of the spectra of parabasal cells and endocervical cells.
- Example 2 shows the construction of a reference set of IR spectra derived from diagnostically normal cells which exhibit distinct spectral patterns (Pattern I, Pattern II).
- smears were classified in one of four diagnostic categories as follows: 1) the smears which were obtained from women with no present or past cervical disease, and which exhibited no morphological abnormality were labeled "normal”; 2) the smears which were acquired from patients with a history of dysplasia, and exhibited no morphological abnormality were labeled "normal-dysplasia”; 3) the smears which exhibited morphological changes associated with neoplasia, but showed no evidence of cancer were labeled "dysplasia”; and 4) those which displayed evidence of carcinoma in situ or cancer were labeled "malignant".
- the PLS plus® computer program from Galactic Industries was used to evaluate the spectra of individual cells by different multivariate techniques such as Partial Least Squares (PLS) and Principle Component Regression (PCR). All spectra were normalized to have the minimum and the maximum absorbance set at 0.0 and 1.0, respectively. Normalization was confined to the region between 1000 cm -1 and 3000 cm -1 , because most of the spectral changes between the normal and abnormal cervical specimens appeared in this region. Unless otherwise indicated, two spectral regions were utilized in the PCR or the PLS analysis. These regions included the frequency zones between 1200 cm -1 to 1000 cm -1 , and 3000 cm -1 to 2800 cm -1 .
- the first rank that fell below the cut off probability level of 0.75 in the F test of significance was selected as the optimal rank for the analysis (PLSplusTM Add-on Application Software manual for GRAMS/386TM pages 55-56, Galactic Industries Corporation, Salem, N.H.).
- Pattern I was characterized by a prominent band peaking at around 1025 cm -1 , and additional discrete bands peaking at around 1080 cm -1 , 1160 cm -1 , and a broad peak at around 1250 cm -1 .
- Pattern II was characterized by a significant reduction in the amplitude of the 1025 cm -1 band, which had now lost its peak, and broadening of the 1080 cm -1 , and 1160 cm -1 bands; the 1250 cm -1 band maintained the features of the corresponding band in Pattern I (See FIG. 6). All other spectra appeared either atypical or as a hybrid of "Pattern I" and the "Pattern II" spectra.
- Reference Set I was comprised of two spectral patterns, each derived exclusively from a cytologically "normal" smear.
- One reference included a subset of normal cells that exhibited the Pattern I spectra, and the other reference was from a subset of normal cells that yielded the Pattern II spectra.
- the spectra exhibiting Pattern I were assigned a dummy variable of 0, and those exhibiting Pattern II were assigned a dummy variable of 1.
- a rank of 3 was selected for discrimination purposes. This rank was the first rank that fell below the cut off probability level of 0.75 in the F test of significance.
- FIG. 7 is a histogram representation of one of the data sets in Table 1.
- the x axis shows equally divided intervals, while a left and a right y axis indicate the frequency and the cumulative percentage of the predicted scores within the x intervals, respectively.
- FIG. 8 summarizes the histogram computations at the 0.5 cut off interval based on the cumulative percentages of the predicted scores for all smears.
- the data clearly shows that at the 0.5 cut off interval there exists no overlap between the percent cumulative predicted scores from "normal” smears, and smears that were diagnosed with "dysplasia” or cancer. However, some overlap does exist between the percent cumulative predicted scores of the dysplasia and cancer smears with smears that were classified "normal-dysplasia". Included in FIG. 8 one also finds the mean, and the standard error of the mean for the predicted scores (i.e., in the four groups of smears) in each diagnostic category.
- Example 3 demonstrates the construction of a reference set of IR spectra derived from normal cells exhibiting Pattern I spectra and dysplastic cells exhibiting Pattern II spectra.
- Example 3 The materials and methods used in Example 3 are substantially the same as those described in Example 2.
- Reference set II was comprised from two reference spectra.
- One reference included a subset of cytologically normal single cells that exhibited the Pattern I spectra, and that were derived from smears which were diagnosed "normal".
- the second reference included a subset of cytologically normal single cells that exhibited the Pattern II spectra, but which were derived from smears that were cytologically classified with "dysplasia”.
- These reference spectra were selected at random and from different normal and dysplasia smears to ensure a thorough representation of the two spectral patterns.
- the spectra exhibiting Pattern I were assigned a dummy variable of 0, and the spectra exhibiting Pattern II were assigned a dummy variable of 1. Only one spectral region was utilized in the PCR or the PLS analysis. This frequency region included the zone between 1200 cm -1 to 1000 cm -1 . For discrimination purposes, a rank of 6 was selected for the analysis.
- Tables 3 through 6 show a series of discrete data based on computations made by PLS using reference set II as the reference spectra. Each data set represents one smear, and summarizes the distribution of predicted scores within that smear. Table 7 furnishes the mean and the standard deviation of the predicted scores that were computed for each smear. Statistical analysis of the data indicates a significant difference in the mean of the predicted scores of normal specimens relative to the specimens with dysplasia or cancer. A comparison of PLS results using reference set II versus reference set I also revealed a wider spread in the means of the predicted scores of the normal cervical smears relative to the smears with dysplasia or cancer.
- Example 4 illustrates a reference set composed of spectra from normal cells exhibiting Pattern I spectra and malignant cells with Pattern II spectra.
- Reference set III was comprised of two reference spectra.
- One reference spectrum included a subset of cytologically normal single cells that exhibited the Pattern I spectra, and that were derived from the cytologically diagnosed smears labeled "normal".
- the second reference spectrum included a subset of cytologically normal single cells which exhibited the Pattern II spectra, and which were derived from smears which were cytologically diagnosed as "malignant”. These reference spectra were selected at random; each was from different normal and malignant smears, to ensure a thorough representation of the two spectral patterns.
- the spectra exhibiting Pattern I were assigned a dummy variable of 0, and the spectra exhibiting Pattern II were assigned a dummy variable of 1. For final analysis, a rank of 6 was selected for discrimination purposes.
- FIG. 10 summarizes the histogram computations at the 0.5 cut off interval based on the cumulative percentages of the predicted scores for all smears. The data clearly shows that at the 0.5 cut off interval there exists no overlap between the percent cumulative predicted scores of "normal” smears, and the smears which were diagnosed with "dysplasia” and cancer. Also provided in FIG. 10 are the means and the standard deviations of the predicted scores for the four groups of smears.
- Example 5 illustrates a reference set of IR spectra derived from cytologically normal single cells in smears diagnosed as normal with Pattern II spectra and cytologically normal cells in smears diagnosed as malignant exhibiting Pattern II spectra.
- FIG. 11 summarizes the histogram computations at the 0.5 cut off interval for all smears.
- the following examples illustrate how single cell infrared spectroscopy based on the distribution of predicted scores generated by PLS or PCR can be used to distinguish normal cervical smears from smears with dysplasia and cancer.
- Example 6 The materials and methods used in Example 6 are substantially the same as those described in Example 2. Differences include slight changes in the spectroscopic method, the classification of the cells and the assignment of IR spectroscopic absorption bands.
- smears Two separate smears were prepared from each cell suspension with a CYTYC THIN PREP PROCESSOR® (CYTYC Corporation, Malborough, Mass.). One smear was evaluated by conventional Papanicaloau staining, and the other by infrared microspectroscopy. On the basis of Pap evaluation, smears were classified in one of three diagnostic categories as follows: The smears which were obtained from women with no present or past cervical disease, and which exhibited no morphological evidence of disease were labeled "normal”. The smears which exhibited changes associated with neoplasia, but showed no evidence of cancer were labeled "dysplasia", and those which displayed evidence of carcinoma in situ or cancer were labeled "malignant".
- Reference Set I was constructed from two categories of reference spectra with all the spectra exhibiting the typical Pattern I spectral features.
- Category 1 consisted of only those spectra which were acquired from cytologically normal single cells from Pap smears which were diagnosed as "normal”, and with the smears originating from women who had no prior history of cervical disease.
- Category 2 consisted of spectra of cytologically normal single cells which were obtained from smears diagnosed with "cancer,” and with the smears originating from women confirmed to suffer from cervical malignancy.
- the spectra in category 1 were assigned a dummy variable of 0, and those in category 2 were assigned a dummy variable of 1.
- a rank of 9 was selected for discrimination purposes. The rank of 9 was the first rank which fell below the cut off probability level of 0.75 in the F test of significance.
- the spectra from different smears were evaluated by PLS and PCR. PLS and PCR generated a predicted score for each cell that was analyzed. These predicted scores (i.e, excluding the scores of the outlier cells) were then averaged to yield one score for every smear which was analyzed.
- Table 8 shows a series of discrete data which represent the average score of each of the 12 smears which were evaluated (i.e., 4 normal, 4 dysplasia, and 4 cancer). Mean and standard deviations were then computed based on these scores for each of the diagnostic categories.
- FIG. 12 shows three normal distribution curves which were generated from these means and standard deviations. The curve on the left represents the distribution of these scores in the normal smears, the curves at the center and at the right represent the same in the dysplasia and cancer smears, respectively.
- Example 7 The materials and methods used in Example 7 were substantially the same as those used in Example 6.
- Reference Set II was constructed from two categories of reference spectra with all the spectra exhibiting the typical Pattern II spectral features.
- Category 1 consisted of only those spectra which were acquired from cytologically normal single cells from Pap smears which were diagnosed as "normal”, and with the smears originating from women who had no prior history of cervical disease.
- Category 2 consisted of spectra of cytologically normal single cells which were obtained from smears diagnosed with "cancer”, and with the smears originating from women which were confirmed to have cervical cancer.
- the spectra in category 1 were assigned a dummy variable of 0, and the spectra in category II were assigned a dummy variable of 1.
- a rank of 6 was selected for discrimination purposes. The rank of 6 was the first rank which fell below the cut off probability level of 0.75 in the F test of significance.
- the spectra from different smears were, once again, evaluated by PLS and PCR.
- PLS and PCR generated a predicted score for each cell, and these predicted scores (i.e, excluding the scores of the outlier cells) were then averaged to yield one score for every smear which was analyzed.
- Table 9 shows a series of discrete data which represent the average score of each of the 12 smears which were evaluated (i.e., 4 normal, 4 dysplasia, and 4 cancer). Mean and standard deviations were computed as before for each of the diagnostic categories.
- FIG. 13 shows three normal distribution curves which were generated from these means and standard deviations. The curve on the left represents the distribution of these scores in the normal smears; the curves at the center and at the right represent the same in the dysplasia and cancer smears, respectively.
- Example 8 The materials and methods used in Example 8 are substantially the same as those used in Example 6.
- Reference Set m was constructed from two categories of reference spectra with all the spectra exhibiting the typical Pattern II spectral features.
- Category 1 consisted of only those spectra which were acquired from cytologically normal single cells from Pap smears which were diagnosed as "normal”, and with the smears originating from women who had no prior history of cervical disease.
- Category 2 consisted of spectra of cytologically normal single cells which were obtained from smears diagnosed with "dysplasia", and with the smears originating from women which were confirmed by biopsy to have cervical dysplasia.
- the spectra in category 1 were assigned a dummy variable of 0
- the spectra in category II were assigned a dummy variable of 1.
- the rank of S was the first rank which fell below the cut off probability level of 0.75 in the F test of significance.
- Table 10 shows a series of discrete data which represent the average score of each of the 12 smears which were evaluated (i.e., 4 normal, 4 dysplasia, and 4 cancer).
- FIG. 14 depicts the normal distribution for the three categories of smear; normal, dysplasia and cancer. Once again, the curve at the left represents the distribution of normal smears; and the curves at the center and the right represent spectral data from the dysplasia and cancer smears, respectively.
- the method of the instant invention provide a means with which to distinguish cytologically "normal” cells which are, in fact, “chemically normal” as well from those cells which are cytologically "normal,” but “chemically aberrant.”
- the IR microspectroscopic methods as practiced herein can not only indicate which women are at risk of cervical cancer, but can also assess the degree of this risk, i.e., low versus high risk for cervical cancer.
- the present invention provides substantially novel methods for detecting chemical differences between cell types and for distinguishing between normal and diseased cell samples. While specific examples have been provided, the above description illustrative and not restrictive. Many variations of the disclosed methods will be apparent to those of skill in the art upon review of this specification. The scope of the invention should, therefore, be determined not with the reference to the above description, but instead should be determined with reference to the appended claims along with their full scope of equivalents.
Abstract
Description
                                  TABLE 1
__________________________________________________________________________
DISTRIBUTION OF PREDICTED SCORES IN CERVICAL SMEARS DIAGNOSED NORMAL
 OR NORMAL DYSPLASIA USING CALIBRATION SET I
        No. 1    No. 2    No. 3    No. 4
        Frequency
             Cum %
                 Frequency
                      Cum %
                          Frequency
                               Cum %
                                   Frequency
                                        Cum %
__________________________________________________________________________
Normal
  Specimen
  Interval
  -0.3 1 0.95 0 0.00 0 0 0 0
  -0.2 8 8.57 2 2.04 0 0 7 7
  -0.1 5 13.33 8 8.16 3 3 8 15
  0 3 18.19 3 11.22 15 18 5 20
  0.1 4 20.00 0 11.22 8 26 5 25
  0.2 3 22.88 5 18.33 5 31 3 28
  0.3 3 25.71 8 22.45 3 34 7 35
  0.4 3 28.51 5 27.55 8 40 3 38
  0.5 4 32.38 10 31.76 3 43 5 43
  0.6 15 48.87 19 57.14 8 51 12 55
  0.7 27 72.38 23 80.81 21 72 22 77
  0.8 28 99.05 19 100.00 27 99 23 100
  0.9 1 100.00   1 100
  Total 105  98  100  100
__________________________________________________________________________
  Normal-Dysplasia
  Specimen
  Interval
  -0.1 4 4.08 8 8.12 2 2.04 5 5.26
  0 1 5.10 10 16.33 7 9.18 15 21.05
  0.1 0 5.10 8 24.49 4 13.27 7 28.42
  0.2 4 9.18 10 34.89 3 16.33 4 32.83
  0.3 0 9.18 8 42.88 4 20.41 3 35.79
  0.4 2 11.22 8 51.02 8 26.53 1 36.84
  0.5 1 12.24 5 58.12 5 31.63 4 41.05
  0.6 3 15.31 8 64.29 11 42.88 3 44.21
  0.7 17 32.85 15 79.59 19 62.24 13 57.89
  0.8 85 98.98 20 100.00 37 100.00 36 95.79
  0.9 1 100.00     4 100.00
  Total 98  98  98  95
__________________________________________________________________________
                                  TABLE 2
__________________________________________________________________________
DISTRIBUTION OF PREDICTED SCORES IN MALIGNANT AND DYSPLASTIC CERVICAL
 SMEARS USING CALIBRATION SET I
        No. 1    No. 2    No. 3    No. 4
        Frequency
             Cum %
                 Frequency
                      Cum %
                          Frequency
                               Cum %
                                   Frequency
                                        Cum %
__________________________________________________________________________
Cancer
  Specimen
  Interval
  -0.1 0 0.00 0 0 0 0.00 0 0
  0 1 1.01 0 0 0 0.00 0 0
  0.1 2 3.03 3 3 1 1.00 0 0
  0.2 2 5.05 2 5 2 3.23 1 1
  0.3 9 14.14 4 9 3 6.45 0 1
  0.4 8 20.20 7 16 1 7.53 1 1
  0.5 7 27.27 9 25 2 9.88 8 7
  0.6 10 37.37 8 33 4 13.88 2 9
  0.7 21 58.59 23 56 20 35.48 20 29
  0.8 41 100.00 42 98 56 95.70 85 94
  0.0   2 100 4 100.00 8 100
  Total 99  100  93  100
  Dysplasia
  Specimen
  Interval
  -0.2 0 0.00 0 0.00 0 0.00 0 0.00
  -0.1 1 0.88 1 1.28 3 2.88 5 0.00
  0 0 0.98 0 1.25 8 8.57 1 1.01
  0.1 0 0.88 2 3.75 3 11.43 0 1.01
  0.2 0 0.88 2 8.25 4 15.24 0 1.01
  0.3 2 2.94 3 10.00 3 18.10 1 2.02
  0.4 4 6.88 2 12.50 2 20.00 2 4.04
  0.5 1 7.84 3 18.28 5 24.78 3 7.07
  0.6 11 18.83 8 23.75 20 43.81 3 10.10
  0.7 37 54.90 26 88.28 34 76.19 28 38.38
  0.8 48 100.00 33 97.80 28 100.00 81 100.00
  0.9   2 100.00 0
  Total 102  80  105  99
__________________________________________________________________________
                                  TABLE 3
__________________________________________________________________________
DISTRIBUTION OF PREDICTED SCORES IN MALIGNANT CERVICAL SMEARS
  USING CALIBRATION SET II
    Sample No. 1
              Sample No. 2
                        Sample No. 3
                                  Sample No. 4
Interval
    Frequency
         Cum %
              Frequency
                   Cum %
                        Frequency
                             Cum %
                                  Frequency
                                       Cum %
__________________________________________________________________________
-0.1
    0    0    0    0    1    1.086957
                                  0    0
  0 0 0 0 0 0 1.086957 0 0
  0.1 6 8.185567 3 3.030303 1 2.173913 0 0
  0.2 3 9.278351 2 5.050505 1 3.26087 0 0
  0.3 9 18.5567 8 13.13131 0 3.26087 1 1.06383
  0.4 4 22.68041 4 17.17172 1 4.347626 0 1.06383
  0.5 4 26.80412 6 23.23232 4 8.695652 3 4.255319
  0.6 6 32.98969 9 32.32323 1 9.782609 3 7.446809
  0.7 16 49.48454 12 44.44444 6 16.30435 3 10.6383
  0.8 30 80.41237 36 80.80808 14 31.52174 15 26.59574
  0.9 12 92.78351 12 92.92929 31 65.21739 24 52.12766
  1 1 93.81443 5 97.9798 17 83.69565 29 82.97672
  1.1 4 97.93614 0 97.9798 10 94.56522 11 94.68085
  1.2 1 98.96907 2 100 2 96.73913 5 100
  1.3 1 100 0 100 1 97.82609 0 100
  1.4 0 100 0 100 0 97.82609 0 100
  1.5 0 100 0 100 1 98.91304 0 100
  1.6 0 100 0 100 1 100 0 100
  Total 97  99  92  94
__________________________________________________________________________
                                  TABLE 4
__________________________________________________________________________
DISTRIBUTION OF PREDICTED SCORES IN DYSPLASTIC CERVICAL SMEARS
  USING CALIBRATION SET II
    Sample No. 1
              Sample No. 2
                        Sample No. 3
                                  Sample No. 4
Interval
    Frequency
         Cum %
              Frequency
                   Cum %
                        Frequency
                             Cum %
                                  Frequency
                                       Cum %
__________________________________________________________________________
-0.2
    0    0    0    0    0    0    1    1.111111
  -0.1 0 0 0 0 1 0.952381 0 1.111111
  0 0 0 0 0 1 1.904762 0 1.111111
  0.1 1 1 0 0 2 3.809524 0 1.111111
  0.2 1 2 0 0 6 9.52381 0 1.111111
  0.3 0 2 1 1.298701 5 14.28571 0 1.111111
  0.4 0 2 2 3.896104 3 17.14286 2 3.333333
  0.5 1 3 3 7.792208 5 21.90476 1 4.444444
  0.6 4 7 7 16.88312 7 28.57143 2 6.666667
  0.7 13 20 7 25.97403 14 41.90476 4 11.11111
  0.8 41 61 23 55.84416 22 62.85714 10 22.22222
  0.9 34 95 19 80.51948 28 89.52381 23 47.77778
  1 4 99 9 92.20779 4 93.33333 26 76.66667
  1.1 1 100 4 97.4026 3 96.19048 15 93.33333
  1.2 0 100 1 98.7013 1 97.14286 4 97.77778
  1.3 0 100 1 98.7013 2 99.04762 2 100
  1.4 0 100 1 98.7013 0 99.04762 0 100
  1.5 0 100 1 98.7013 0 99.04762 0 100
  1.6 0 100 1 98.7013 1 100 0 100
  1.7 0 100 1 98.7013 0 100 0 100
  1.8 0 100 1 98.7013 0 100 0 100
  1.9 0 100 1 98.7013 0 100 0 100
  2 0 100 0 98.7013 0 100 0 100
  2.1 0 100 1 100 0 100 0 100
  Total 100  77  105  90
__________________________________________________________________________
                                  TABLE 5
__________________________________________________________________________
DISTRIBUTION OF PREDICTED SCORES IN NORMAL CERVICAL SMEARS
  USING CALIBRATION SET II
    Sample No. 1
              Sample No. 2
                        Sample No. 3
                                  Sample No. 4
Interval
    Frequency
         Cum %
              Frequency
                   Cum %
                        Frequency
                             Cum %
                                  Frequency
                                       Cum %
__________________________________________________________________________
-0.3
    3    2.941176
              4    4.123711
                        1    1.010101
                                  1    1.041667
  -0.2 2 4.901961 1 5.154839 3 4.040404 2 3.125
  -0.1 6 10.78431 5 10.30928 6 10.10101 6 9.375
  0 9 19.60784 1 11.34021 7 17.17172 5 14.58333
  0.1 3 22.54902 5 16.49485 9 26.26263 3 17.70833
  0.2 3 25.4902 5 21.64948 8 34.34343 5 22.91667
  0.3 1 26.47059 6 27.83505 10 44.44444 9 32.29167
  0.4 2 28.43137 3 30.92784 3 47.47475 5 37.5
  0.5 5 33.33333 5 36.08247 4 51.51515 9 48.875
  0.6 5 38.23529 26 62.8866 5 56.56566 8 55.20833
  0.7 22 59.80392 22 85.56701 9 65.65657 22 78.125
  0.8 20 79.41176 7 92.78351 26 91.91919 17 95.83333
  0.9 18 97.05882 4 96.90722 8 97.9798 2 97.91667
  1 3 100 3 100 2 100 2 100
  Total 102  97  99  96
__________________________________________________________________________
                                  TABLE 6
__________________________________________________________________________
DISTRIBUTION OF PREDICTED SCORES IN NORMAL AND DYSPLASTIC CERVICAL SMEARS
 USING CALIBRATION SET II
    Sample No. 1
              Sample No. 2
                        Sample No. 3
                                  Sample No. 4
Interval
    Frequency
         Cum %
              Frequency
                   Cum %
                        Frequency
                             Cum %
                                  Frequency
                                       Cum %
__________________________________________________________________________
-0.6
    0    0    1    1.030928
                        0    0    0    0
  ..0.5 0 0 1 2.061856 0 0 0 0
  ..1.4 0 0 1 3.092784 1 1.041667 0 0
  ..0.3 0 0 2 5.154639 2 3.125 1 1.086957
  ..0.2 2 2.105263 4 9.278351 3 6.25 1 2.173913
  ..0.1 2 4.210528 9 18.5567 4 10.41687 7 9.782609
  0 2 6.315789 9 27.83505 2 12.5 8 18.47820
  0.1 3 9.472684 12 40.20619 8 20.83333 6 25
  0.2 1 10.52832 6 46.39175 7 28.125 4 29.34783
  0.3 0 10.52632 9 55.6701 8 36.45833 6 35.86957
  0.4 2 12.63158 11 67.01031 2 38.54167 1 38.95852
  0.5 4 18.84211 4 71.13402 6 44.79167 5 42.3913
  0.6 5 22.10526 8 79.38144 13 58.3333 1 43.47826
  0.7 15 37.89474 11 90.72165 16 75 16 60.86957
  0.8 38 77.89474 5 95.87629 11 86.45833 21 83.69565
  0.9 14 92.63158 3 98.96907 9 95.83333 13 97.82609
  1 5 97.89474 1 100 3 98.95833 2 100
  1.1 2 100 0 100 1 100 0 100
  Total 95  97  96  92
__________________________________________________________________________
                                  TABLE 7
__________________________________________________________________________
STATISTICAL ANALYSIS OF PREDICTED SCORES GENERATED BY CALIBRATION SET II
     # of Spectra
             Average of
                   Std. Deviation of
                           Std. Error
  Sample With Acceptable Predicted Predicted Scores of the Mean Ave. of
                                           STDEV of
  Numbers F-ratio Scores STDEV SEM Means Means SEM
__________________________________________________________________________
NORMAL CERVICAL SAMPLES
1    102     0.5032
                   0.3742  0.037051
                                 0.445558
                                      0.042731
                                           0.021366
  2 97 0.44248 0.31467 0.03195
  3 99 0.40015 0.3567 0.036051
  4 96 0.4384 0.31748 0.032403
CERVICAL SMEARS WITH DYSPLASTIC
1    100     0.75953
                   0.1262  0.01262
                                 0.772033
                                      0.08356
                                           0.04178
  2 77 0.779 0.22067 0.025148
  3 105 0.673 0.282 0.02752
  4 90 0.6766 0.2024 0.021335
CERVICAL SMEARS WITH CANCER
1    97      0.6178
                   0.26742 0.027152
                                 0.741433
                                      0.130744
                                           0.065372
  2 99 0.64143 0.23425 0.023543
  3 92 0.831 0.233 0.024292
  4 94 0.8755 0.15946 0.016447
CERVICAL SMEARS WITH NORMAL DYSPLASTIC
1    95      0.6463
                   0.26262 0.028996
                                 0.444768
                                      0.168378
                                           0.084189
  2 97 0.234746 0.35617 0.036164
  3 96 0.438908 0.355538 0.036287
  4 92 0.481121 0.361554 0.037695
__________________________________________________________________________
              TABLE 8
______________________________________
Slides      Normal     Dysplasia  Cancer
______________________________________
1           0.36219    0.41582    1.090887
  2 0.427498 0.489598 1.174956
  3 0.289767 0.524743 0.940745
  4 0.242362 0.51772 0.80367
  Mean 0.330454 0.48697 1.002565
  Std. Dev. 0.081323 0.049805 0.164216
______________________________________
              TABLE 9
______________________________________
Slides      Normal     Dysplasia  Cancer
______________________________________
1           -0.0027    0.318      0.557
  2 -0.102 0.213 0.745
  3  0.127 0.349 0.847
  4 -0.0158 0.435 0.9818
  Mean  0.001625 0.32875 0.7827
  Std. Dev.  0.09448 0.091675 0.179013
______________________________________
              TABLE 10
______________________________________
Slides      Normal     Dysplasia  Cancer
______________________________________
1           0.201779   0.787387   0.920703
  2 0.582902 0.701948 0.87411
  3 0.251409 0.671977 0.930559
  4 0.330684 0.711378 0.996935
  Mean 0.341694 0.718173 0.930577
  Std. Dev. 0.169342 0.049106 0.505627
______________________________________
Claims (40)
Priority Applications (1)
| Application Number | Priority Date | Filing Date | Title |
|---|---|---|---|
| US08/851,776 US6146897A (en) | 1995-11-13 | 1997-05-06 | Method for the detection of cellular abnormalities using Fourier transform infrared spectroscopy |
Applications Claiming Priority (3)
| Application Number | Priority Date | Filing Date | Title |
|---|---|---|---|
| US08/558,130 US6031232A (en) | 1995-11-13 | 1995-11-13 | Method for the detection of malignant and premalignant stages of cervical cancer |
| US08/747,375 US5976885A (en) | 1995-11-13 | 1996-11-12 | Method for the detection of cellular abnormalities using infrared spectroscopic imaging |
| US08/851,776 US6146897A (en) | 1995-11-13 | 1997-05-06 | Method for the detection of cellular abnormalities using Fourier transform infrared spectroscopy |
Related Parent Applications (1)
| Application Number | Title | Priority Date | Filing Date |
|---|---|---|---|
| US08/747,375 Continuation-In-Part US5976885A (en) | 1995-11-13 | 1996-11-12 | Method for the detection of cellular abnormalities using infrared spectroscopic imaging |
Publications (1)
| Publication Number | Publication Date |
|---|---|
| US6146897A true US6146897A (en) | 2000-11-14 |
Family
ID=46254469
Family Applications (1)
| Application Number | Title | Priority Date | Filing Date |
|---|---|---|---|
| US08/851,776 Expired - Lifetime US6146897A (en) | 1995-11-13 | 1997-05-06 | Method for the detection of cellular abnormalities using Fourier transform infrared spectroscopy |
Country Status (1)
| Country | Link |
|---|---|
| US (1) | US6146897A (en) |
Cited By (58)
| Publication number | Priority date | Publication date | Assignee | Title |
|---|---|---|---|---|
| US6270986B1 (en) * | 1999-02-16 | 2001-08-07 | Patrick T. T. Wong | Method of preserving biological tissue specimens and method of infrared spectroscopic analysis which avoids the effects of polymorphs |
| US6385484B2 (en) * | 1998-12-23 | 2002-05-07 | Medispectra, Inc. | Spectroscopic system employing a plurality of data types |
| US6385474B1 (en) * | 1999-03-19 | 2002-05-07 | Barbara Ann Karmanos Cancer Institute | Method and apparatus for high-resolution detection and characterization of medical pathologies |
| US6427082B1 (en) * | 1998-12-23 | 2002-07-30 | Medispectra, Incorporated | Optical methods and systems for rapid screening of the cervix |
| WO2002084261A2 (en) * | 2001-04-11 | 2002-10-24 | Rio Grande Medical Technologies, Inc. | Optically similar reference samples and related methods for multivariate calibration models used in optical spectroscopy |
| US20020164810A1 (en) * | 2000-12-05 | 2002-11-07 | Vysis | Method and system for diagnosing pathology in biological samples by detection of infrared spectral markers |
| US20030025582A1 (en) * | 2001-07-23 | 2003-02-06 | Winfried Arz | Magnetic resonance tomography apparatus having damping laminated sheets for reducing vibrations |
| WO2003031954A1 (en) | 2001-10-08 | 2003-04-17 | Inlight Solutions, Inc. | Classification of samples |
| US6620621B1 (en) * | 1995-11-13 | 2003-09-16 | Digilab | Method for the detection of cellular abnormalities using fourier transform infrared spectroscopy |
| US20030227612A1 (en) * | 2002-06-10 | 2003-12-11 | Howard Fein | Imaging system for examining biological material |
| US20040093166A1 (en) * | 2002-09-13 | 2004-05-13 | Kil David H. | Interactive and automated tissue image analysis with global training database and variable-abstraction processing in cytological specimen classification and laser capture microdissection applications |
| US20040094715A1 (en) * | 1998-07-14 | 2004-05-20 | Lewis E. Neil | High-throughput infrared spectroscopy |
| US6743637B2 (en) * | 1999-05-10 | 2004-06-01 | Tomoya Sato | Disease type and/or condition determination method and apparatus and drug screening method and apparatus |
| US6768918B2 (en) | 2002-07-10 | 2004-07-27 | Medispectra, Inc. | Fluorescent fiberoptic probe for tissue health discrimination and method of use thereof |
| US6818903B2 (en) | 2002-07-09 | 2004-11-16 | Medispectra, Inc. | Method and apparatus for identifying spectral artifacts |
| US6826422B1 (en) | 1997-01-13 | 2004-11-30 | Medispectra, Inc. | Spectral volume microprobe arrays |
| WO2005017501A1 (en) * | 2003-08-14 | 2005-02-24 | National Research Council Of Cananda | Method of diagnosing colorectal adenomas and cancer using infrared spectroscopy |
| US20050080405A1 (en) * | 2003-03-26 | 2005-04-14 | Bischof John C. | Thermal surgical procedures and compositions |
| US20050280813A1 (en) * | 2004-06-16 | 2005-12-22 | Jones Howland D T | Infrared spectroscopy as an assist for cytological investigation |
| US20060122588A1 (en) * | 2002-06-13 | 2006-06-08 | Regents Of The University Of Minnesota | Cryosurgery compositions and methods |
| US7136518B2 (en) * | 2003-04-18 | 2006-11-14 | Medispectra, Inc. | Methods and apparatus for displaying diagnostic data |
| US20060282223A1 (en) * | 2004-10-15 | 2006-12-14 | Lewis E N | Pharmaceutical mixture evaluation |
| US20070025606A1 (en) * | 2005-07-27 | 2007-02-01 | Bioimagene, Inc. | Method and system for storing, indexing and searching medical images using anatomical structures of interest |
| US20110317158A1 (en) * | 2008-12-18 | 2011-12-29 | Lyng Fiona M | Cytological method for analyzing a biological sample by raman spectroscopy |
| US8502148B2 (en) | 2010-11-16 | 2013-08-06 | Matthias Wagner | Single particle QCL-based mid-IR spectroscopy system with analysis of scattering |
| US8614419B2 (en) | 2008-03-28 | 2013-12-24 | The Ohio State University | Rapid diagnosis of a disease condition using infrared spectroscopy |
| US8715955B2 (en) | 2004-09-09 | 2014-05-06 | Life Technologies Corporation | Laser microdissection apparatus and method |
| US8722357B2 (en) | 2001-11-05 | 2014-05-13 | Life Technologies Corporation | Automated microdissection instrument |
| US8822928B2 (en) | 2008-03-28 | 2014-09-02 | The Ohio State University | Rapid diagnosis of a disease condition using infrared spectroscopy |
| US20140270457A1 (en) * | 2013-03-15 | 2014-09-18 | The Board Of Trustees Of The University Of Illinois | Stain-free histopathology by chemical imaging |
| WO2015085056A1 (en) * | 2013-12-05 | 2015-06-11 | Georgia State University Research Foundation, Inc. | Early detection of cell activation by atr-ftir |
| WO2016016531A1 (en) * | 2014-07-29 | 2016-02-04 | Universite De Reims Champagne-Ardenne | Method for detecting and quantifying fibrosis |
| WO2017042579A1 (en) * | 2015-09-10 | 2017-03-16 | Beamline Diagnostics Ltd | Method, computer programme and system for analysing a sample comprising identifying or sorting cells according to the ftir spectrum each cell produces |
| US9763641B2 (en) | 2012-08-30 | 2017-09-19 | Delphinus Medical Technologies, Inc. | Method and system for imaging a volume of tissue with tissue boundary detection |
| US9835552B2 (en) | 2010-11-16 | 2017-12-05 | 1087 Systems, Inc. | Cytometry system with interferometric measurement |
| US10016159B2 (en) | 2014-10-24 | 2018-07-10 | Koninklijke Philips N.V. | Determination of TGF-β pathway activity using unique combination of target genes |
| US10123770B2 (en) | 2013-03-13 | 2018-11-13 | Delphinus Medical Technologies, Inc. | Patient support system |
| US10143443B2 (en) | 2014-05-05 | 2018-12-04 | Delphinus Medical Technologies, Inc. | Method for representing tissue stiffness |
| US10156501B2 (en) | 2001-11-05 | 2018-12-18 | Life Technologies Corporation | Automated microdissection instrument for determining a location of a laser beam projection on a worksurface area |
| US10201324B2 (en) | 2007-05-04 | 2019-02-12 | Delphinus Medical Technologies, Inc. | Patient interface system |
| US10285667B2 (en) | 2014-08-05 | 2019-05-14 | Delphinus Medical Technologies, Inc. | Method for generating an enhanced image of a volume of tissue |
| US10743837B2 (en) | 2014-08-04 | 2020-08-18 | Delphinus Medical Technologies, Inc. | Ultrasound waveform tomography method and system |
| US10908066B2 (en) | 2010-11-16 | 2021-02-02 | 1087 Systems, Inc. | Use of vibrational spectroscopy for microfluidic liquid measurement |
| US11187224B2 (en) | 2013-07-16 | 2021-11-30 | Abs Global, Inc. | Microfluidic chip |
| US11243494B2 (en) | 2002-07-31 | 2022-02-08 | Abs Global, Inc. | Multiple laminar flow-based particle and cellular separation with laser steering |
| US11280732B2 (en) | 2018-08-20 | 2022-03-22 | Georgia State University Research Foundation, Inc. | Detection of melanoma and lymphoma by ATR-FTIR spectroscopy |
| US11320361B2 (en) | 2015-02-19 | 2022-05-03 | 1087 Systems, Inc. | Scanning infrared measurement system |
| US11331670B2 (en) | 2018-05-23 | 2022-05-17 | Abs Global, Inc. | Systems and methods for particle focusing in microchannels |
| US11415503B2 (en) | 2013-10-30 | 2022-08-16 | Abs Global, Inc. | Microfluidic system and method with focused energy apparatus |
| US11450409B2 (en) | 2015-08-14 | 2022-09-20 | Innosign B.V. | Determination of NFkB pathway activity using unique combination of target genes |
| US20220375604A1 (en) * | 2021-04-18 | 2022-11-24 | Mary Hitchcock Memorial Hospital, For Itself And On Behalf Of Dartmouth-Hitchcock Clinic | System and method for automation of surgical pathology processes using artificial intelligence |
| US11610644B2 (en) | 2014-10-24 | 2023-03-21 | Koninklijke Philips N.V. | Superior bioinformatics process for identifying at risk subject populations |
| US11628439B2 (en) | 2020-01-13 | 2023-04-18 | Abs Global, Inc. | Single-sheath microfluidic chip |
| US11640845B2 (en) | 2014-10-24 | 2023-05-02 | Koninklijke Philips N.V. | Bioinformatics process for identifying at risk subject populations |
| US11649488B2 (en) | 2017-10-02 | 2023-05-16 | Innosign B.V. | Determination of JAK-STAT1/2 pathway activity using unique combination of target genes |
| US11776661B2 (en) | 2017-12-20 | 2023-10-03 | Innosign B.V. | Determination of MAPK-AP-1 pathway activity using unique combination of target genes |
| US11848094B2 (en) | 2022-04-08 | 2023-12-19 | Ohio State Innovation Foundation | Multidimensional optical tissue classification and display |
| US11889830B2 (en) | 2019-04-18 | 2024-02-06 | Abs Global, Inc. | System and process for continuous addition of cryoprotectant |
Citations (9)
| Publication number | Priority date | Publication date | Assignee | Title |
|---|---|---|---|---|
| US5036853A (en) * | 1988-08-26 | 1991-08-06 | Polartechnics Ltd. | Physiological probe |
| US5038039A (en) * | 1990-01-29 | 1991-08-06 | Cornell Research Foundation, Inc. | Method of detecting the presence of anomalies in biological tissues and cells in natural and cultured form by infrared spectroscopy |
| US5168162A (en) * | 1991-02-04 | 1992-12-01 | Cornell Research Foundation, Inc. | Method of detecting the presence of anomalies in exfoliated cells using infrared spectroscopy |
| US5197470A (en) * | 1990-07-16 | 1993-03-30 | Eastman Kodak Company | Near infrared diagnostic method and instrument |
| US5435309A (en) * | 1993-08-10 | 1995-07-25 | Thomas; Edward V. | Systematic wavelength selection for improved multivariate spectral analysis |
| US5539207A (en) * | 1994-07-19 | 1996-07-23 | National Research Council Of Canada | Method of identifying tissue |
| US5596992A (en) * | 1993-06-30 | 1997-01-28 | Sandia Corporation | Multivariate classification of infrared spectra of cell and tissue samples |
| US5608519A (en) * | 1995-03-20 | 1997-03-04 | Gourley; Paul L. | Laser apparatus and method for microscopic and spectroscopic analysis and processing of biological cells |
| US5733739A (en) * | 1995-06-07 | 1998-03-31 | Inphocyte, Inc. | System and method for diagnosis of disease by infrared analysis of human tissues and cells |
-
1997
- 1997-05-06 US US08/851,776 patent/US6146897A/en not_active Expired - Lifetime
Patent Citations (9)
| Publication number | Priority date | Publication date | Assignee | Title |
|---|---|---|---|---|
| US5036853A (en) * | 1988-08-26 | 1991-08-06 | Polartechnics Ltd. | Physiological probe |
| US5038039A (en) * | 1990-01-29 | 1991-08-06 | Cornell Research Foundation, Inc. | Method of detecting the presence of anomalies in biological tissues and cells in natural and cultured form by infrared spectroscopy |
| US5197470A (en) * | 1990-07-16 | 1993-03-30 | Eastman Kodak Company | Near infrared diagnostic method and instrument |
| US5168162A (en) * | 1991-02-04 | 1992-12-01 | Cornell Research Foundation, Inc. | Method of detecting the presence of anomalies in exfoliated cells using infrared spectroscopy |
| US5596992A (en) * | 1993-06-30 | 1997-01-28 | Sandia Corporation | Multivariate classification of infrared spectra of cell and tissue samples |
| US5435309A (en) * | 1993-08-10 | 1995-07-25 | Thomas; Edward V. | Systematic wavelength selection for improved multivariate spectral analysis |
| US5539207A (en) * | 1994-07-19 | 1996-07-23 | National Research Council Of Canada | Method of identifying tissue |
| US5608519A (en) * | 1995-03-20 | 1997-03-04 | Gourley; Paul L. | Laser apparatus and method for microscopic and spectroscopic analysis and processing of biological cells |
| US5733739A (en) * | 1995-06-07 | 1998-03-31 | Inphocyte, Inc. | System and method for diagnosis of disease by infrared analysis of human tissues and cells |
Non-Patent Citations (4)
| Title |
|---|
| Dong et al. Biochemical & Biophysical Research Communications , vol. 156, pp. 752 756. (Abstract), Oct. 31, 1988. * |
| Dong et al. Biochemical & Biophysical Research Communications, vol. 156, pp. 752-756. (Abstract), Oct. 31, 1988. |
| Zhengfang Ge, et al., Screening Pap Smears with Near Infrared Spectroscopy, 1995, vol. 49, No. 4, Society for Applied Spectroscopy, pp. 432 436. * |
| Zhengfang Ge, et al., Screening Pap Smears with Near-Infrared Spectroscopy, 1995, vol. 49, No. 4, Society for Applied Spectroscopy, pp. 432-436. |
Cited By (113)
| Publication number | Priority date | Publication date | Assignee | Title |
|---|---|---|---|---|
| US6620621B1 (en) * | 1995-11-13 | 2003-09-16 | Digilab | Method for the detection of cellular abnormalities using fourier transform infrared spectroscopy |
| US6826422B1 (en) | 1997-01-13 | 2004-11-30 | Medispectra, Inc. | Spectral volume microprobe arrays |
| US6728567B2 (en) | 1998-03-20 | 2004-04-27 | Barbara Ann Karmanos Cancer Institute | Method and apparatus for high-resolution detection and characterization of medical pathologies |
| US20040094715A1 (en) * | 1998-07-14 | 2004-05-20 | Lewis E. Neil | High-throughput infrared spectroscopy |
| US7391025B2 (en) * | 1998-07-14 | 2008-06-24 | The United States Of America As Represented By The Department Of Health And Human Services | High-throughput infrared spectroscopy |
| US6427082B1 (en) * | 1998-12-23 | 2002-07-30 | Medispectra, Incorporated | Optical methods and systems for rapid screening of the cervix |
| US6385484B2 (en) * | 1998-12-23 | 2002-05-07 | Medispectra, Inc. | Spectroscopic system employing a plurality of data types |
| US6760613B2 (en) | 1998-12-23 | 2004-07-06 | Medispectra, Inc. | Substantially monostatic, substantially confocal optical systems for examination of samples |
| US6411838B1 (en) | 1998-12-23 | 2002-06-25 | Medispectra, Inc. | Systems and methods for optical examination of samples |
| US6270986B1 (en) * | 1999-02-16 | 2001-08-07 | Patrick T. T. Wong | Method of preserving biological tissue specimens and method of infrared spectroscopic analysis which avoids the effects of polymorphs |
| US6385474B1 (en) * | 1999-03-19 | 2002-05-07 | Barbara Ann Karmanos Cancer Institute | Method and apparatus for high-resolution detection and characterization of medical pathologies |
| US6743637B2 (en) * | 1999-05-10 | 2004-06-01 | Tomoya Sato | Disease type and/or condition determination method and apparatus and drug screening method and apparatus |
| US20020164810A1 (en) * | 2000-12-05 | 2002-11-07 | Vysis | Method and system for diagnosing pathology in biological samples by detection of infrared spectral markers |
| US6841388B2 (en) * | 2000-12-05 | 2005-01-11 | Vysis, Inc. | Method and system for diagnosing pathology in biological samples by detection of infrared spectral markers |
| US6983176B2 (en) * | 2001-04-11 | 2006-01-03 | Rio Grande Medical Technologies, Inc. | Optically similar reference samples and related methods for multivariate calibration models used in optical spectroscopy |
| WO2002084261A2 (en) * | 2001-04-11 | 2002-10-24 | Rio Grande Medical Technologies, Inc. | Optically similar reference samples and related methods for multivariate calibration models used in optical spectroscopy |
| WO2002084261A3 (en) * | 2001-04-11 | 2003-08-07 | Rio Grande Medical Tech Inc | Optically similar reference samples and related methods for multivariate calibration models used in optical spectroscopy |
| US20030023170A1 (en) * | 2001-04-11 | 2003-01-30 | Craig Gardner | Optically similar reference samples and related methods for multivariate calibration models used in optical spectroscopy |
| US20030025582A1 (en) * | 2001-07-23 | 2003-02-06 | Winfried Arz | Magnetic resonance tomography apparatus having damping laminated sheets for reducing vibrations |
| US20030087456A1 (en) * | 2001-10-08 | 2003-05-08 | Jones Howland D.T. | Within-sample variance classification of samples |
| WO2003031954A1 (en) | 2001-10-08 | 2003-04-17 | Inlight Solutions, Inc. | Classification of samples |
| US8722357B2 (en) | 2001-11-05 | 2014-05-13 | Life Technologies Corporation | Automated microdissection instrument |
| US10156501B2 (en) | 2001-11-05 | 2018-12-18 | Life Technologies Corporation | Automated microdissection instrument for determining a location of a laser beam projection on a worksurface area |
| US20030227612A1 (en) * | 2002-06-10 | 2003-12-11 | Howard Fein | Imaging system for examining biological material |
| US7122776B2 (en) | 2002-06-10 | 2006-10-17 | Palantyr Research, Llc | Imaging system for examining biological material |
| US6884983B2 (en) | 2002-06-10 | 2005-04-26 | Palantyr Research, Llc | Imaging system for examining biological material |
| US20050277186A1 (en) * | 2002-06-10 | 2005-12-15 | Palantyr Research, Llc. | Imaging system for examining biological material |
| US6998596B2 (en) | 2002-06-10 | 2006-02-14 | Palantyr Research, Llc | Imaging system for examining biological material |
| US20060000965A1 (en) * | 2002-06-10 | 2006-01-05 | Howard Fein | Imaging system for examining biological material |
| US20060122588A1 (en) * | 2002-06-13 | 2006-06-08 | Regents Of The University Of Minnesota | Cryosurgery compositions and methods |
| US6818903B2 (en) | 2002-07-09 | 2004-11-16 | Medispectra, Inc. | Method and apparatus for identifying spectral artifacts |
| US6768918B2 (en) | 2002-07-10 | 2004-07-27 | Medispectra, Inc. | Fluorescent fiberoptic probe for tissue health discrimination and method of use thereof |
| US8005527B2 (en) | 2002-07-10 | 2011-08-23 | Luma Imaging Corporation | Method of determining a condition of a tissue |
| US11415936B2 (en) | 2002-07-31 | 2022-08-16 | Abs Global, Inc. | Multiple laminar flow-based particle and cellular separation with laser steering |
| US11243494B2 (en) | 2002-07-31 | 2022-02-08 | Abs Global, Inc. | Multiple laminar flow-based particle and cellular separation with laser steering |
| US11422504B2 (en) | 2002-07-31 | 2022-08-23 | Abs Global, Inc. | Multiple laminar flow-based particle and cellular separation with laser steering |
| US8346483B2 (en) | 2002-09-13 | 2013-01-01 | Life Technologies Corporation | Interactive and automated tissue image analysis with global training database and variable-abstraction processing in cytological specimen classification and laser capture microdissection applications |
| US20040093166A1 (en) * | 2002-09-13 | 2004-05-13 | Kil David H. | Interactive and automated tissue image analysis with global training database and variable-abstraction processing in cytological specimen classification and laser capture microdissection applications |
| US7344530B2 (en) * | 2003-03-26 | 2008-03-18 | Regents Of The University Of Minnesota | Thermal surgical procedures and compositions |
| US7344531B2 (en) * | 2003-03-26 | 2008-03-18 | Regents Of The University Of Minnesota | Thermal surgical procedures and compositions |
| US20050080405A1 (en) * | 2003-03-26 | 2005-04-14 | Bischof John C. | Thermal surgical procedures and compositions |
| US20060079869A1 (en) * | 2003-03-26 | 2006-04-13 | Bischof John C | Thermal surgical procedures and compositions |
| US20060078538A1 (en) * | 2003-03-26 | 2006-04-13 | Bischof John C | Thermal surgical procedures and compositions |
| US7136518B2 (en) * | 2003-04-18 | 2006-11-14 | Medispectra, Inc. | Methods and apparatus for displaying diagnostic data |
| WO2005017501A1 (en) * | 2003-08-14 | 2005-02-24 | National Research Council Of Cananda | Method of diagnosing colorectal adenomas and cancer using infrared spectroscopy |
| US20050280813A1 (en) * | 2004-06-16 | 2005-12-22 | Jones Howland D T | Infrared spectroscopy as an assist for cytological investigation |
| US8715955B2 (en) | 2004-09-09 | 2014-05-06 | Life Technologies Corporation | Laser microdissection apparatus and method |
| US9279749B2 (en) | 2004-09-09 | 2016-03-08 | Life Technologies Corporation | Laser microdissection method and apparatus |
| US11703428B2 (en) | 2004-09-25 | 2023-07-18 | Life Technologies Corporation | Automated microdissection instrument and method for processing a biological sample |
| US10605706B2 (en) | 2004-09-25 | 2020-03-31 | Life Technologies Corporation | Automated microdissection instrument with controlled focusing during movement of a laser beam across a tissue sample |
| US11175203B2 (en) | 2004-09-25 | 2021-11-16 | Life Technologies Corporation | Automated microdissection instrument using tracking information |
| US20060282223A1 (en) * | 2004-10-15 | 2006-12-14 | Lewis E N | Pharmaceutical mixture evaluation |
| US8842266B2 (en) | 2004-10-15 | 2014-09-23 | Malvern Instruments Incorporated | Pharmaceutical mixture evaluation |
| US8004662B2 (en) | 2004-10-15 | 2011-08-23 | Malvern Instruments Incorporated | Pharmaceutical mixture evaluation |
| US7756309B2 (en) * | 2005-07-27 | 2010-07-13 | Bioimagene, Inc. | Method and system for storing, indexing and searching medical images using anatomical structures of interest |
| US20070025606A1 (en) * | 2005-07-27 | 2007-02-01 | Bioimagene, Inc. | Method and system for storing, indexing and searching medical images using anatomical structures of interest |
| US10201324B2 (en) | 2007-05-04 | 2019-02-12 | Delphinus Medical Technologies, Inc. | Patient interface system |
| US8822928B2 (en) | 2008-03-28 | 2014-09-02 | The Ohio State University | Rapid diagnosis of a disease condition using infrared spectroscopy |
| US8614419B2 (en) | 2008-03-28 | 2013-12-24 | The Ohio State University | Rapid diagnosis of a disease condition using infrared spectroscopy |
| US20110317158A1 (en) * | 2008-12-18 | 2011-12-29 | Lyng Fiona M | Cytological method for analyzing a biological sample by raman spectroscopy |
| US9003869B2 (en) | 2010-11-16 | 2015-04-14 | 1087 Systems, Inc. | Use of vibrational spectroscopy for DNA content inspection |
| US8981298B2 (en) | 2010-11-16 | 2015-03-17 | 1087 Systems, Inc. | System and method for pathogen detection and identification |
| US11193879B2 (en) | 2010-11-16 | 2021-12-07 | 1087 Systems, Inc. | Use of vibrational spectroscopy for microfluidic liquid measurement |
| US8941062B2 (en) | 2010-11-16 | 2015-01-27 | 1087 Systems, Inc. | System for identifying and sorting living cells |
| US10908066B2 (en) | 2010-11-16 | 2021-02-02 | 1087 Systems, Inc. | Use of vibrational spectroscopy for microfluidic liquid measurement |
| US8502148B2 (en) | 2010-11-16 | 2013-08-06 | Matthias Wagner | Single particle QCL-based mid-IR spectroscopy system with analysis of scattering |
| US10261012B2 (en) | 2010-11-16 | 2019-04-16 | 1087 Systems, Inc. | Cytometry system with interferometric measurement |
| US9835552B2 (en) | 2010-11-16 | 2017-12-05 | 1087 Systems, Inc. | Cytometry system with interferometric measurement |
| US10175159B2 (en) | 2010-11-16 | 2019-01-08 | 1087 Systems, Inc. | Use of vibrational spectroscopy for DNA content inspection |
| US9763641B2 (en) | 2012-08-30 | 2017-09-19 | Delphinus Medical Technologies, Inc. | Method and system for imaging a volume of tissue with tissue boundary detection |
| US11064974B2 (en) | 2013-03-13 | 2021-07-20 | Delphinus Medical Technologies, Inc. | Patient interface system |
| US10123770B2 (en) | 2013-03-13 | 2018-11-13 | Delphinus Medical Technologies, Inc. | Patient support system |
| US10013760B2 (en) * | 2013-03-15 | 2018-07-03 | Board Of Trustees Of The University Of Illinois | Stain-free histopathology by chemical imaging |
| US20140270457A1 (en) * | 2013-03-15 | 2014-09-18 | The Board Of Trustees Of The University Of Illinois | Stain-free histopathology by chemical imaging |
| US9786050B2 (en) * | 2013-03-15 | 2017-10-10 | The Board Of Trustees Of The University Of Illinois | Stain-free histopathology by chemical imaging |
| US11512691B2 (en) | 2013-07-16 | 2022-11-29 | Abs Global, Inc. | Microfluidic chip |
| US11187224B2 (en) | 2013-07-16 | 2021-11-30 | Abs Global, Inc. | Microfluidic chip |
| US11639888B2 (en) | 2013-10-30 | 2023-05-02 | Abs Global, Inc. | Microfluidic system and method with focused energy apparatus |
| US11415503B2 (en) | 2013-10-30 | 2022-08-16 | Abs Global, Inc. | Microfluidic system and method with focused energy apparatus |
| US11796449B2 (en) | 2013-10-30 | 2023-10-24 | Abs Global, Inc. | Microfluidic system and method with focused energy apparatus |
| WO2015085056A1 (en) * | 2013-12-05 | 2015-06-11 | Georgia State University Research Foundation, Inc. | Early detection of cell activation by atr-ftir |
| US9983129B2 (en) * | 2013-12-05 | 2018-05-29 | Georgia State University Research Foundation, Inc. | Early detection of cell activation by ATR-FTIR spectroscopy |
| US20160305877A1 (en) * | 2013-12-05 | 2016-10-20 | Georgia State University Research Foundation, Inc. | Early detection of cell activation by atr-ftir spectroscopy |
| US11147537B2 (en) | 2014-05-05 | 2021-10-19 | Delphinus Medical Technologies, Inc. | Method for representing tissue stiffness |
| US10143443B2 (en) | 2014-05-05 | 2018-12-04 | Delphinus Medical Technologies, Inc. | Method for representing tissue stiffness |
| US20170212041A1 (en) * | 2014-07-29 | 2017-07-27 | Universite De Reims Champagne-Ardenne | Method for detecting and quantifying fibrosis |
| FR3024546A1 (en) * | 2014-07-29 | 2016-02-05 | Univ Reims Champagne Ardenne | METHOD OF DETECTING AND QUANTIFYING FIBROSIS |
| US9810625B2 (en) * | 2014-07-29 | 2017-11-07 | Universite De Reims Champagne-Ardenne | Method for detecting and quantifying fibrosis |
| WO2016016531A1 (en) * | 2014-07-29 | 2016-02-04 | Universite De Reims Champagne-Ardenne | Method for detecting and quantifying fibrosis |
| US10743837B2 (en) | 2014-08-04 | 2020-08-18 | Delphinus Medical Technologies, Inc. | Ultrasound waveform tomography method and system |
| US11298111B2 (en) | 2014-08-05 | 2022-04-12 | Delphinus Medical Technologies, Inc. | Method for generating an enhanced image of a volume of tissue |
| US10285667B2 (en) | 2014-08-05 | 2019-05-14 | Delphinus Medical Technologies, Inc. | Method for generating an enhanced image of a volume of tissue |
| US11640845B2 (en) | 2014-10-24 | 2023-05-02 | Koninklijke Philips N.V. | Bioinformatics process for identifying at risk subject populations |
| US10016159B2 (en) | 2014-10-24 | 2018-07-10 | Koninklijke Philips N.V. | Determination of TGF-β pathway activity using unique combination of target genes |
| US11610644B2 (en) | 2014-10-24 | 2023-03-21 | Koninklijke Philips N.V. | Superior bioinformatics process for identifying at risk subject populations |
| US11674882B2 (en) | 2015-02-19 | 2023-06-13 | 1087 Systems, Inc. | Scanning infrared measurement system |
| US11320361B2 (en) | 2015-02-19 | 2022-05-03 | 1087 Systems, Inc. | Scanning infrared measurement system |
| US11450409B2 (en) | 2015-08-14 | 2022-09-20 | Innosign B.V. | Determination of NFkB pathway activity using unique combination of target genes |
| US10809190B2 (en) * | 2015-09-10 | 2020-10-20 | Beamline Diagnostics Ltd | Method, computer programme and system for analysing a sample comprising identifying or sorting cells according to the FTIR spectrum each cell produces |
| CN108713143A (en) * | 2015-09-10 | 2018-10-26 | 光束线诊断有限公司 | Include to identify or sort method, computer program and the system of cell sample according to the FTIR spectrum that each cell generates for analyzing |
| GB2545877B (en) * | 2015-09-10 | 2021-09-15 | Sierra Medical Ltd | ATR-FTIR computational analysis of Barrett's esophagus and esophageal cancers |
| JP2018534587A (en) * | 2015-09-10 | 2018-11-22 | ビームライン ダイアグノスティックス リミテッドBeamLine Diagnostics Ltd | Method, computer program, and system for analyzing a sample, comprising identifying or classifying cells by FTIR spectrum produced by each cell |
| US20190041324A1 (en) * | 2015-09-10 | 2019-02-07 | Beamline Diagnostics Ltd | Method, computer programme and system for analysing a sample comprising identifying or sorting cells according to the ftir spectrum each cell produces |
| WO2017042579A1 (en) * | 2015-09-10 | 2017-03-16 | Beamline Diagnostics Ltd | Method, computer programme and system for analysing a sample comprising identifying or sorting cells according to the ftir spectrum each cell produces |
| GB2545877A (en) * | 2015-09-10 | 2017-07-05 | Beamline Diagnostics Ltd | Method |
| US11649488B2 (en) | 2017-10-02 | 2023-05-16 | Innosign B.V. | Determination of JAK-STAT1/2 pathway activity using unique combination of target genes |
| US11776661B2 (en) | 2017-12-20 | 2023-10-03 | Innosign B.V. | Determination of MAPK-AP-1 pathway activity using unique combination of target genes |
| US11331670B2 (en) | 2018-05-23 | 2022-05-17 | Abs Global, Inc. | Systems and methods for particle focusing in microchannels |
| US11280732B2 (en) | 2018-08-20 | 2022-03-22 | Georgia State University Research Foundation, Inc. | Detection of melanoma and lymphoma by ATR-FTIR spectroscopy |
| US11889830B2 (en) | 2019-04-18 | 2024-02-06 | Abs Global, Inc. | System and process for continuous addition of cryoprotectant |
| US11628439B2 (en) | 2020-01-13 | 2023-04-18 | Abs Global, Inc. | Single-sheath microfluidic chip |
| US20220375604A1 (en) * | 2021-04-18 | 2022-11-24 | Mary Hitchcock Memorial Hospital, For Itself And On Behalf Of Dartmouth-Hitchcock Clinic | System and method for automation of surgical pathology processes using artificial intelligence |
| US11848094B2 (en) | 2022-04-08 | 2023-12-19 | Ohio State Innovation Foundation | Multidimensional optical tissue classification and display |
Similar Documents
| Publication | Publication Date | Title |
|---|---|---|
| US6146897A (en) | Method for the detection of cellular abnormalities using Fourier transform infrared spectroscopy | |
| US6620621B1 (en) | Method for the detection of cellular abnormalities using fourier transform infrared spectroscopy | |
| Chiriboga et al. | Infrared spectroscopy of human tissue. I. Differentiation and maturation of epithelial cells in the human cervix | |
| Diem et al. | A decade of vibrational micro-spectroscopy of human cells and tissue (1994–2004) | |
| US6954667B2 (en) | Method for Raman chemical imaging and characterization of calcification in tissue | |
| Wetzel et al. | Revealing protein infrared spectral detail in a heterogeneous matrix dominated by starch | |
| US6274871B1 (en) | Method and system for performing infrared study on a biological sample | |
| Wood et al. | Fourier transform infrared (FTIR) spectral mapping of the cervical transformation zone, and dysplastic squamous epithelium | |
| US5596992A (en) | Multivariate classification of infrared spectra of cell and tissue samples | |
| US6002476A (en) | Chemical imaging system | |
| CA2008831C (en) | Method of detecting the presence of anomalies in biological tissues and cells in natural and cultured form by infrared spectroscopy | |
| Chiriboga et al. | Infrared spectroscopy of human tissue. II. A comparative study of spectra of biopsies of cervical squamous epithelium and of exfoliated cervical cells | |
| US8532750B2 (en) | Process and device for detection of precancer tissues with infrared spectroscopy | |
| WO1997048329A1 (en) | Near-infrared raman spectroscopy for in vitro and in vivo detection of cervical precancers | |
| Romeo et al. | Infrared spectral imaging of lymph nodes: Strategies for analysis and artifact reduction | |
| Romeo et al. | Infrared micro-spectroscopic studies of epithelial cells | |
| Wetzel et al. | Biological applications of infrared microspectroscopy | |
| Andrei et al. | Cancer diagnosis by FT-IR Spectrophotometry | |
| Petter et al. | Development and application of Fourier-transform infrared chemical imaging of tumour in human tissue | |
| Bird et al. | Cytology by infrared micro-spectroscopy: Automatic distinction of cell types in urinary cytology | |
| Bambery et al. | Fourier transform infrared imaging and unsupervised hierarchical clustering applied to cervical biopsies | |
| Bird et al. | Spectral detection of micro‐metastases in lymph node histo‐pathology | |
| Romeo et al. | Introduction to spectral imaging, and applications to diagnosis of lymph nodes | |
| Shaw et al. | Analysis of biomedical spectra and images: from data to diagnosis | |
| WO2007011571A2 (en) | Digitizing biology |
Legal Events
| Date | Code | Title | Description |
|---|---|---|---|
| STCF | Information on status: patent grant |
Free format text: PATENTED CASE |
|
| AS | Assignment |
Owner name: DIGILAB ACQUISITIONS, INC., NEW YORK Free format text: ASSIGNMENT OF ASSIGNORS INTEREST;ASSIGNOR:BIO-RAD LABORATORIES, INC.;REEL/FRAME:012581/0823 Effective date: 20011017 |
|
| AS | Assignment |
Owner name: DIGILAB, LLC, MASSACHUSETTS Free format text: ASSIGNMENT OF ASSIGNORS INTEREST;ASSIGNOR:DIGILAB ACQUISITIONS, INC.;REEL/FRAME:012884/0090 Effective date: 20020501 |
|
| FEPP | Fee payment procedure |
Free format text: PAYOR NUMBER ASSIGNED (ORIGINAL EVENT CODE: ASPN); ENTITY STATUS OF PATENT OWNER: LARGE ENTITY Free format text: PAT HOLDER CLAIMS SMALL ENTITY STATUS, ENTITY STATUS SET TO SMALL (ORIGINAL EVENT CODE: LTOS); ENTITY STATUS OF PATENT OWNER: LARGE ENTITY |
|
| REFU | Refund |
Free format text: REFUND - PAYMENT OF MAINTENANCE FEE, 4TH YEAR, LARGE ENTITY (ORIGINAL EVENT CODE: R1551); ENTITY STATUS OF PATENT OWNER: LARGE ENTITY |
|
| FPAY | Fee payment |
Year of fee payment: 4 |
|
| AS | Assignment |
Owner name: VARIAN AUSTRALIA PTY LTD., AUSTRALIA Free format text: ASSIGNMENT OF ASSIGNORS INTEREST;ASSIGNOR:DIGILAB, LLC.;REEL/FRAME:015621/0396 Effective date: 20050125 |
|
| FPAY | Fee payment |
Year of fee payment: 8 |
|
| AS | Assignment |
Owner name: AGILENT TECHNOLOGIES AUSTRALIA (M) PTY LTD, AUSTRA Free format text: CHANGE OF NAME;ASSIGNOR:VARIAN AUSTRALIA PTY LTD;REEL/FRAME:026113/0253 Effective date: 20101101 |
|
| FEPP | Fee payment procedure |
Free format text: PAT HOLDER NO LONGER CLAIMS SMALL ENTITY STATUS, ENTITY STATUS SET TO UNDISCOUNTED (ORIGINAL EVENT CODE: STOL); ENTITY STATUS OF PATENT OWNER: LARGE ENTITY |
|
| REFU | Refund |
Free format text: REFUND - PAYMENT OF MAINTENANCE FEE, 12TH YR, SMALL ENTITY (ORIGINAL EVENT CODE: R2553); ENTITY STATUS OF PATENT OWNER: LARGE ENTITY |
|
| FPAY | Fee payment |
Year of fee payment: 12 |