US6130641A - Imaging methods and apparatus using model-based array signal processing - Google Patents

Imaging methods and apparatus using model-based array signal processing Download PDF

Info

Publication number
US6130641A
US6130641A US09/148,131 US14813198A US6130641A US 6130641 A US6130641 A US 6130641A US 14813198 A US14813198 A US 14813198A US 6130641 A US6130641 A US 6130641A
Authority
US
United States
Prior art keywords
arrival
image data
complex samples
angles
sample matrix
Prior art date
Legal status (The legal status is an assumption and is not a legal conclusion. Google has not performed a legal analysis and makes no representation as to the accuracy of the status listed.)
Expired - Lifetime
Application number
US09/148,131
Inventor
Paul Kraeutner
John Bird
Current Assignee (The listed assignees may be inaccurate. Google has not performed a legal analysis and makes no representation or warranty as to the accuracy of the list.)
Simon Fraser University
Original Assignee
Simon Fraser University
Priority date (The priority date is an assumption and is not a legal conclusion. Google has not performed a legal analysis and makes no representation as to the accuracy of the date listed.)
Filing date
Publication date
Application filed by Simon Fraser University filed Critical Simon Fraser University
Priority to US09/148,131 priority Critical patent/US6130641A/en
Assigned to SIMON FRASER UNIVERSITY reassignment SIMON FRASER UNIVERSITY ASSIGNMENT OF ASSIGNORS INTEREST (SEE DOCUMENT FOR DETAILS). Assignors: BIRD, JOHN, KRAEUTNER, PAUL H.
Application granted granted Critical
Publication of US6130641A publication Critical patent/US6130641A/en
Anticipated expiration legal-status Critical
Expired - Lifetime legal-status Critical Current

Links

Images

Classifications

    • GPHYSICS
    • G01MEASURING; TESTING
    • G01SRADIO DIRECTION-FINDING; RADIO NAVIGATION; DETERMINING DISTANCE OR VELOCITY BY USE OF RADIO WAVES; LOCATING OR PRESENCE-DETECTING BY USE OF THE REFLECTION OR RERADIATION OF RADIO WAVES; ANALOGOUS ARRANGEMENTS USING OTHER WAVES
    • G01S15/00Systems using the reflection or reradiation of acoustic waves, e.g. sonar systems
    • G01S15/88Sonar systems specially adapted for specific applications
    • G01S15/89Sonar systems specially adapted for specific applications for mapping or imaging
    • G01S15/8902Side-looking sonar
    • GPHYSICS
    • G01MEASURING; TESTING
    • G01SRADIO DIRECTION-FINDING; RADIO NAVIGATION; DETERMINING DISTANCE OR VELOCITY BY USE OF RADIO WAVES; LOCATING OR PRESENCE-DETECTING BY USE OF THE REFLECTION OR RERADIATION OF RADIO WAVES; ANALOGOUS ARRANGEMENTS USING OTHER WAVES
    • G01S7/00Details of systems according to groups G01S13/00, G01S15/00, G01S17/00
    • G01S7/52Details of systems according to groups G01S13/00, G01S15/00, G01S17/00 of systems according to group G01S15/00
    • G01S7/52003Techniques for enhancing spatial resolution of targets
    • GPHYSICS
    • G01MEASURING; TESTING
    • G01SRADIO DIRECTION-FINDING; RADIO NAVIGATION; DETERMINING DISTANCE OR VELOCITY BY USE OF RADIO WAVES; LOCATING OR PRESENCE-DETECTING BY USE OF THE REFLECTION OR RERADIATION OF RADIO WAVES; ANALOGOUS ARRANGEMENTS USING OTHER WAVES
    • G01S3/00Direction-finders for determining the direction from which infrasonic, sonic, ultrasonic, or electromagnetic waves, or particle emission, not having a directional significance, are being received
    • G01S3/80Direction-finders for determining the direction from which infrasonic, sonic, ultrasonic, or electromagnetic waves, or particle emission, not having a directional significance, are being received using ultrasonic, sonic or infrasonic waves
    • G01S3/8006Multi-channel systems specially adapted for direction-finding, i.e. having a single aerial system capable of giving simultaneous indications of the directions of different signals

Definitions

  • This invention relates generally to the field of constructing 2-dimensional or 3-dimensional images of surfaces and objects in a volume from signals scattered by those surfaces or objects.
  • the invention has particular application in acoustic imaging.
  • the invention may also be applied to radar imaging.
  • the invention may be applied to terrain mapping, object detection, object avoidance, medical ultrasound imaging and the like.
  • Acoustic imaging is used as an adjunct to optical imaging in media where light is either unavailable or severely attenuated.
  • Underwater acoustic imaging is generally used in place of optics at ranges greater than 10 meters, when water conditions are turbid, or when ambient light is insufficient and it is impractical to provide artificial light.
  • Medical ultrasound is used in place of optics for inexpensive noninvasive imaging of and through fluid bathed tissue and organs.
  • acoustic images are constructed by transmitting acoustic energy into an environment (typically but not necessarily fluid filled) and then measuring and sorting the received echoes according to their spatial origin. This sorting is usually accomplished with either an acoustic lens or a beam former through a process known as spatial filtering.
  • Acoustic imaging is similar in process to optical imaging, however acoustic wavelengths at frequencies practical for ocean or medical imaging are considerably larger than optical wavelengths and therefore acoustic image resolution is comparatively quite poor, even with much larger physical apertures.
  • Beamformer or lens based imaging methods presume a full and continuous angular arrival spectrum.
  • the angle of arrival of a reflected signal is measured directly by performing spatial filtering to sort the entire spectrum into bins.
  • the angular extent of each bin decreases approximately as the inverse of the number of equi-spaced array elements.
  • beamformer imaging a single point scatterer is excited monostatically by a short, narrow band acoustic pulse.
  • the resulting backscatter is received by an N element linear array of transducers with half wavelength element spacing ##EQU1## Scanning a beam, formed from the array elements, across the scatterer will produce a two dimensional image with range resolution determined by the acoustic pulse length and angular resolution governed by the array aperture size (e.g. by N).
  • a spatial modelling approach is able to utilize as few as 2 array elements to produce a similar two dimensional image by estimating the backscatter wave number (i.e. angle-of-arrival (AOA)).
  • AOA angle-of-arrival
  • the range resolution remains the same as for the beamformed case however, the angular resolution is no longer restricted by the aperture size and instead is limited only by the adherence of the signal to the underlying model assumptions and the display pixel size.
  • the disadvantage of spatial based modelling is that the image will be valid only when the underlying model is satisfied. Artifacts of various kinds may be created if the underlying model is not satisfied.
  • sidescan sonar An example of a successful spatial modelling based imaging method is sidescan sonar.
  • sidescan sonar a short acoustic is pulse is transmitted from a single transducer array.
  • the array is designed to generate a fan-shaped beam that is quite narrow in the horizontal direction.
  • the beam is oriented in a side-looking geometry.
  • the array detects a backscattered signal from the narrow strip of seafloor illuminated by the transducer beam pattern.
  • the signal reflected from the seafloor is detected by the transducer.
  • the angle of arrival of the backscattered signal is not directly measured. Instead, the acoustic angle-of-arrival, ⁇ , is inferred from the time of arrival of the reflected signal.
  • the angle of arrival is assumed to be a function of range, R.
  • the function can be derived from the known sonar altitude, H and the assumption that the seafloor is predominantly flat. Successive strips are imaged by plotting the backscatter intensity in x at constant y and then advancing the sensor platform along the Y axis and repeating the transmit/receive operation. The resulting two dimensional image can be quite spectacular with an angular image resolution that is far superior to that achievable via beamforming.
  • Sidescan sonar is widely used for qualitative seafloor exploration and search applications. A problem with sidescan imaging is that the sea floor is, in general, not flat. This departure from the model can result in the generation of various artifacts in a sidescan sonar image and makes sidescan sonar unsuitable for making quantitative measurements.
  • SBS swath bathymetry sidescan
  • a vertical linear array of two sets of transducers is used. Differential phase between the two sets of transducers in the array can be used to directly estimate the backscatter angle-of-arrival as a function of time instead of relying on the assumption that the seafloor is flat. Because ⁇ is measured rather than assumed, SBS can, under favourable backscatter conditions, provide an accurate geometric representation of the imaging surface and can therefore be used for quantitative bathymetric mapping as well as qualitative imaging.
  • Both SBS and conventional sidescan sonar presume one scatterer per range cell.
  • multiple scatterers may actually contribute to the backscatter signal measured at a particular instant.
  • the backscattered signals from such multiple scatterers can interfere at the receive transducers. If the amplitude of the backscatter is corrupted by scatterer interference then the image is said to include "scintillation” or "speckle”. Similarly, if the differential phase of the backscatter is corrupted by scatterer interference the image is said to include "glint". Both scintillation and glint are well known sources of distortion not only in underwater acoustic imaging and mapping systems but also in terrestrial and space radar imaging and mapping systems.
  • This invention provides a method for imaging a region.
  • the region may be under water.
  • the method begins by transmitting a pulse toward the region.
  • the pulse may be an acoustic pulse or an electromagnetic pulse.
  • the method continues with the step of detecting a signal scattered from the region to yield a multi-channel scattering signal at a receiver transducer array comprising a plurality of N elements.
  • L snapshots are obtained, where L is an integer with L ⁇ 1, by sampling the scattering signal at one or more instants after transmitting the pulse to yield a plurality of complex samples.
  • the plurality of complex samples are processed to obtain image data comprising angles of arrival from M principal scattering components, where M is an integer, with 1 ⁇ M ⁇ N-1.
  • the processing is performed by: constructing a sample matrix S L ,M,N from the complex samples; from the sample matrix computing a null-space vector w comprising a plurality of entries; computing a plurality of roots of a polynomial formed from the entries of the null-space vector; and, from the roots of the polynomial computing angles of arrival for M principal scattering components.
  • the method stores the angles of arrival as image data.
  • the step of computing the null space vector comprises numerically finding a vector w in a search space according to a best fit criterion.
  • the best fit criterion may be selected from the group consisting of: maximum likelihood, sub-space decomposition fitting or least squares.
  • the step of processing the plurality of complex samples comprises: selecting those roots of the polynomial which have a magnitude in the range of 1- ⁇ 1 to 1+ ⁇ 2 , where ⁇ 1 and ⁇ 2 are predetermined threshold values; and storing as image data only the angles of arrival corresponding to the selected roots.
  • processing the complex samples comprises computing amplitudes for the M scatterers from the sample matrix and the angles of arrival and storing the amplitudes with the image data.
  • the amplitudes may be compared to a threshold a binary value indicating whether the amplitudes are greater than or less than the threshold may be stored with the image data. This reduces storage requirements for the image data and simplifies display of the image data.
  • the step of processing the plurality of complex samples optionally includes the steps of: forming Q beams with offset phase centers by taking linear combinations of the complex samples, where Q ⁇ N, and forming the sample matrix from outputs of the beams.
  • the scatter signal data comprises a plurality of sets of complex samples detected sequentially at a transducer array. Each set comprises a complex sample obtained from each of a plurality of elements in the array.
  • Yet another aspect of the invention provides an imaging system comprising: a transmit transducer; a pulse generator connected to the transmit transducer; a receive transducer array; a receiver connected to the receive transducer array; a processor connected to receive the series of complex samples from the digital to analog conversion circuit and, a display device driver.
  • the receiver comprises: a multi-channel amplifier for amplifying scattered signals detected by each element of the receive transducer array; and, a digital to analog conversion circuit connected to the multi-channel amplifier to sample the amplified scattered signals to produce a series of complex samples.
  • the processor is adapted to, for each of a plurality of ranges: select a group of complex samples corresponding to a range; construct a sample matrix S L ,M,N from the group of complex samples; compute a null space vector w comprising a plurality of entries from the sample matrix; compute the roots of a polynomial formed from the entries of the null-space vector; compute angles of arrival for one or more scatterers from the roots of the polynomial; compute amplitudes for the one or more scatterers from the sample matrix and the angles of arrival; and, store the range, angles of arrival and amplitudes as image data.
  • the display driver is connected to receive the image data and to display the image data on a display device.
  • the transmit transducer may comprise one or more of the same transducer elements which make up the receive transducer array.
  • Yet another aspect of the invention provides a processing unit for processing scattering signal data received at a multi-channel transducer to yield image data, the scattering signal data comprising a plurality of sets of complex samples, the sets detected sequentially at a transducer array, each set comprising a complex sample obtained from each of a plurality of elements in the array.
  • the processing unit comprises: means for selecting a group of complex samples corresponding to a distance range; means for constructing a sample matrix S L ,M,N from the group of complex samples; means for computing a null-space vector w comprising a plurality of entries from the sample matrix; means for computing the roots of a polynomial formed from the entries of the null-space vector; means for computing angles of arrival for two or more scatterers from the roots of the polynomial; means for computing amplitudes for the two or more scatterers from the sample matrix and the angles of arrival; and, means for storing the range, angles of arrival and amplitudes as image data.
  • the invention also provides a computer readable medium containing computer software.
  • the computer software when run on a computer, causes the computer to operate so as to provide a processing means for: constructing a sample matrix S L ,M,N from a set of complex samples; obtaining from the sample matrix a null-space vector w; computing the roots of a polynomial formed from the entries of the null-space vector; computing angles of arrival for one or more scatterers from the roots of the polynomial; computing amplitudes for the one or more scatterers from the sample matrix and the angles of arrival; and, storing the angles of arrival and amplitudes as image data.
  • FIG. 1 is a functional block diagram of an acoustic imaging system according to the invention
  • FIG. 2 is a schematic drawing showing a number of scatterers in the far field of a receiver array
  • FIGS. 3A, 3B and 3C are flow diagrams illustrating one example of an imaging method according to the invention.
  • FIG. 4 is a schematic diagram illustrating the use of apparatus according to the invention to image a vertical structure on a generally horizontal portion of the sea floor;
  • FIG. 5 is an expanded functional block diagram showing an example of a prototype apparatus adapted for small aperture underwater imaging according to the invention
  • FIG. 6 is a functional diagram of circuitry for implementing one channel of a transceiver in the apparatus of FIG. 5;
  • FIG. 7 is a schematic illustrating a simple transmit/receive switch that may be used in the invention.
  • FIG. 1 is a functional block diagram of an acoustic imaging system 20 according to the invention.
  • FIG. 3A illustrates a method 300 implemented when system 20 is operated.
  • Imaging system 20 comprises a transmitter 22 connected to a transmit transducer 24.
  • Transmitter 22 and transmit transducer 24 are operated under the control of a controller 26 to insonify the environment which is to be imaged.
  • Transmitter 22 is pulsed on and off.
  • Transmitter 22 is preferably operated to produce short pulses of sound directed toward a region to be imaged (step 310).
  • the range of objects being imaged at any instant can be determined from the time since the pulse was transmitted.
  • the range resolution is determined by the transmit pulse bandwidth.
  • Transmit transducer 24 preferably provides a fan-shaped beam pattern so that the transmitted signal s tx (t) can be considered to propagate in a two-dimensional plane (i.e. a slice of a three-dimensional volume).
  • the transmitted signal s tx (t) may take many forms, for example, the transmitted signal pulse may be a simple gated sinusoid, a swept FM chirp, an M-sequence PSK waveform.
  • the sinusoidal signal represents the fundamental waveform.
  • Other waveforms can be analysed as superpositions of sinusoidal waveforms. Consequently, a sinusoidal waveform will be used to explain the operation of this invention.
  • non-sinusoidal waveforms may be used to afford post processing signal-to-noise ratio improvement by increasing the time-bandwidth product as is known to those skilled in the art.
  • Receive transducer 28 is typically located near transmit transducer 24. In general, receive transducer 28 may be remote from transmit transducer 24. Receive transducer 28 comprises a linear array of N transducer elements 30 spaced apart from one another by a distance d. In practice the same transducer may serve both as a transmit transducer 24 and as receive transducer 28.
  • a receiver 34 is connected to receive the scattered signals s 1 (t), s 2 (t), s 3 (t) . . . s N (t) (FIG. 2) received respectively at the N elements 30 of receive transducer 28 (step 314). Receiver 34 filters and amplifies the received signals (step 318) and periodically samples the inphase and quadrature components at the outputs of each of elements 30 (step 322).
  • Receiver 34 should be capable of sampling the inphase and quadrature components of the outputs of elements 30 at a rate which is at least equal to the receiver bandwidth about the carrier frequency of the transmitted signal s tx (t) in order to avoid aliasing.
  • the sampled signals are optionally stored (step 324) and conveyed as complex samples (each complex sample typically consists of inphase and quadrature samples) to a processor 35 in controller 26 (step 326).
  • Processor 35 may begin processing as soon as the first set of samples has been received or may process a complete set of sampled signals after all of the samples have been taken and stored. Processor 35 processes the sampled signals to yield image data (step 328) and assembles an image which is displayed on a display 36 (step 330). Processor 35 may process the sampled signals in real time or may process stored sampled values. Processor 35 may simply store the image data for later display or manipulation. The image data may be displayed or used as input for another processing stage, such as a stage for generating a contour map.
  • System 20 optionally accepts input from a user as to new values for various parameters used during processing and/or data collection/display steps 310-330 (step 332) the image data may then be re-calculated or re-collected and re-calculated for display using the new parameter values. This permits the displayed image to be fine tuned by a user.
  • the systems and methods of this invention are based upon a model which assumes up to M scatterers at each range.
  • the model assumes that the scatterers are sufficiently far away as compared to the wavelength of the scattered signals so that the signal scattered by each scatterer can be treated as a plane wave upon arrival at receive transducer array 30 (the far field assumption).
  • FIG. 2 illustrates schematically a situation where M independent scatterers at a range R(t) each scatter a signal having a complex amplitude ⁇ m (t) toward N element receiver transducer array 28.
  • M independent scatterers at a range R(t) each scatter a signal having a complex amplitude ⁇ m (t) toward N element receiver transducer array 28.
  • the scattered signal from the Mth scatterer has a constant complex amplitude ⁇ m ; with 1 ⁇ m ⁇ M across all of the elements 30 of receiver array 28 (the steady state condition).
  • the assumed model has 2M unknown parameters, M values for ⁇ m and M values for u m .
  • Generating an image according to a general embodiment of the invention involves using measured values of s n to solve for these 2M unknown parameters.
  • One evaluation point is associated with the direction of each of the M scatterers.
  • Solving equation (4) for the 2M parameters is accomplished in two steps. First, M linearly independent instances of equation (4) are used to solve for the wavenumbers of M scattered signals. Next, the same set of independent equations and the newly obtained wavenumbers are used to compute the complex amplitudes of the scattered signals. The required M linearly independent equations may be obtained by finding situations where ⁇ m vary independently for constant wavenumbers u m .
  • the first way is used when the signals received from the M scatterers are coherent or only a single "snapshot" is available.
  • a snapshot is a set of complex samples taken at the same instant from each of the elements 30 of receive array 28. Using a single snapshot provides maximum range resolution.
  • the second way can be used when the signals from the M scatterers can be assumed to be uncorrelated but cannot be used when the signals are correlated.
  • the methods of the invention differ between these two cases in the number of scatterers M that can be resolved with a given receive array 28 and the number of snapshots that must be used to resolve the amplitudes and angles of arrival from the M scatterers.
  • the coherent case will be addressed first.
  • the general methods of the invention are illustrated by the coherent case.
  • the methods of the invention are extended to the uncorrelated case below.
  • Finally a generalized procedure which can accommodate both is coherent and incoherent scattering assumptions is presented.
  • the M necessary equations may be obtained by subdividing the N elements 30 into M overlapping sub-arrays each having M+1 elements.
  • the M sub-arrays yield M independent equations in the form of equation (4).
  • These equations can then be solved to yield the M values of w p needed to satisfy equation (4).
  • the null-steering equations for two sub arrays are given as follows: ##EQU5## where ⁇ m and ⁇ m are independent.
  • a group of complex samples to be used for a given range is identified (step 352). This group may consist of a single snapshot containing a complex sample taken at each element 30 of receive array 28. Then a sample matrix S is prepared using the group of complex samples as its elements (step 354).
  • the sample matrix S contains measured complex values representing the inphase and quadrature components of scattered signals received at the elements 30 of receive array 28.
  • the null steering equation can then be represented as follows:
  • the M roots [z 1 , z 2 , . . . , z M ] of equation (8) are then calculated (step 364) by standard techniques.
  • the wave numbers corresponding to each of the M scatterers are then calculated (step 368) from: ##EQU7##
  • the angles of arrival from each of the M scatterers can then be calculated (step 372) from: ##EQU8##
  • the scattering amplitudes ⁇ m can be calculated (step 374) from the matrix equation: ##EQU9##
  • B is the matrix: ##EQU10## and s is a column vector formed from one snapshot across M consecutive elements of array 30 (e.g. [s 1 (l) s 2 (l) . . . s M (l)] T ).
  • S L ,M,N H is the Hermitian transpose of S L ,M,N.
  • Each set of values for ⁇ m and u m corresponds to a specific range.
  • the range is known from the time at which the scattered signal is sampled.
  • An image can then be prepared from the known values for the range and angles of arrival.
  • the scattering amplitudes are also used in the preparation of the image.
  • the range and angle of arrival identify a specific pixel in the image.
  • the scattering amplitude may be represented as the intensity or colour of the pixel.
  • the scatterer is not displayed unless its amplitude exceeds the threshold value. If the scatterer is displayed then it may be displayed either in a way which depends on the scattering amplitude or all displayed pixels may be displayed in the same way. In the second case the image data requires less storage space.
  • the foregoing method of image generation requires only a single "snapshot" to produce the image pixels at each range. That is, the image pixels at each range can be generated by sampling the outputs from elements 30 of receive array 28 once at each range (i.e. once in each time slice following the transmission of a pulse).
  • the image pixels may be displayed in various ways to yield 2-dimensional or 3-dimensional images. This method requires a receive transducer array having 2M elements 30.
  • angles of arrival for M independent scatterers can be measured with fewer than 2M elements in array 28 if the angles-of arrival of the scattered signals change slowly as a function of time.
  • the angles of arrival will change slowly as a function of range in many real situations.
  • FIG. 4 where contributing scatterers change as the transmitted acoustic pulse s tx (t) propagates along the seafloor and down a vertical feature.
  • the signal which is scattered back toward receiver array 28 is scattered by a different group of scatterers. It is therefore possible to obtain multiple independent snapshots for the same principal scattering components (e.g. the same portion of the sea floor and vertical feature).
  • M independent equations may be obtained by assuming that u m changes only slowly from snapshot to snapshot and that ⁇ m is uncorrelated from snapshot to snapshot. This assumption is often a good assumption because, at each instant, ⁇ m is the result of scattering by a different group of scatterers.
  • Equation (7) can then be solved as set out above to yield angles of arrival and amplitudes using the sample matrix of equation (14).
  • M snapshots (sets of samples) from a single array are used to produce image pixels at each range instead of 1 snapshot taken as M sub-arrays, as set out above. It can be appreciated that range resolution is degraded by using multiple snapshots.
  • sample matrix which includes both information from a number of sub-arrays and information from a number of sequentially taken snap shots.
  • This sample matrix may be represented as follows: ##EQU13##
  • S L ,M,N is the sample matrix for L snapshots taken from a receive array 28 having N elements which may be used to solve for M scatterers.
  • Solving for angles of arrival by the least squares method involves obtaining a least squares estimate of the null steering vector w. This may be done using the least squares formulation of equation (7) as follows:
  • Equation (16) can be solved numerically using techniques well known to those skilled in the art.
  • the sample matrix is first partitioned (step 380).
  • the partition allows the unknown values of w to be grouped on one side of the equation and the remaining constant term on the other side as:
  • Singular value decomposition of S (step 382) can then be used to compute its pseudoinverse (step 384) in order to solve for the unknown null space coefficients w (step 386).
  • a value for M is chosen such that N/2 ⁇ M ⁇ N-1.
  • the value for M may be chosen during the design of a system according to the invention or a system may be designed which allows a user to select an appropriate value for M when the system is being used.
  • the particular value chosen for M will depend upon whether it is expected that the scattered signals might be coherent or it is desired to use single snapshots to obtain better range resolution, on the one hand, or whether the signals scattered by different scatterers can be assumed to be uncorrelated, in which case more scattering components may be resolved with a given receive array 28.
  • the value chosen for M need be no greater than the expected maximum number of principal scattering components to be estimated. For example, one direct path and one multipath would constitute two principal scattering components. M need not be known ⁇ priori. The value selected for M may exceed the number of principal scattering components.
  • a solution is a plane wave solution may be determined by testing the solution roots (i.e. the roots z of the polynomial of equation (8)) to determine whether or not they have a magnitude within a predetermined threshold, of 1. That is to ascertain (step 376) whether or not:
  • roots corresponding to plane wave solutions will all lie on the unit circle. That is, roots corresponding to plane wave solutions will all have a magnitude of 1.
  • the M solutions to the null-steering equation are screened using equation (19). Only those solutions which correspond to plane wave solutions are retained. All other solutions may be discarded because they do not fit the assumed model. The retained solutions yield a set of angles of arrival and amplitudes which may be plotted on a display or saved as "display information" for later display.
  • a pulsed transmit signal s tx (t) the assumption that the elements 30 of receive array 28 all experience the same acoustic field at all times (i.e. the steady state assumption) does not hold.
  • a pulsed waveform by definition has a leading edge and a trailing edge.
  • the leading edge of a received pulse may reach some elements 30 of receive array 28 before it reaches other elements 30.
  • some elements of receive array 28 may have outputs of zero while other outputs have a magnitude equal to the steady state amplitude of the received pulse. This can cause significant errors in the angle of arrival estimates calculated by the methods above. Such errors could cause undesired artifacts in the image produced by the system.
  • One way to reduce the proportion of time during which the steady state assumption does not hold is to keep the overall length of receive array 28 small.
  • the problem posed by the rising and falling edges of received pulses can also be ameliorated by filtering the signals received by receive array elements 30 with a filter having carefully chosen characteristics.
  • the introduction of such ringing which is known as the Gibbs phenomenon, introduces ripples into the response of the system to pulses. This, in turn, can lead to errors in the angle of arrival estimates.
  • the outputs of elements 30 should be filtered with filters which provide a smooth frequency response.
  • a Gaussian filter characteristic as described in R. E. Ziemer and W. H. Tranter Principles of Communications Houghton Mifflin Company, Boston Mass., 1976 may be used to smooth the leading and trailing edges of received pulses without introducing significant variations in steady state regions of the system response pulse.
  • filters having other smooth filter characteristics may be selected for use in smoothing the leading and trailing edges of received pulses in place of a filter having a Gaussian filter characteristic.
  • a suitable filter may be implemented by digitally filtering the sampled signals received at receive array 28 (step 350).
  • G n is a complex quantity. That is, the channels may be mismatched in both phase and amplitude. Where channel gains are mismatched but can be individually measured correction factors may be applied to the sampled values after they have been collected. In some systems the channel gain is time varying.
  • model assumed by the methods of this invention can reasonably accurately resolve small contiguous scattering regions provided that the scattering distribution within these regions does not produce interference nulls near the direction of the receiver transducer array.
  • a first way is to use the methods of the invention to enhance one or more portions of an image produced by conventional beam formed imaging techniques.
  • the methods could be used to increase the resolution of images of objects in an image obtained by beam formed acoustic imaging in two dimensions with an N element linear array (e.g. an electronically scanned sector scan sonar).
  • N element linear array e.g. an electronically scanned sector scan sonar
  • a beamformed medical ultrasound image may reveal an area of interest (e.g. a breast calcification) for which resolution enhancement is desired and where the feature appears to satisfy the model assumptions.
  • the selected portion of the image may then be enhanced by reprocessing the array data using the presumed spatial model.
  • the enhanced result can then be confirmed by independently repeating the process a number of times possibly from different viewing angles.
  • the same procedure can also be used in underwater acoustic imaging.
  • Spatial filtering and spatial modelling can be combined to provide image enhancement. This is preferable where the image includes dissimilar objects.
  • a number of parallel beams are formed by grouping receive transducer elements into sub-arrays. The beams will have equi-spaced phase centres.
  • spatial modelling may be applied using the outputs of the parallel beams rather than the individual array element outputs for the samples of the scattered signal.
  • FIG. 5 is an expanded functional block diagram showing an example of a prototype apparatus 50 adapted for small aperture underwater imaging according to the invention.
  • apparatus 50 is a multi-channel coherent sonar similar in architecture to existing multi-beam systems but with far fewer receive channels than a typical beamformed imaging sonar.
  • apparatus 50 is a multi-element sidescan sonar similar to existing interferometric sidescan systems but with more than just two sidescan array elements.
  • the objective of the new sonar concept is to sort acoustic backscatter based on vertical angle-of-arrival ⁇ , as a function of range R.
  • Apparatus 50 may therefore be called Small Aperture Range versus Angle ("SARA") sonar.
  • SARA Small Aperture Range versus Angle
  • Apparatus 50 has a transducer array 54 connected to a sonar transceiver 56.
  • Transceiver 56 is operated by a controller 58.
  • Sets of data samples received at transducer 56 are collected and transmitted through a data link 61 to a processor 59 by controller 58.
  • processor 59 the data samples are processed, as described above, to produce image data. This image data is displayed on an imaging device 63.
  • Array 54 comprises a number of elements 30.
  • Array 54 is dimensioned such that its length is less than the spatial length of scattered acoustic pulses. This is because the pulse length of scattered pulses from all angles of arrival of interest must be long enough to encompass the entire array 54. In general, range resolution decreases as the pulse length increases. Therefore in most sonar systems it is preferable that the length of array 54 should not exceed about 10 wavelengths. If the elements of array 54 are spaced 1/2 wavelength apart then, in general, it is preferable that the number of elements in array 54 should be less than about 20. A practical apparatus which demonstrates the advantages of the invention may be made, for example with an array 54 having 6 elements.
  • Transceiver 56 is interfaced with a transceiver interface 60 in sonar controller 58.
  • Transceiver 56 has a separate channel for each element 30 of transducer array 54. Preferably, for maximum versatility separate circuitry is used for each channel.
  • FIG. 6 is a functional diagram of circuitry for implementing one channel of transceiver 56.
  • Transceiver 56 is configured to transmit a pulse and, for a period after the pulse has been transmitted, to receive scattered signals.
  • Transceiver 56 has a transmitter 80.
  • Transmitter 80 comprises an H bridge MOSFET switch which toggles two transducer terminals between ground and the potential of an external high voltage supply 82 (FIG. 4). To generate each pulse, the H-bridge is switched at the carrier frequency for a number of cycles determined by the desired pulse length.
  • Transmitter 80 is coupled to a transducer element 30 via a transmit/receive switch 84.
  • Switch 84 may, for example, comprise a circuit as shown in FIG. 7.
  • diodes 205 and 206 conduct and clip the signal transmitted by transmitter 80 to prevent overloading the input of the receiver.
  • Diodes 201, 202, 203, and 204 have a negligible effect on the signal transmitted by transmitter 80.
  • diodes 201, 202, 203, and 204 isolate receiver preamplifier 86 from the impedance of transmitter 80.
  • Diodes 205 and 206 are not conducting. It is assumed that the received signals are less than the clipping voltage of diodes 201 through 206.
  • transmit/receive switch 84 After a pulse has been transmitted, transmit/receive switch 84 is switched to its "receive" position. Signals received at transducer element 30 then pass through transmit/receive switch 84 to receive preamplifier 86. Receive preamplifier 86 buffers the input from transducer element 30 and is preferably a low gain, high impedance, wide bandwidth, low noise preamplifier. A relay 88 may be provided to enable the input of preamplifier 86 to be selectively connected to a test input for diagnostic purposes.
  • Amplification and filtration stage 90 comprises three low noise wide bandwidth variable gain amplifiers 92, 94 and 96 a buffer amplifier 98 and five separate RLC filters 102, 103, 104, 105, and 106.
  • the maximum gain of stage 90 is about 120 dB.
  • the gain of stage 90 can be set by placing a desired value at the head of buffer 110. Digital to Analog converter 112 reads this value and produces an output voltage which sets the gains of amplifiers 92, 94 and 96.
  • Time variable gain (TVG) may be implemented by placing a series of values in buffer 110 and sequentially moving the values to the head of buffer 110 each time it is desired to change the gain of stage 90.
  • Filters 102, 103, 104, 105, and 106 are tuned to provide the desired bandwidth.
  • the carrier frequency is 300 kilohertz
  • filters 102, 103, 104, 105, and 106 may be tuned to provide a 3 dB bandwidth of 60 kHz and a combined rolloff of 30 dB/octave.
  • Buffer amplifier 98 provides a manually adjustable gain stage to compensate for filter insertion losses before the input of Analog to Digital converter ("ADC”) 120.
  • ADC 120 After each pulse, ADC 120 periodically samples the output of stage 90. For each sample, ADC 120 makes two conversions spaced apart in time by 1/4 of a carrier cycle. These two conversions can be used to obtain both in phase and quadrature components of the received signal. Each sample, comprising both inphase and quadrature components, is stored in a buffer 122. Typically ADC 120 will sample the output of stage 90 between a few dozen and a few tens of thousand times for each pulse.
  • ADC 120 may be replaced with a pair of slower ADC's sampling synchronously 1/4 of a carrier cycle apart. This alternative construction introduces errors because the two slower ADC's will not, in general, be perfectly matched. In the alternative, ADC 120 could be operated to make two conversions for each sample separated in time by n/4 ⁇ c where n is an odd integer. This construction introduces errors as a result of inphase/quadrature sample timing skew but may be used to practice the invention with less expensive, more readily obtainable ADC's.
  • Buffer 122 stores sampled data for processing by processor unit 59. Data from one or more pulses may be stored in buffer 122 and then the contents of buffer 122 may be transmitted to processor unit 59 under the control of controller 58 for processing. In the alternative, if processor unit 59 and data channel 61 are fast enough then data may be transmitted to processing unit 59 as it is received and processed in real time.
  • a three dimensional image may be built up by changing the orientation of transducer array 54 after one or more pulses. This may be accomplished, for example, by pivoting transducer array 54 through a small angle about an axis after each set of one or more pulses has been transmitted and the resulting scattered signals have been received.
  • the rotation may, for example, be driven by a stepper motor controlled by controller 58.
  • a 3D sector scan sonar may be implemented by using a small number of vertically stacked transducer elements to afford vertical imaging in addition to conventional horizontal scanning.
  • Controller 58 comprises a timer 72.
  • Timer 72 comprises a number of counter/timers which coordinate the operation of transceiver 56. For example, timer 72 generates triggers which cause transceiver 56 to: begin and end transmitting pulses; sample received pulses; and, update the time variable gain value which sets the gain of amplifiers 92, 94 and 96.
  • the operation of timer 72 is conventional and is known to those skilled in the art.
  • Controller 58 also comprises a processor 66.
  • Processor 66 has three primary functions. Firstly, processor 66 controls the uploading of sampled data to processing unit 59. Secondly, processor 66 receives and implements commands sent by processing unit 59. For example, processing unit 69 might send a command requiring that the length of transmitted pulses be increased. Processor 66 would receive the command and write appropriate values to registers in timer unit 72 to implement the command. Thirdly, processor 66 controls the orientation of transducer array 54 through a suitable interface connected to stepper motor 74.
  • Controller 58 may be equipped with suitable user interfaces such as a keyboard connector 73, display driver 70 and display connector 71 to allow trouble shooting of controller 58.
  • Data channel 61 is a suitable data link capable of carrying commands and configuration information from processing unit 59 to controller 58 and data from controller 58 to processing unit 59.
  • Data channel 61 may, for example, comprise an Ethernet connection incorporating suitable hardware and software interfaces at controller 58 and processing unit 59.
  • Processing unit 59 preferably comprises a programmed general purpose computer.
  • Display device 63 comprises, for example, a monitor or a plotter connected to processing unit 59.
  • FIGS. 3B and 3C illustrate the operation of computer software running in processing unit 59 for implementing the methods of the invention.
  • the software may be written in the C programming language. Of course, other programming languages such as MATLAB could be used to create suitable processing software.
  • the approach of this invention is not limited by the physical size of the receive transducer array but instead by model uncertainties. Therefore high resolution images may be obtained using a small aperture.
  • the invention has been described herein using as an example, acoustic imaging of the sea floor.
  • the invention could also be applied to other imaging situations wherein image data is obtained transmitting a pulse of acoustic or electromagnetic radiation and then detecting a scattered signal.
  • the invention could be applied to medical or commercial ultrasound imaging or radar imaging.
  • apparatus 50 in which processing steps are performed in a programmed general purpose computer. In some cases it might be desirable to create hardware for implementing these processing steps.
  • data collection and data processing are performed in physically separate devices connected by data link 61. It would be possible to perform the data collection and data processing step in a single device. For example, if processor 66 in controller 58 is sufficiently powerful then processor 66 could be used to implement the processing steps described above as being carried out in processor unit 59.
  • the invention may be provided to users in various ways.
  • the invention may be provided in the form of apparatus adapted for practising the methods of the invention.
  • the invention may also be provided in the form of a computer readable medium containing computer software which, when run on a computer system will cause that computer system to implement the processing steps of the invention.

Abstract

An apparatus and method for imaging uses a transducer array which receives a scattered signal from a region of interest. The method analyses the scattered signal on the basis of a model which assumes several independent point scatterers at each range. The method determines the amplitudes and angles of arrival for the several scatterers. The method provides much higher resolution than is possible with conventional beam formed sonar arrays of practical size. The method is capable of resolving features which cannot be resolved by conventional sidescan sonar or interferometric side scan sonar. The method may be used with electromagnetic or acoustic scattering signals.

Description

FIELD OF THE INVENTION
This invention relates generally to the field of constructing 2-dimensional or 3-dimensional images of surfaces and objects in a volume from signals scattered by those surfaces or objects. The invention has particular application in acoustic imaging. The invention may also be applied to radar imaging. The invention may be applied to terrain mapping, object detection, object avoidance, medical ultrasound imaging and the like.
BACKGROUND OF THE INVENTION
Acoustic imaging is used as an adjunct to optical imaging in media where light is either unavailable or severely attenuated. Underwater acoustic imaging is generally used in place of optics at ranges greater than 10 meters, when water conditions are turbid, or when ambient light is insufficient and it is impractical to provide artificial light. Medical ultrasound is used in place of optics for inexpensive noninvasive imaging of and through fluid bathed tissue and organs.
In both underwater acoustic imaging and medical ultrasound, acoustic images are constructed by transmitting acoustic energy into an environment (typically but not necessarily fluid filled) and then measuring and sorting the received echoes according to their spatial origin. This sorting is usually accomplished with either an acoustic lens or a beam former through a process known as spatial filtering. Acoustic imaging is similar in process to optical imaging, however acoustic wavelengths at frequencies practical for ocean or medical imaging are considerably larger than optical wavelengths and therefore acoustic image resolution is comparatively quite poor, even with much larger physical apertures.
Most attempts to improve the spatial resolution of acoustic imaging systems have focussed on increasing the size of the aperture in the system. While it is possible to construct acoustic imaging systems which have large apertures and therefore have improved spatial resolution, such systems are physically large and complicated. They would not be appropriate, for example, for use on a small autonomous underwater vehicle.
Prior art methods for acoustic imaging may be divided into two main categories, beam former or lens based imaging and spatial modelling based imaging. Beamformer or lens based imaging methods presume a full and continuous angular arrival spectrum. The angle of arrival of a reflected signal is measured directly by performing spatial filtering to sort the entire spectrum into bins. The angular extent of each bin (beamwidth) decreases approximately as the inverse of the number of equi-spaced array elements. In the simplest example of beamformer imaging, a single point scatterer is excited monostatically by a short, narrow band acoustic pulse. The resulting backscatter is received by an N element linear array of transducers with half wavelength element spacing ##EQU1## Scanning a beam, formed from the array elements, across the scatterer will produce a two dimensional image with range resolution determined by the acoustic pulse length and angular resolution governed by the array aperture size (e.g. by N).
A spatial modelling approach, on the other hand, is able to utilize as few as 2 array elements to produce a similar two dimensional image by estimating the backscatter wave number (i.e. angle-of-arrival (AOA)). The range resolution remains the same as for the beamformed case however, the angular resolution is no longer restricted by the aperture size and instead is limited only by the adherence of the signal to the underlying model assumptions and the display pixel size. The disadvantage of spatial based modelling is that the image will be valid only when the underlying model is satisfied. Artifacts of various kinds may be created if the underlying model is not satisfied.
An example of a successful spatial modelling based imaging method is sidescan sonar. In sidescan sonar a short acoustic is pulse is transmitted from a single transducer array. The array is designed to generate a fan-shaped beam that is quite narrow in the horizontal direction. The beam is oriented in a side-looking geometry. After an acoustic pulse has been transmitted the array detects a backscattered signal from the narrow strip of seafloor illuminated by the transducer beam pattern. The signal reflected from the seafloor is detected by the transducer. In sidescan sonar the angle of arrival of the backscattered signal is not directly measured. Instead, the acoustic angle-of-arrival, θ, is inferred from the time of arrival of the reflected signal. That is, the angle of arrival is assumed to be a function of range, R. The function can be derived from the known sonar altitude, H and the assumption that the seafloor is predominantly flat. Successive strips are imaged by plotting the backscatter intensity in x at constant y and then advancing the sensor platform along the Y axis and repeating the transmit/receive operation. The resulting two dimensional image can be quite spectacular with an angular image resolution that is far superior to that achievable via beamforming. Sidescan sonar is widely used for qualitative seafloor exploration and search applications. A problem with sidescan imaging is that the sea floor is, in general, not flat. This departure from the model can result in the generation of various artifacts in a sidescan sonar image and makes sidescan sonar unsuitable for making quantitative measurements.
A variation of sidescan imaging is swath bathymetry sidescan ("SBS"). In SBS, a vertical linear array of two sets of transducers is used. Differential phase between the two sets of transducers in the array can be used to directly estimate the backscatter angle-of-arrival as a function of time instead of relying on the assumption that the seafloor is flat. Because θ is measured rather than assumed, SBS can, under favourable backscatter conditions, provide an accurate geometric representation of the imaging surface and can therefore be used for quantitative bathymetric mapping as well as qualitative imaging.
Both SBS and conventional sidescan sonar presume one scatterer per range cell. In practice, multiple scatterers may actually contribute to the backscatter signal measured at a particular instant. The backscattered signals from such multiple scatterers can interfere at the receive transducers. If the amplitude of the backscatter is corrupted by scatterer interference then the image is said to include "scintillation" or "speckle". Similarly, if the differential phase of the backscatter is corrupted by scatterer interference the image is said to include "glint". Both scintillation and glint are well known sources of distortion not only in underwater acoustic imaging and mapping systems but also in terrestrial and space radar imaging and mapping systems.
There is a need for acoustic imaging methods and apparatus which provide better spatial resolution than is currently available. There is also a need for acoustic imaging methods which reduce the incidence of artifacts produced by conventional sidescan systems or SBS systems.
SUMMARY OF THE INVENTION
This invention provides a method for imaging a region. The region may be under water. The method begins by transmitting a pulse toward the region. The pulse may be an acoustic pulse or an electromagnetic pulse. The method continues with the step of detecting a signal scattered from the region to yield a multi-channel scattering signal at a receiver transducer array comprising a plurality of N elements. L snapshots are obtained, where L is an integer with L≧1, by sampling the scattering signal at one or more instants after transmitting the pulse to yield a plurality of complex samples. In a processing device, which may be a programmed computer, the plurality of complex samples are processed to obtain image data comprising angles of arrival from M principal scattering components, where M is an integer, with 1≦M≦N-1. The case where M≧2 provides particular advantages over the current state of the art. Preferably the processing is performed by: constructing a sample matrix SL,M,N from the complex samples; from the sample matrix computing a null-space vector w comprising a plurality of entries; computing a plurality of roots of a polynomial formed from the entries of the null-space vector; and, from the roots of the polynomial computing angles of arrival for M principal scattering components. Finally, the method stores the angles of arrival as image data.
In preferred embodiments the step of computing the null space vector comprises numerically finding a vector w in a search space according to a best fit criterion. The best fit criterion may be selected from the group consisting of: maximum likelihood, sub-space decomposition fitting or least squares.
Preferably, the step of processing the plurality of complex samples comprises: selecting those roots of the polynomial which have a magnitude in the range of 1-Δ1 to 1+Δ2, where Δ1 and Δ2 are predetermined threshold values; and storing as image data only the angles of arrival corresponding to the selected roots.
Most preferably processing the complex samples comprises computing amplitudes for the M scatterers from the sample matrix and the angles of arrival and storing the amplitudes with the image data. The amplitudes may be compared to a threshold a binary value indicating whether the amplitudes are greater than or less than the threshold may be stored with the image data. This reduces storage requirements for the image data and simplifies display of the image data.
The step of processing the plurality of complex samples optionally includes the steps of: forming Q beams with offset phase centers by taking linear combinations of the complex samples, where Q≦N, and forming the sample matrix from outputs of the beams.
Another aspect of the invention provides a method of producing image data by processing scatter signal data received at a multi-channel transducer. The scatter signal data comprises a plurality of sets of complex samples detected sequentially at a transducer array. Each set comprises a complex sample obtained from each of a plurality of elements in the array. The method comprises: constructing a sample matrix SL,M,N from the complex samples; computing a null-space vector w having a plurality of entries from the sample matrix such that: SL,M,Nw=0 ; computing the roots of a polynomial formed from the entries of the null-space vector; computing angles of arrival for one or more principal scatterers from the roots of the polynomial; and, storing the angles of arrival as image data.
Yet another aspect of the invention provides an imaging system comprising: a transmit transducer; a pulse generator connected to the transmit transducer; a receive transducer array; a receiver connected to the receive transducer array; a processor connected to receive the series of complex samples from the digital to analog conversion circuit and, a display device driver. The receiver comprises: a multi-channel amplifier for amplifying scattered signals detected by each element of the receive transducer array; and, a digital to analog conversion circuit connected to the multi-channel amplifier to sample the amplified scattered signals to produce a series of complex samples. The processor is adapted to, for each of a plurality of ranges: select a group of complex samples corresponding to a range; construct a sample matrix SL,M,N from the group of complex samples; compute a null space vector w comprising a plurality of entries from the sample matrix; compute the roots of a polynomial formed from the entries of the null-space vector; compute angles of arrival for one or more scatterers from the roots of the polynomial; compute amplitudes for the one or more scatterers from the sample matrix and the angles of arrival; and, store the range, angles of arrival and amplitudes as image data. The display driver is connected to receive the image data and to display the image data on a display device. The transmit transducer may comprise one or more of the same transducer elements which make up the receive transducer array.
Yet another aspect of the invention provides a processing unit for processing scattering signal data received at a multi-channel transducer to yield image data, the scattering signal data comprising a plurality of sets of complex samples, the sets detected sequentially at a transducer array, each set comprising a complex sample obtained from each of a plurality of elements in the array. The processing unit comprises: means for selecting a group of complex samples corresponding to a distance range; means for constructing a sample matrix SL,M,N from the group of complex samples; means for computing a null-space vector w comprising a plurality of entries from the sample matrix; means for computing the roots of a polynomial formed from the entries of the null-space vector; means for computing angles of arrival for two or more scatterers from the roots of the polynomial; means for computing amplitudes for the two or more scatterers from the sample matrix and the angles of arrival; and, means for storing the range, angles of arrival and amplitudes as image data.
The invention also provides a computer readable medium containing computer software. The computer software, when run on a computer, causes the computer to operate so as to provide a processing means for: constructing a sample matrix SL,M,N from a set of complex samples; obtaining from the sample matrix a null-space vector w; computing the roots of a polynomial formed from the entries of the null-space vector; computing angles of arrival for one or more scatterers from the roots of the polynomial; computing amplitudes for the one or more scatterers from the sample matrix and the angles of arrival; and, storing the angles of arrival and amplitudes as image data.
Other aspects and advantages of the invention will become apparent to those skilled in the art who read and understand the following disclosure.
BRIEF DESCRIPTION OF THE DRAWINGS
In drawings which illustrate and explain specific embodiments of the invention, but which should not be construed so as to limit the scope of the invention,
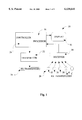
FIG. 1 is a functional block diagram of an acoustic imaging system according to the invention;
FIG. 2 is a schematic drawing showing a number of scatterers in the far field of a receiver array;
FIGS. 3A, 3B and 3C are flow diagrams illustrating one example of an imaging method according to the invention;
FIG. 4 is a schematic diagram illustrating the use of apparatus according to the invention to image a vertical structure on a generally horizontal portion of the sea floor;
FIG. 5 is an expanded functional block diagram showing an example of a prototype apparatus adapted for small aperture underwater imaging according to the invention;
FIG. 6 is a functional diagram of circuitry for implementing one channel of a transceiver in the apparatus of FIG. 5; and,
FIG. 7 is a schematic illustrating a simple transmit/receive switch that may be used in the invention.
DETAILED DESCRIPTION
FIG. 1 is a functional block diagram of an acoustic imaging system 20 according to the invention. FIG. 3A illustrates a method 300 implemented when system 20 is operated. Imaging system 20 comprises a transmitter 22 connected to a transmit transducer 24. Transmitter 22 and transmit transducer 24 are operated under the control of a controller 26 to insonify the environment which is to be imaged. Transmitter 22 is pulsed on and off. Transmitter 22 is preferably operated to produce short pulses of sound directed toward a region to be imaged (step 310). The range of objects being imaged at any instant can be determined from the time since the pulse was transmitted. The range resolution is determined by the transmit pulse bandwidth. Transmit transducer 24 preferably provides a fan-shaped beam pattern so that the transmitted signal stx (t) can be considered to propagate in a two-dimensional plane (i.e. a slice of a three-dimensional volume).
The transmitted signal stx (t) may take many forms, for example, the transmitted signal pulse may be a simple gated sinusoid, a swept FM chirp, an M-sequence PSK waveform. The sinusoidal signal represents the fundamental waveform. Other waveforms can be analysed as superpositions of sinusoidal waveforms. Consequently, a sinusoidal waveform will be used to explain the operation of this invention. In preferred systems non-sinusoidal waveforms may be used to afford post processing signal-to-noise ratio improvement by increasing the time-bandwidth product as is known to those skilled in the art.
The transmitted signal propagates into the environment and is scattered by surfaces or objects in the environment. As a result, a scattered signal propagates toward a receive transducer 28. Receive transducer 28 is typically located near transmit transducer 24. In general, receive transducer 28 may be remote from transmit transducer 24. Receive transducer 28 comprises a linear array of N transducer elements 30 spaced apart from one another by a distance d. In practice the same transducer may serve both as a transmit transducer 24 and as receive transducer 28. A receiver 34 is connected to receive the scattered signals s1 (t), s2 (t), s3 (t) . . . sN (t) (FIG. 2) received respectively at the N elements 30 of receive transducer 28 (step 314). Receiver 34 filters and amplifies the received signals (step 318) and periodically samples the inphase and quadrature components at the outputs of each of elements 30 (step 322).
Receiver 34 should be capable of sampling the inphase and quadrature components of the outputs of elements 30 at a rate which is at least equal to the receiver bandwidth about the carrier frequency of the transmitted signal stx (t) in order to avoid aliasing. The sampled signals are optionally stored (step 324) and conveyed as complex samples (each complex sample typically consists of inphase and quadrature samples) to a processor 35 in controller 26 (step 326).
Processor 35 may begin processing as soon as the first set of samples has been received or may process a complete set of sampled signals after all of the samples have been taken and stored. Processor 35 processes the sampled signals to yield image data (step 328) and assembles an image which is displayed on a display 36 (step 330). Processor 35 may process the sampled signals in real time or may process stored sampled values. Processor 35 may simply store the image data for later display or manipulation. The image data may be displayed or used as input for another processing stage, such as a stage for generating a contour map.
System 20 optionally accepts input from a user as to new values for various parameters used during processing and/or data collection/display steps 310-330 (step 332) the image data may then be re-calculated or re-collected and re-calculated for display using the new parameter values. This permits the displayed image to be fine tuned by a user.
Before further describing apparatus which may be used in the practice of the invention, the processing methods of the invention will be described in detail. The systems and methods of this invention are based upon a model which assumes up to M scatterers at each range. The model assumes that the scatterers are sufficiently far away as compared to the wavelength of the scattered signals so that the signal scattered by each scatterer can be treated as a plane wave upon arrival at receive transducer array 30 (the far field assumption). This invention provides imaging systems and methods in which an image is constructed by explicitly computing as many as M=N-1 plane wave arrival angles, or arrival angles and amplitudes, as a function of range from an N element linear array. Resolution is increased as compared to prior art beamformed imaging systems because the model predetermines the nature of the imaging geometry and then uses the received signal to fine tune the model.
FIG. 2 illustrates schematically a situation where M independent scatterers at a range R(t) each scatter a signal having a complex amplitude αm (t) toward N element receiver transducer array 28. We assume the far field condition and that the scattered signal from the Mth scatterer has a constant complex amplitude αm ; with 1≦m≦M across all of the elements 30 of receiver array 28 (the steady state condition). The signal sn at the nth element 30 at a particular instant in time can thus be written as: ##EQU2## where um =ksinθm is the acoustic wave number; θm is the angle-of-arrival of the scattered signal from the mth scatterer; k=2π/λ; λ is the acoustic wavelength at the carrier frequency, and j is the square root of -1.
The assumed model has 2M unknown parameters, M values for αm and M values for um. Generating an image according to a general embodiment of the invention involves using measured values of sn to solve for these 2M unknown parameters.
Several methodologies exist for deriving the 2M parameters from the array measurements. These methods include an exact solution method, applicable in the idealized case, as well as numerous "best fit" solution methods more suitable when the signal model is better viewed as an approximation to real scattering signals. In order to illustrate the mathematical principles behind the invention, the idealized case is considered first and the exact solution strategy is described. The exact solution strategy is then extended to demonstrate one example of a best fit solution strategy for application to real scattered signals. Those skilled in the art will appreciate that there may be numerous variations of the particular methods described herein which may all be used without departing from the scope of this invention. Some of these variations are discussed below.
Under the idealized scattering conditions illustrated in FIG. 2, the scattered signals received by the array elements 30 are exactly described by equation (2). One can solve first for the parameters um by finding an array of N steering coefficients wn such that the null-steering equation: ##EQU3## is satisfied. This equation can be rewritten by substituting the value of sn from equation (2) to yield: ##EQU4## where W(z) is the z-transform of the array steering coefficients wp and is a polynomial of order N-1.
The sum in equation (4) will equate to zero independently of the amplitudes αm if W(z) is zero at each of the z-plane evaluation points z=eidu.sbsp.m. One evaluation point is associated with the direction of each of the M scatterers. W(z) has N-1 roots and can therefore satisfy equation (4) provided that the number of array elements 30 is at least M+1. To avoid the trivial solution one can set w0 =1.
Solving equation (4) for the 2M parameters is accomplished in two steps. First, M linearly independent instances of equation (4) are used to solve for the wavenumbers of M scattered signals. Next, the same set of independent equations and the newly obtained wavenumbers are used to compute the complex amplitudes of the scattered signals. The required M linearly independent equations may be obtained by finding situations where αm vary independently for constant wavenumbers um.
There are two main ways to obtain the M independent equations. The first way is used when the signals received from the M scatterers are coherent or only a single "snapshot" is available. A snapshot is a set of complex samples taken at the same instant from each of the elements 30 of receive array 28. Using a single snapshot provides maximum range resolution. The second way can be used when the signals from the M scatterers can be assumed to be uncorrelated but cannot be used when the signals are correlated. In practical terms, the methods of the invention differ between these two cases in the number of scatterers M that can be resolved with a given receive array 28 and the number of snapshots that must be used to resolve the amplitudes and angles of arrival from the M scatterers. The coherent case will be addressed first. The general methods of the invention are illustrated by the coherent case. The methods of the invention are extended to the uncorrelated case below. Finally a generalized procedure which can accommodate both is coherent and incoherent scattering assumptions is presented.
For M scatterers, which may be coherent or incoherent, the M necessary equations may be obtained by subdividing the N elements 30 into M overlapping sub-arrays each having M+1 elements. The M sub-arrays yield M independent equations in the form of equation (4). These equations can then be solved to yield the M values of wp needed to satisfy equation (4). For example, the null-steering equations for two sub arrays are given as follows: ##EQU5## where αm and αm are independent.
Thus, the process for computing the directions of M coherent point scatterers from complex samples taken at 2M elements of a transducer array can be summarized as shown in FIG. 3B and described using vector notation as follows. A group of complex samples to be used for a given range is identified (step 352). This group may consist of a single snapshot containing a complex sample taken at each element 30 of receive array 28. Then a sample matrix S is prepared using the group of complex samples as its elements (step 354). The sample matrix S contains measured complex values representing the inphase and quadrature components of scattered signals received at the elements 30 of receive array 28. The sample matrix may have various forms but can be conveniently represented as follows: ##EQU6## Where S=SL,M,N is the sample matrix formed from L snapshots to solve for M scatterers using signals received at a receive array 28 having N elements 30. For the coherent case the array 28 is taken as consisting of M overlapping sub-arrays (requiring 2M elements). As few as L=1 snapshots may be employed.
The null steering equation can then be represented as follows:
Sw=0                                                       (8)
This equation can be solved using standard numerical computing techniques to yield the unknown null steering vector (or "null space vector") w (step 358). A polynomial W(z) is then formed (step 362) as follows:
W(z)=z.sup.M +w.sub.1 z.sup.M-1 +w.sub.2 z.sup.M-2 +. . . +w.sub.M(9)
The M roots [z1, z2, . . . , zM ] of equation (8) are then calculated (step 364) by standard techniques. The wave numbers corresponding to each of the M scatterers are then calculated (step 368) from: ##EQU7## The angles of arrival from each of the M scatterers can then be calculated (step 372) from: ##EQU8## Once the angles of arrival from the scatterers have been calculated the scattering amplitudes αm can be calculated (step 374) from the matrix equation: ##EQU9## where B is the matrix: ##EQU10## and s is a column vector formed from one snapshot across M consecutive elements of array 30 (e.g. [s1 (l) s2 (l) . . . sM (l)]T).
The inverse of B can be calculated by standard numerical means. In the alternative, if only the magnitudes of the scattering amplitudes are required, as is common in imaging applications, then the scattering amplitude magnitudes may be computed by the following equation (13):
|α|=diag(αα.sup.H)     (13)
where: ##EQU11## and:
R.sub.L,M,N =S.sub.L,M,N.sup.H S.sub.L,M,N                 (15)
and SL,M,NH is the Hermitian transpose of SL,M,N.
The difference between the two methods for computing the magnitude of the scatterer amplitudes is that the second method (equations (13)-(15)) allows all L snapshots to be incorporated into each magnitude solution and is therefore effective when a best fit magnitude solution is desired.
Each set of values for αm and um corresponds to a specific range. The range is known from the time at which the scattered signal is sampled. An image can then be prepared from the known values for the range and angles of arrival. Preferably the scattering amplitudes are also used in the preparation of the image. The range and angle of arrival identify a specific pixel in the image. The scattering amplitude may be represented as the intensity or colour of the pixel.
In some cases it may be preferable to compare the scattering amplitude to a threshold value. In one embodiment the scatterer is not displayed unless its amplitude exceeds the threshold value. If the scatterer is displayed then it may be displayed either in a way which depends on the scattering amplitude or all displayed pixels may be displayed in the same way. In the second case the image data requires less storage space.
The foregoing method of image generation requires only a single "snapshot" to produce the image pixels at each range. That is, the image pixels at each range can be generated by sampling the outputs from elements 30 of receive array 28 once at each range (i.e. once in each time slice following the transmission of a pulse). The image pixels may be displayed in various ways to yield 2-dimensional or 3-dimensional images. This method requires a receive transducer array having 2M elements 30.
It can be shown that angles of arrival for M independent scatterers can be measured with fewer than 2M elements in array 28 if the angles-of arrival of the scattered signals change slowly as a function of time. The angles of arrival will change slowly as a function of range in many real situations. Consider, for example, the situation shown in FIG. 4 where contributing scatterers change as the transmitted acoustic pulse stx (t) propagates along the seafloor and down a vertical feature. At each instant the signal which is scattered back toward receiver array 28 is scattered by a different group of scatterers. It is therefore possible to obtain multiple independent snapshots for the same principal scattering components (e.g. the same portion of the sea floor and vertical feature). Thus, M independent equations may be obtained by assuming that um changes only slowly from snapshot to snapshot and that αm is uncorrelated from snapshot to snapshot. This assumption is often a good assumption because, at each instant, αm is the result of scattering by a different group of scatterers.
Where αm is uncorrelated from snapshot to snapshot we can obtain M independent equations from only N=M+1 elements. In this case the sample matrix becomes: ##EQU12##
Where SM,M,M+1 is the sample matrix formed from M snapshots to solve for M scatterers using M+1 elements 30 in receive array 28. Equation (7) can then be solved as set out above to yield angles of arrival and amplitudes using the sample matrix of equation (14). M snapshots (sets of samples) from a single array are used to produce image pixels at each range instead of 1 snapshot taken as M sub-arrays, as set out above. It can be appreciated that range resolution is degraded by using multiple snapshots.
It is possible to generate a sample matrix which includes both information from a number of sub-arrays and information from a number of sequentially taken snap shots. This essentially combines the sample matrices of equations (6) and (16) to yield a sample matrix which provides (N-M)L equations. This sample matrix may be represented as follows: ##EQU13## Here, SL,M,N is the sample matrix for L snapshots taken from a receive array 28 having N elements which may be used to solve for M scatterers. Using a null steering equation based upon the sample matrix of equation (17) it is possible to use the information taken from an N element receive array to solve for the angles of arrival and amplitudes of up to M=N-1 scatterers.
In any real system, noise received at receive array 28 and instrument limitations will corrupt the signals being measured. These errors, which affect each measurement in an unknown way, make it impossible to calculate an exact solution for w, as described above. Instead, it is necessary to attempt to find the best possible solutions which fit the samples taken to within the uncertainty introduced by the error.
There are several strategies that may be used for finding a "best" solution. These strategies include "Least Squares" methods that minimize, in a least squares sense, the output of the null steering equations derived in the exact solution method described above. Alternatively, the sample matrix, or a modification thereof, may be used to derive an estimate of the "spatial covariance matrix". The least squares solution obtained from the array sample matrix can also be obtained from the estimated spatial covariance matrix when the estimated spatial covariance matrix is computed from equation (15). Other solution methods such as "Maximum Likelihood" methods and "Sub-space Decomposition" methods typically utilize the spatial covariance matrix formulation. These methods are related to the Least Squares method but utilize different criteria for choosing the angles of arrival that best fit the measured array data. All of these methods are known to those skilled in the art.
For the purpose of illustration, a Least Squares solution methodology is described here. Those skilled in the art will appreciate that other recognized methods for finding the angles of arrival and associated scattering amplitudes which best fit the measured data may be used without departing from the invention.
Solving for angles of arrival by the least squares method involves obtaining a least squares estimate of the null steering vector w. This may be done using the least squares formulation of equation (7) as follows:
w=min(w)|S.sub.L,M,N.sup.W |.sup.2       (19)
where min(w) indicates minimizing over w. Although a solution to equation (16) is possible for a matrix SL,N,M having any number of rows, in order for a solution to be credible the number of linearly independent rows (the rank of SL,N,M) should be at least equal to M. Thus, where single snapshots are taken, the minimum number of elements 30 in array 28 is 2M. On the other hand, where M=N-1, the minimum number of uncorrelated array snapshots is L=N-1 and the array cannot be divided into sub arrays.
Equation (16) can be solved numerically using techniques well known to those skilled in the art. For example, as shown in FIG. 3C, the sample matrix is first partitioned (step 380). The partition arises from equation (7) and the fact that the first entry in w is 1 (i.e. w0 =1 in order to avoid the trivial solution w=0). The partition allows the unknown values of w to be grouped on one side of the equation and the remaining constant term on the other side as:
Sw=s                                                       (19)
where: ##EQU14## and:
s=[-S.sub.1,1 -S.sub.2,1 -S.sub.3,1 . . . ].sup.T          (21)
and:
w=[w.sub.1 w.sub.2 w.sub.3 . . . ]                         (22)
Singular value decomposition of S (step 382) can then be used to compute its pseudoinverse (step 384) in order to solve for the unknown null space coefficients w (step 386).
In the foregoing discussion the value of M has been chosen based upon the number of array elements and whether or not the scattered signals can be assumed to be uncorrelated. Since any modelling approach tries to fit the data to a model as best it can, over modelling (using a value of M which is too large) or under modelling (using a value of M which is too small) will degrade the results and may introduce modelling artifacts.
In general applications of the invention, a value for M is chosen such that N/2≦M≦N-1. The value for M may be chosen during the design of a system according to the invention or a system may be designed which allows a user to select an appropriate value for M when the system is being used. The particular value chosen for M will depend upon whether it is expected that the scattered signals might be coherent or it is desired to use single snapshots to obtain better range resolution, on the one hand, or whether the signals scattered by different scatterers can be assumed to be uncorrelated, in which case more scattering components may be resolved with a given receive array 28. In either case, the value chosen for M need be no greater than the expected maximum number of principal scattering components to be estimated. For example, one direct path and one multipath would constitute two principal scattering components. M need not be known α priori. The value selected for M may exceed the number of principal scattering components.
According to the model, all of the solutions that we are interested in correspond to plane waves. One can check each solution to see whether or not it corresponds to a plane wave. Whether or not a solution is a plane wave solution may be determined by testing the solution roots (i.e. the roots z of the polynomial of equation (8)) to determine whether or not they have a magnitude within a predetermined threshold, of 1. That is to ascertain (step 376) whether or not:
1-Δ.sub.1 ≦|z|≦1+Δ.sub.2(26)
Typically Δ12. It will be appreciated that roots corresponding to plane wave solutions will all lie on the unit circle. That is, roots corresponding to plane wave solutions will all have a magnitude of 1.
For each time step, the M solutions to the null-steering equation are screened using equation (19). Only those solutions which correspond to plane wave solutions are retained. All other solutions may be discarded because they do not fit the assumed model. The retained solutions yield a set of angles of arrival and amplitudes which may be plotted on a display or saved as "display information" for later display.
In some cases it may be preferable to optimize M by beginning with a relatively large value for M, counting the plane wave solutions to equation (18), and using the result as a new value for M and repeating the calculation of equation (18) with the new value for M. This procedure may be iterated until a steady state value for M is obtained. In general the simple approach set out above of selecting a value for M and then discarding non-plane wave solutions to equation (18) has been found to work quite well.
The discussion above explains the basic method of this invention. In general, additional steps should be taken to practise the method in the best way. When the methods of the invention are implemented with a pulsed transmit signal stx (t) the assumption that the elements 30 of receive array 28 all experience the same acoustic field at all times (i.e. the steady state assumption) does not hold. A pulsed waveform, by definition has a leading edge and a trailing edge.
The leading edge of a received pulse may reach some elements 30 of receive array 28 before it reaches other elements 30. In theory, it is possible for some elements of receive array 28 to have outputs of zero while other outputs have a magnitude equal to the steady state amplitude of the received pulse. This can cause significant errors in the angle of arrival estimates calculated by the methods above. Such errors could cause undesired artifacts in the image produced by the system.
One way to reduce the proportion of time during which the steady state assumption does not hold is to keep the overall length of receive array 28 small. The problem posed by the rising and falling edges of received pulses can also be ameliorated by filtering the signals received by receive array elements 30 with a filter having carefully chosen characteristics. In general it is not desirable to apply sharp band limiting digital filters to the received signals. Applying sharp band limiting filters will cause ringing. The introduction of such ringing, which is known as the Gibbs phenomenon, introduces ripples into the response of the system to pulses. This, in turn, can lead to errors in the angle of arrival estimates. In order to avoid the Gibbs phenomenon, the outputs of elements 30 should be filtered with filters which provide a smooth frequency response. For example, a Gaussian filter characteristic as described in R. E. Ziemer and W. H. Tranter Principles of Communications Houghton Mifflin Company, Boston Mass., 1976 may be used to smooth the leading and trailing edges of received pulses without introducing significant variations in steady state regions of the system response pulse.
Those skilled in the art will appreciate that filters having other smooth filter characteristics may be selected for use in smoothing the leading and trailing edges of received pulses in place of a filter having a Gaussian filter characteristic. A suitable filter may be implemented by digitally filtering the sampled signals received at receive array 28 (step 350).
In practice all of the elements of receive array 30 will not be identical. Consequently the receiver gain Gn will vary from element to element. In general Gn is a complex quantity. That is, the channels may be mismatched in both phase and amplitude. Where channel gains are mismatched but can be individually measured correction factors may be applied to the sampled values after they have been collected. In some systems the channel gain is time varying.
It may be desirable to use a time varying gain to compensate for the fact that the received signals tend to drop off in amplitude as a function of range. Where this is done it may also be necessary to apply a time varying correction factor to the sampled values in each channel.
It can be shown that the model assumed by the methods of this invention can reasonably accurately resolve small contiguous scattering regions provided that the scattering distribution within these regions does not produce interference nulls near the direction of the receiver transducer array.
There are at least two ways to use the methods of the invention. A first way is to use the methods of the invention to enhance one or more portions of an image produced by conventional beam formed imaging techniques. For example, the methods could be used to increase the resolution of images of objects in an image obtained by beam formed acoustic imaging in two dimensions with an N element linear array (e.g. an electronically scanned sector scan sonar). For example, a beamformed medical ultrasound image may reveal an area of interest (e.g. a breast calcification) for which resolution enhancement is desired and where the feature appears to satisfy the model assumptions. The selected portion of the image may then be enhanced by reprocessing the array data using the presumed spatial model. The enhanced result can then be confirmed by independently repeating the process a number of times possibly from different viewing angles. The same procedure can also be used in underwater acoustic imaging.
Spatial filtering and spatial modelling can be combined to provide image enhancement. This is preferable where the image includes dissimilar objects. In this case a number of parallel beams are formed by grouping receive transducer elements into sub-arrays. The beams will have equi-spaced phase centres. When an object of interest has been located, spatial modelling may be applied using the outputs of the parallel beams rather than the individual array element outputs for the samples of the scattered signal.
A second strategy for applying the benefits of spatial modelling to acoustic imaging is small aperture imaging. FIG. 5 is an expanded functional block diagram showing an example of a prototype apparatus 50 adapted for small aperture underwater imaging according to the invention. Conceptually, apparatus 50 is a multi-channel coherent sonar similar in architecture to existing multi-beam systems but with far fewer receive channels than a typical beamformed imaging sonar. Functionally, apparatus 50 is a multi-element sidescan sonar similar to existing interferometric sidescan systems but with more than just two sidescan array elements. The objective of the new sonar concept is to sort acoustic backscatter based on vertical angle-of-arrival θ, as a function of range R. Apparatus 50 may therefore be called Small Aperture Range versus Angle ("SARA") sonar.
Apparatus 50 has a transducer array 54 connected to a sonar transceiver 56. Transceiver 56 is operated by a controller 58. Sets of data samples received at transducer 56 are collected and transmitted through a data link 61 to a processor 59 by controller 58. At processor 59 the data samples are processed, as described above, to produce image data. This image data is displayed on an imaging device 63.
Array 54 comprises a number of elements 30. Array 54 is dimensioned such that its length is less than the spatial length of scattered acoustic pulses. This is because the pulse length of scattered pulses from all angles of arrival of interest must be long enough to encompass the entire array 54. In general, range resolution decreases as the pulse length increases. Therefore in most sonar systems it is preferable that the length of array 54 should not exceed about 10 wavelengths. If the elements of array 54 are spaced 1/2 wavelength apart then, in general, it is preferable that the number of elements in array 54 should be less than about 20. A practical apparatus which demonstrates the advantages of the invention may be made, for example with an array 54 having 6 elements.
Transceiver 56 is interfaced with a transceiver interface 60 in sonar controller 58. Transceiver 56 has a separate channel for each element 30 of transducer array 54. Preferably, for maximum versatility separate circuitry is used for each channel.
FIG. 6 is a functional diagram of circuitry for implementing one channel of transceiver 56. Transceiver 56 is configured to transmit a pulse and, for a period after the pulse has been transmitted, to receive scattered signals. Transceiver 56 has a transmitter 80. Transmitter 80 comprises an H bridge MOSFET switch which toggles two transducer terminals between ground and the potential of an external high voltage supply 82 (FIG. 4). To generate each pulse, the H-bridge is switched at the carrier frequency for a number of cycles determined by the desired pulse length. Transmitter 80 is coupled to a transducer element 30 via a transmit/receive switch 84. Switch 84 may, for example, comprise a circuit as shown in FIG. 7. On transmit, diodes 205 and 206 conduct and clip the signal transmitted by transmitter 80 to prevent overloading the input of the receiver. Diodes 201, 202, 203, and 204 have a negligible effect on the signal transmitted by transmitter 80. On receive, diodes 201, 202, 203, and 204 isolate receiver preamplifier 86 from the impedance of transmitter 80. Diodes 205 and 206 are not conducting. It is assumed that the received signals are less than the clipping voltage of diodes 201 through 206.
After a pulse has been transmitted, transmit/receive switch 84 is switched to its "receive" position. Signals received at transducer element 30 then pass through transmit/receive switch 84 to receive preamplifier 86. Receive preamplifier 86 buffers the input from transducer element 30 and is preferably a low gain, high impedance, wide bandwidth, low noise preamplifier. A relay 88 may be provided to enable the input of preamplifier 86 to be selectively connected to a test input for diagnostic purposes.
The received signal passes from preamplifier 86 to amplification and filtering stage 90. Amplification and filtration stage 90 comprises three low noise wide bandwidth variable gain amplifiers 92, 94 and 96 a buffer amplifier 98 and five separate RLC filters 102, 103, 104, 105, and 106. The maximum gain of stage 90 is about 120 dB. The gain of stage 90 can be set by placing a desired value at the head of buffer 110. Digital to Analog converter 112 reads this value and produces an output voltage which sets the gains of amplifiers 92, 94 and 96. Time variable gain (TVG) may be implemented by placing a series of values in buffer 110 and sequentially moving the values to the head of buffer 110 each time it is desired to change the gain of stage 90.
Filters 102, 103, 104, 105, and 106 are tuned to provide the desired bandwidth. For example, where the carrier frequency is 300 kilohertz, filters 102, 103, 104, 105, and 106 may be tuned to provide a 3 dB bandwidth of 60 kHz and a combined rolloff of 30 dB/octave. Buffer amplifier 98 provides a manually adjustable gain stage to compensate for filter insertion losses before the input of Analog to Digital converter ("ADC") 120.
After each pulse, ADC 120 periodically samples the output of stage 90. For each sample, ADC 120 makes two conversions spaced apart in time by 1/4 of a carrier cycle. These two conversions can be used to obtain both in phase and quadrature components of the received signal. Each sample, comprising both inphase and quadrature components, is stored in a buffer 122. Typically ADC 120 will sample the output of stage 90 between a few dozen and a few tens of thousand times for each pulse.
ADC 120 may be replaced with a pair of slower ADC's sampling synchronously 1/4 of a carrier cycle apart. This alternative construction introduces errors because the two slower ADC's will not, in general, be perfectly matched. In the alternative, ADC 120 could be operated to make two conversions for each sample separated in time by n/4ƒc where n is an odd integer. This construction introduces errors as a result of inphase/quadrature sample timing skew but may be used to practice the invention with less expensive, more readily obtainable ADC's.
Buffer 122 stores sampled data for processing by processor unit 59. Data from one or more pulses may be stored in buffer 122 and then the contents of buffer 122 may be transmitted to processor unit 59 under the control of controller 58 for processing. In the alternative, if processor unit 59 and data channel 61 are fast enough then data may be transmitted to processing unit 59 as it is received and processed in real time.
A three dimensional image may be built up by changing the orientation of transducer array 54 after one or more pulses. This may be accomplished, for example, by pivoting transducer array 54 through a small angle about an axis after each set of one or more pulses has been transmitted and the resulting scattered signals have been received. The rotation may, for example, be driven by a stepper motor controlled by controller 58. In an alternative embodiment of the invention, a 3D sector scan sonar may be implemented by using a small number of vertically stacked transducer elements to afford vertical imaging in addition to conventional horizontal scanning.
Controller 58 comprises a timer 72. Timer 72 comprises a number of counter/timers which coordinate the operation of transceiver 56. For example, timer 72 generates triggers which cause transceiver 56 to: begin and end transmitting pulses; sample received pulses; and, update the time variable gain value which sets the gain of amplifiers 92, 94 and 96. The operation of timer 72 is conventional and is known to those skilled in the art.
Controller 58 also comprises a processor 66. Processor 66 has three primary functions. Firstly, processor 66 controls the uploading of sampled data to processing unit 59. Secondly, processor 66 receives and implements commands sent by processing unit 59. For example, processing unit 69 might send a command requiring that the length of transmitted pulses be increased. Processor 66 would receive the command and write appropriate values to registers in timer unit 72 to implement the command. Thirdly, processor 66 controls the orientation of transducer array 54 through a suitable interface connected to stepper motor 74.
Controller 58 may be equipped with suitable user interfaces such as a keyboard connector 73, display driver 70 and display connector 71 to allow trouble shooting of controller 58.
Data channel 61 is a suitable data link capable of carrying commands and configuration information from processing unit 59 to controller 58 and data from controller 58 to processing unit 59. Data channel 61 may, for example, comprise an Ethernet connection incorporating suitable hardware and software interfaces at controller 58 and processing unit 59.
Processing unit 59 preferably comprises a programmed general purpose computer. Display device 63 comprises, for example, a monitor or a plotter connected to processing unit 59. FIGS. 3B and 3C illustrate the operation of computer software running in processing unit 59 for implementing the methods of the invention. In one embodiment the software may be written in the C programming language. Of course, other programming languages such as MATLAB could be used to create suitable processing software.
It can be appreciated that the approach of this invention is not limited by the physical size of the receive transducer array but instead by model uncertainties. Therefore high resolution images may be obtained using a small aperture.
Many alterations and modifications are possible in the practice of this invention without departing from the spirit or scope thereof. For example, the invention has been described herein using as an example, acoustic imaging of the sea floor. The invention could also be applied to other imaging situations wherein image data is obtained transmitting a pulse of acoustic or electromagnetic radiation and then detecting a scattered signal. For example, the invention could be applied to medical or commercial ultrasound imaging or radar imaging.
While a specific embodiment of apparatus for practising the invention has been described above, those skilled in the art will understand that the invention may be practised with different apparatus. For example, the foregoing description describes apparatus 50 in which processing steps are performed in a programmed general purpose computer. In some cases it might be desirable to create hardware for implementing these processing steps. In apparatus 50 data collection and data processing are performed in physically separate devices connected by data link 61. It would be possible to perform the data collection and data processing step in a single device. For example, if processor 66 in controller 58 is sufficiently powerful then processor 66 could be used to implement the processing steps described above as being carried out in processor unit 59.
The invention may be provided to users in various ways. For example, the invention may be provided in the form of apparatus adapted for practising the methods of the invention. The invention may also be provided in the form of a computer readable medium containing computer software which, when run on a computer system will cause that computer system to implement the processing steps of the invention.
Accordingly, the scope of the invention is to be construed in accordance with the substance defined by the following claims.

Claims (41)

We claim:
1. A method for imaging a region, the method comprising the steps of:
(a) transmitting a pulse toward the region;
(b) at a receiver transducer array comprising a plurality of N elements detecting a signal scattered from the region to yield a multi-channel scattering signal;
(c) obtaining L snapshots, where L is an integer with L≧1, by sampling the scattering signal at one or more instants after transmitting the pulse to yield a plurality of complex samples;
(d) in a processing device, processing the plurality of complex samples to obtain image data comprising angles of arrival from M principal scattering components, where M is an integer, with 1≦M≦N-1, by the steps of:
(i) constructing a sample matrix SL,M,N from the complex samples;
(ii) from the sample matrix computing a null-space vector w comprising a plurality of entries;
(iii) computing a plurality of roots of a polynomial formed from the entries of the null-space vector;
(iv) from the roots of the polynomial computing angles of arrival for M principal scattering components; and,
(v) storing the angles of arrival as image data.
2. The method of claim 1 wherein the step of computing the null space vector comprises numerically finding a vector w in a search space according to a best fit criterion.
3. The method of claim 2 wherein the best fit criterion is selected from the group consisting of: maximum likelihood, sub-space decomposition fitting or least squares fitting.
4. The method of claim 3 comprising computing the null space vector by a least squares estimator by finding a vector w in a search space which minimizes the quantity e given by:
ε=|S.sub.L,M,N w|.sup.2.
5. The method of claim 4 wherein computing the null space vector while minimizing c comprises:
(1) forming a sub-matrix by taking all but the first column of the sample matrix;
(2) computing a Moore-Penrose pseudo-inverse matrix of the sub-matrix using singular value decomposition; and,
(3) multiplying the pseudo-inverse matrix by the first column of the sample matrix.
6. The method of claim 4 wherein the procedure for obtaining w while minimizing e comprises the steps of:
(a) forming an estimate of an array covariance matrix RL,M,N by performing the operation:
R.sub.L,M,N =S.sub.L,M,N.sup.H S.sub.L,M,N
(b) performing an eigen decomposition on RL,M,N and selecting an eigen vector associated with a smallest eigen value of RL,M,N.
7. The method of claim 3 comprising computing the null space vector from the sample matrix using a sub-space decomposition method comprising the steps of:
a. obtaining an estimate of a covariance matrix from the sample matrix;
b. performing an eigen decomposition on the estimated covariance matrix to yield eigen values and eigen vectors; and,
c. forming the null space vector w from a combination of the eigen vectors.
8. The method of claim 3 wherein processing the complex samples comprises computing amplitudes for scatterers corresponding to the selected roots from the sample matrix and the angles of arrival and storing the amplitudes with the image data.
9. The method of claim 2 wherein the step of processing the plurality of complex samples comprises:
(a) selecting those roots of the polynomial which have a magnitude in the range of 1-Δ1 to 1+Δ2, where Δ1 and Δ2 are predetermined threshold values; and
(b) storing as image data only the angles of arrival corresponding to the selected roots.
10. The method of claim 9 wherein Δ12.
11. The method of claim 9 wherein processing the complex samples comprises computing amplitudes for the M scatterers from the sample matrix and the angles of arrival and storing the amplitudes with the image data.
12. The method of claim 11 comprising comparing the amplitudes to a threshold and storing a binary value indicating whether the amplitudes are greater than or less than the threshold with the image data.
13. The method of claim 1 wherein the step of processing the plurality of complex samples comprises:
(a) selecting those roots of the polynomial which have a magnitude in the range of 1-Δ1 to 1+Δ2, where Δ1 and Δ2 are predetermined threshold values; and
(b) storing as image data only the angles of arrival corresponding to the selected roots.
14. The method of claim 13 wherein Δ12.
15. The method of claim 13 wherein processing the complex samples comprises computing amplitudes for scatterers corresponding to the selected roots from the sample matrix and the angles of arrival and storing the amplitudes with the image data.
16. The method of claim 13 comprising displaying the image data on a display device and subsequently accepting user specified values for Δ1, Δ2, or both Δ1 and Δ2, generating new image data corresponding to the user specified values and displaying the new image data on the display device.
17. The method of claim 1 wherein processing the complex samples comprises computing amplitudes for the M scatterers from the sample matrix and the angles of arrival and storing the amplitudes with the image data.
18. The method of claim 17 comprising comparing the amplitudes to a threshold and storing a binary value indicating whether the amplitudes are greater than or less than the threshold with the image data.
19. The method of claim 1 comprising displaying the image data on a display device.
20. The method of claim 1 wherein the sample matrix comprises a first plurality of complex samples, all of the first plurality of complex samples detected at a first time.
21. The method of claim 20 wherein the sample matrix consists of the first plurality of complex samples and is of the form: ##EQU15## where sn (l) is a complex sample taken at the nth element of the transducer array, l is an index representing the first time, and n is an integer in the range 1≦n≦N.
22. The method of claim 20 wherein the sample matrix comprises a second plurality of complex samples detected by the transducer array at a second time different from the first time.
23. The method of claim 22 wherein the sample matrix is of the form: ##EQU16## where sn (l) is a complex sample taken at the nth element of the transducer array, l is an index representing the time at which the sample is taken, and n is an integer in the range 1≦n≦N.
24. The method of claim 1 wherein the polynomial has N-1 roots where N is the number of elements in the transducer array.
25. The method of claim 1 comprising the step of reorienting the transducer array after step (c) and then repeating steps (a) (b) and (c) to produce another set of complex samples.
26. The method of claim 1 wherein the step of transmitting the pulse comprises coding the pulse so as to increase a time bandwidth product of the transmitted pulse and the method includes decoding the received scattered signals so as to increase a signal-to-noise ratio of the multi-channel scattering signal.
27. The method of claim 1 wherein the step of processing the plurality of complex samples includes the steps of:
(a) forming Q beams with offset phase centers by taking linear combinations of the complex samples, where Q is an integer and Q≦N, and,
(b) forming the sample matrix from outputs of the beams. ##EQU17##
28. The method of claim 27 wherein the sample matrix has the form: where sq (1) is the complex output from the gth beam at an 1th time interval, with 1 an integer in the range 1≦1≦L, L is an integer such that L≧1, q is an integer in the range 1≦q≦Q, and M is an integer with 1≦M≦Q-1.
29. The method of claim 1 comprising repeating the steps (b) through (d) to produce image data corresponding to groups of principal scatterers at different distances from the receive transducer array.
30. The method of claim 1 wherein N≧3.
31. An imaging system comprising:
(a) a transmit transducer;
(b) a pulse generator connected to the transmit transducer;
(c) a receive transducer array;
(d) a receiver connected to the receive transducer array, the receiver comprising:
(i) a multi-channel amplifier for amplifying scattered signals detected by each element of the receive transducer array; and,
(ii) an analog to digital conversion circuit connected to the multi-channel amplifier to sample the amplified scattered signals to produce a series of complex samples;
(e) a processor connected to receive the series of complex samples from the analog to digital conversion circuit, the processor performing the following operations for each of a plurality of ranges:
(i) select a group of complex samples corresponding to a range;
(ii) construct a sample matrix SL,M,N from the group of complex samples;
(iii) compute from the sample matrix a null space vector w comprising a plurality of entries;
(iv) compute the roots of a polynomial formed from the entries of the null-space vector;
(v) compute angles of arrival for one or more scatterers from the roots of the polynomial;
(vi) compute amplitudes for the one or more scatterers from the sample matrix and the angles of arrival; and,
(vii) store the range, angles of arrival and amplitudes as image data; and,
(f) a display device driver connected to receive the image data and to display the image data on a display device.
32. A processing unit for processing scattering signal data received at a multi-channel transducer to yield image data, the processing unit comprising:
(i) an input for receiving scattering signal data, the scattering signal data representing signals scattered by one or more objects and comprising a plurality of sets of complex samples, the sets detected sequentially at a transducer array, each set comprising a complex sample obtained from each of a plurality of elements in the array,
(ii) means for selecting a group of complex samples corresponding to a distance range;
(iii) means for constructing a sample matrix SK,M,N from the group of complex samples;
(iv) means for computing a null-space vector w comprising a plurality of entries from the sample matrix;
(v) means for computing roots of a polynomial formed from the entries of the null-space vector;
(vi) means for computing angles of arrival for two or more scatterers from the roots of the polynomial;
(vii) means for computing amplitudes for the two or more scatterers from the sample matrix and the angles of arrival;
(viii) means for storing the range, angles of arrival and amplitudes as image data and,
ix output means for delivering an image signal representing the image data, the image signal, when displayed on a display, graphically depicting the objects.
33. A computer readable medium containing computer software, the computer software, when run on a computer providing a processing means for:
(a) constructing a sample matrix SK,M,N from the complex samples;
(b) obtaining from the sample matrix a null-space vector w;
(c) computing the roots of a polynomial formed from the entries of the null-space vector;
(d) computing angles of arrival for two or more scatterers from the roots of the polynomial;
(e) computing amplitudes for the two or more scatterers from the sample matrix and the angles of arrival; and,
(f) storing the angles of arrival and amplitudes as image data.
34. A method for imaging a region, the method comprising the steps of:
(a) transmitting a pulse toward the region;
(b) at a receiver transducer array comprising a plurality of N elements, with N≧2 detecting a signal scattered from the region to yield a multi-channel scattering signal;
(c) obtaining L snapshots, where L is an integer with L≧1, by sampling the scattering signal at one or more instants after transmitting the pulse to yield a plurality of complex samples; and,
(d) in a computer, processing the plurality of complex samples to obtain image data comprising angles of arrival from M principal scattering components, where M is an integer, with 2≦M≦N-1.
35. The method of claim 34 wherein N≧2.
36. The method of claim 34 wherein N≧3.
37. The method of claim 34 wherein processing the plurality of complex samples comprises:
(i) constructing a sample matrix SL,M,N from the complex samples;
(ii) from the sample matrix generating a null-space vector w comprising a plurality of entries;
(iii) computing values for a plurality of roots of a polynomial formed from the entries of the null-space vector;
(iv) from the roots of the polynomial computing angles of arrival for M principal scattering components; and,
(v) storing the angles of arrival as image data.
38. The method of claim 36 wherein generating the null-space vector w comprises numerically finding a vector w in a search space according to a best fit criterion.
39. The method of claim 34 wherein processing the complex samples comprises computing an amplitude associated with each of the M principal scattering components and storing the amplitudes with the image data.
40. The method of claim 34 wherein transmitting the pulse comprises coding the pulse so as to increase a time bandwidth product of the transmitted pulse and the method comprises decoding the received scattered signals so as to increase a signal-to-noise ratio of the multi-channel scattering signal.
41. The method of claim 34 comprising changing the orientation of the receiver transducer array after obtaining the L snapshots and then repeating steps (a), (b) and (c) to obtain another plurality of complex samples.
US09/148,131 1998-09-04 1998-09-04 Imaging methods and apparatus using model-based array signal processing Expired - Lifetime US6130641A (en)

Priority Applications (1)

Application Number Priority Date Filing Date Title
US09/148,131 US6130641A (en) 1998-09-04 1998-09-04 Imaging methods and apparatus using model-based array signal processing

Applications Claiming Priority (1)

Application Number Priority Date Filing Date Title
US09/148,131 US6130641A (en) 1998-09-04 1998-09-04 Imaging methods and apparatus using model-based array signal processing

Publications (1)

Publication Number Publication Date
US6130641A true US6130641A (en) 2000-10-10

Family

ID=22524428

Family Applications (1)

Application Number Title Priority Date Filing Date
US09/148,131 Expired - Lifetime US6130641A (en) 1998-09-04 1998-09-04 Imaging methods and apparatus using model-based array signal processing

Country Status (1)

Country Link
US (1) US6130641A (en)

Cited By (73)

* Cited by examiner, † Cited by third party
Publication number Priority date Publication date Assignee Title
US6201887B1 (en) * 1998-11-17 2001-03-13 General Electric Company System for determination of faulty circuit boards in ultrasound imaging machines
US6255980B1 (en) * 1999-11-12 2001-07-03 The United States Of America As Represented By The Secretary Of The Navy Radar-acoustic hybrid detection system for rapid detection and classification of submerged stationary articles
US20020065664A1 (en) * 2000-10-13 2002-05-30 Witzgall Hanna Elizabeth System and method for linear prediction
US6417797B1 (en) * 1998-07-14 2002-07-09 Cirrus Logic, Inc. System for A multi-purpose portable imaging device and methods for using same
US6600441B2 (en) * 2000-10-13 2003-07-29 Hilti Aktiengesellschaft Subsurface exploratory radar detector for a hand tool device
US6622118B1 (en) * 2001-03-13 2003-09-16 Alphatech, Inc. System and method for comparing signals
US20030182062A1 (en) * 2002-03-25 2003-09-25 Bishwajit Chakraborty System for classifying seafloor roughness
US6646593B1 (en) * 2002-01-08 2003-11-11 Science Applications International Corporation Process for mapping multiple-bounce ghosting artifacts from radar imaging data
US6687188B2 (en) * 2002-05-14 2004-02-03 The United States Of America As Represented By The Secretary Of The Navy Underwater telemetry apparatus and method
US6700381B2 (en) 2002-04-08 2004-03-02 Witten Technologies Inc. Method and apparatus for locating objects using parametric inversion
US6700526B2 (en) 2000-09-08 2004-03-02 Witten Technologies Inc. Method and apparatus for identifying buried objects using ground penetrating radar
US6732030B2 (en) 2001-08-18 2004-05-04 Snap-On U.K. Holdings Limited Three-dimensional mapping systems for automotive vehicles and other articles
US20040151266A1 (en) * 2002-10-25 2004-08-05 Seema Sud Adaptive filtering in the presence of multipath
US20050057744A1 (en) * 2003-09-12 2005-03-17 Pohle Richard Henry Three-dimensional imaging with multiframe blind deconvolution
US20050062639A1 (en) * 2001-09-15 2005-03-24 The Secretary Of State For Defence Sub-surface radar imaging
US6888490B1 (en) * 2004-07-20 2005-05-03 Raytheon Company Spatial multibeam ambiguity resolving technique (SMART)
US20050124880A1 (en) * 2002-03-12 2005-06-09 Ryuichi Shinomura Ultrasonograph
US6949930B2 (en) 2002-04-08 2005-09-27 Witten Technologies, Inc. Time domain induction method and apparatus for locating buried objects in a medium by inducing and measuring transient eddy currents
US20050285772A1 (en) * 2004-06-11 2005-12-29 Basir Otman A Microwave method and system for material inspection
US20060013069A1 (en) * 2004-07-15 2006-01-19 Imagenex Technology Corp. High resolution images from reflected wave energy
US20060098533A1 (en) * 2003-03-25 2006-05-11 Robert Hickling Method and apparatus for echolocation
US20060214835A1 (en) * 2005-03-24 2006-09-28 Lee Gregory S System and method for inspecting transportable items using microwave imaging
US20070091723A1 (en) * 2005-07-22 2007-04-26 Institute Of Acoustics, Chinese Academy Of Sciences Method of signal processing for high resolution bathymetric sidescan sonar
WO2007050289A1 (en) * 2005-10-21 2007-05-03 Raytheon Company Sonar system and method providing low probability of impact on marine mammals
WO2007084121A1 (en) * 2006-01-17 2007-07-26 Robert Hickling Sound source location and quantification using arrays of vector probes
US20070181162A1 (en) * 2004-07-23 2007-08-09 Bsh Bosch Und Siemens Hausgerate Gmbh Method for detecting the load of items to be washed, and dishwasher machine
US7259715B1 (en) 2002-01-08 2007-08-21 Science Applications International Corporation Method for developing and using an image reconstruction algorithm for multipath scattering
US7315485B1 (en) * 2005-12-20 2008-01-01 United States Of America As Represented By The Secretary Of The Navy System and method for target classification and clutter rejection in low-resolution imagery
US20080204311A1 (en) * 2007-02-23 2008-08-28 Takashi Fujimura Synthetic aperture radar and processing method of reproducing synthetic aperture radar image
WO2008105932A2 (en) * 2006-09-15 2008-09-04 Teledyne Rd Instruments, Inc. System and method for forward looking sonar
US20090102701A1 (en) * 2007-10-19 2009-04-23 Technology Service Corporation Systems and methods for space-time radar imaging
US20100128566A1 (en) * 2008-11-24 2010-05-27 Qin Jiang System and method for enhancing weak target signals for a sensor array
US20100171651A1 (en) * 2007-03-29 2010-07-08 DEUTSCHES ZENTRUM FüR LUFT-UND RAUMFAHRT E.V. Method for Examining an Ice Region or Dry Region Using Radar Echo Sounding
US20100265117A1 (en) * 2007-10-24 2010-10-21 Elta Systems Ltd. System and method for imaging objects
CN101051083B (en) * 2006-04-07 2010-11-03 中国科学院声学研究所 Secondary wave arrival direction estimation sonar signal processing method
US20110012777A1 (en) * 2009-07-14 2011-01-20 Raytheon Company Interferometric Synthetic Aperture Radar for Imaging of Buildings
CN102047142A (en) * 2008-05-30 2011-05-04 阿尔卡特朗讯美国公司 Wideband RF detection
US20110128819A1 (en) * 2009-12-01 2011-06-02 Raytheon Company Active sonar system and active sonar method using fuzzy logic
US20110228639A1 (en) * 2009-05-13 2011-09-22 Qin Jiang Active Sonar System and Active Sonar Method Using Noise Reduction Techniques and Advanced Signal Processing Techniques
US8082286B1 (en) 2002-04-22 2011-12-20 Science Applications International Corporation Method and system for soft-weighting a reiterative adaptive signal processor
US8109878B1 (en) * 2010-09-14 2012-02-07 Quantason, LLC Use of coded excitation schemes in the detection and location of a target in a human body such as breast calcifications
US8164983B2 (en) 2009-03-06 2012-04-24 Johnson David A Fish finder
US8372006B1 (en) * 2010-06-16 2013-02-12 Quantason, LLC Method for detecting and locating a target using phase information
US20130082859A1 (en) * 2010-08-26 2013-04-04 David W. Paglieroni Spatially adaptive migration tomography for multistatic gpr imaging
US8514658B2 (en) 2009-07-14 2013-08-20 Navico Holding As Downscan imaging sonar for reduced interference
US20140049418A1 (en) * 2012-08-17 2014-02-20 Geophysical Survey Systems, Inc. Realization of Time-Domain Ultra Wideband Ground-Penetrating Radar Using High Speed Accumulation and Interpolated Sampling
US8666118B2 (en) 2009-05-20 2014-03-04 Imagenex Technology Corp. Controlling an image element in a reflected energy measurement system
DE102004035715B4 (en) * 2003-07-25 2014-09-25 Kabushiki Kaisha Toshiba Sound propagation time measurement device
US20150123835A1 (en) * 2012-05-17 2015-05-07 Deep Imaging Technologies Inc. System and Method Using Near and Far Field ULF and ELF Interferometry Synthetic Aperture Radar for Subsurface Imaging
CN104793206A (en) * 2015-04-28 2015-07-22 西北工业大学 Imaging method through transmitting grating lobes
US9091790B2 (en) 2008-08-11 2015-07-28 Airmar Technology Corporation Multi-function broadband phased-array software defined sonar system and method
US9104697B2 (en) * 2012-07-24 2015-08-11 Navico Holdings As Aquatic geographic information system
US9142206B2 (en) 2011-07-14 2015-09-22 Navico Holding As System for interchangeable mounting options for a sonar transducer
US9182486B2 (en) 2011-12-07 2015-11-10 Navico Holding As Sonar rendering systems and associated methods
US9223022B2 (en) 2009-07-14 2015-12-29 Navico Holding As Linear and circular downscan imaging sonar
US9244168B2 (en) 2012-07-06 2016-01-26 Navico Holding As Sonar system using frequency bursts
US9268020B2 (en) 2012-02-10 2016-02-23 Navico Holding As Sonar assembly for reduced interference
JP2017508162A (en) * 2014-03-14 2017-03-23 タレス Synthetic antenna sonar and method for forming a synthetic antenna beam
US9886938B2 (en) 2015-02-10 2018-02-06 Navico Holding As Transducer array having a transceiver
US9986197B2 (en) 2016-08-24 2018-05-29 Navico Holding As Trip replay experience
US10024957B2 (en) 2015-09-17 2018-07-17 Navico Holding As Adaptive beamformer for sonar imaging
US10114119B2 (en) 2015-05-20 2018-10-30 Navico Holding As Sonar systems and methods using interferometry and/or beamforming for 3D imaging
CN108956761A (en) * 2017-05-23 2018-12-07 浙江工商职业技术学院 Steel plate all standing ultrasonic detection device and method
US10151829B2 (en) 2016-02-23 2018-12-11 Navico Holding As Systems and associated methods for producing sonar image overlay
US10324173B2 (en) 2015-02-13 2019-06-18 Airmar Technology Corporation Acoustic transducer element
US10365366B2 (en) 2016-06-21 2019-07-30 Navico Holding As Adjustable range viewing of sonar imagery during trip replay
US20200400801A1 (en) * 2015-10-30 2020-12-24 Coda Octopus Group, Inc. Method of stabilizing sonar images
CN112416276A (en) * 2020-10-13 2021-02-26 北京匠数科技有限公司 Display picture analysis device, system and method
US11143758B2 (en) 2017-10-13 2021-10-12 Navico Holding As Sonar transducer performance optimization
US11249176B2 (en) * 2018-11-30 2022-02-15 Navico Holding As Systems and associated methods for monitoring vessel noise level
US11367425B2 (en) 2017-09-21 2022-06-21 Navico Holding As Sonar transducer with multiple mounting options
US11520042B1 (en) 2022-02-11 2022-12-06 Mythos AI Inc Apparatus and methods for artificial intelligence bathymetry
US11550052B2 (en) 2018-10-17 2023-01-10 United States Of America, As Represented By The Secretary Of The Army Interferometric synthetic aperture acoustic imager

Citations (9)

* Cited by examiner, † Cited by third party
Publication number Priority date Publication date Assignee Title
US4829303A (en) * 1988-05-18 1989-05-09 The United States Of America As Represented By The Administrator Of The National Aeronautics And Space Administration Data volume reduction for imaging radar polarimetry
US4862180A (en) * 1985-06-12 1989-08-29 Westinghouse Electric Corp. Discrete source location by adaptive antenna techniques
US4973111A (en) * 1988-09-14 1990-11-27 Case Western Reserve University Parametric image reconstruction using a high-resolution, high signal-to-noise technique
US5077699A (en) * 1990-12-07 1991-12-31 The United States Of America As Represented By The Secretary Of The Navy Digital bottom mapping
US5200931A (en) * 1991-06-18 1993-04-06 Alliant Techsystems Inc. Volumetric and terrain imaging sonar
US5307070A (en) * 1990-08-25 1994-04-26 Deutsche Forschungsanstalt Fur Luft-Und Raumfahrt Method for resolving ambiguity in the determination of antenna angle of view and Doppler frequency in synthetic aperture radar
US5440309A (en) * 1993-04-08 1995-08-08 Deutsche Forschungsanstalt Fur Luft- Und Raumfahrt E.V. Method of extracting motion errors of a carrier bearing a coherent imaging radar system from radar raw data and apparatus for carrying out the method
US5610610A (en) * 1988-05-18 1997-03-11 Hughes Electronics Inverse synthetic array radar system and method
US5748507A (en) * 1996-08-06 1998-05-05 Lockheed Martin Corporation Real-time superresolution signal processing

Patent Citations (9)

* Cited by examiner, † Cited by third party
Publication number Priority date Publication date Assignee Title
US4862180A (en) * 1985-06-12 1989-08-29 Westinghouse Electric Corp. Discrete source location by adaptive antenna techniques
US4829303A (en) * 1988-05-18 1989-05-09 The United States Of America As Represented By The Administrator Of The National Aeronautics And Space Administration Data volume reduction for imaging radar polarimetry
US5610610A (en) * 1988-05-18 1997-03-11 Hughes Electronics Inverse synthetic array radar system and method
US4973111A (en) * 1988-09-14 1990-11-27 Case Western Reserve University Parametric image reconstruction using a high-resolution, high signal-to-noise technique
US5307070A (en) * 1990-08-25 1994-04-26 Deutsche Forschungsanstalt Fur Luft-Und Raumfahrt Method for resolving ambiguity in the determination of antenna angle of view and Doppler frequency in synthetic aperture radar
US5077699A (en) * 1990-12-07 1991-12-31 The United States Of America As Represented By The Secretary Of The Navy Digital bottom mapping
US5200931A (en) * 1991-06-18 1993-04-06 Alliant Techsystems Inc. Volumetric and terrain imaging sonar
US5440309A (en) * 1993-04-08 1995-08-08 Deutsche Forschungsanstalt Fur Luft- Und Raumfahrt E.V. Method of extracting motion errors of a carrier bearing a coherent imaging radar system from radar raw data and apparatus for carrying out the method
US5748507A (en) * 1996-08-06 1998-05-05 Lockheed Martin Corporation Real-time superresolution signal processing

Non-Patent Citations (1)

* Cited by examiner, † Cited by third party
Title
English Abstract for Japan Patent Application JP09171069A. Jun. 1997. *

Cited By (137)

* Cited by examiner, † Cited by third party
Publication number Priority date Publication date Assignee Title
US6417797B1 (en) * 1998-07-14 2002-07-09 Cirrus Logic, Inc. System for A multi-purpose portable imaging device and methods for using same
US6201887B1 (en) * 1998-11-17 2001-03-13 General Electric Company System for determination of faulty circuit boards in ultrasound imaging machines
US6255980B1 (en) * 1999-11-12 2001-07-03 The United States Of America As Represented By The Secretary Of The Navy Radar-acoustic hybrid detection system for rapid detection and classification of submerged stationary articles
US6700526B2 (en) 2000-09-08 2004-03-02 Witten Technologies Inc. Method and apparatus for identifying buried objects using ground penetrating radar
US20040155810A1 (en) * 2000-09-08 2004-08-12 Witten Technologies, Inc. Method and apparatus for identifying buried objects using ground penetrating radar
US7034740B2 (en) 2000-09-08 2006-04-25 Witten Technologies, Inc. Method and apparatus for identifying buried objects using ground penetrating radar
US6600441B2 (en) * 2000-10-13 2003-07-29 Hilti Aktiengesellschaft Subsurface exploratory radar detector for a hand tool device
US20020065664A1 (en) * 2000-10-13 2002-05-30 Witzgall Hanna Elizabeth System and method for linear prediction
US7426463B2 (en) 2000-10-13 2008-09-16 Science Applications International Corporation System and method for linear prediction
US20060265214A1 (en) * 2000-10-13 2006-11-23 Science Applications International Corp. System and method for linear prediction
US7103537B2 (en) * 2000-10-13 2006-09-05 Science Applications International Corporation System and method for linear prediction
US6622118B1 (en) * 2001-03-13 2003-09-16 Alphatech, Inc. System and method for comparing signals
US6732030B2 (en) 2001-08-18 2004-05-04 Snap-On U.K. Holdings Limited Three-dimensional mapping systems for automotive vehicles and other articles
US7190302B2 (en) * 2001-09-15 2007-03-13 The Secretary Of State For Defence In Her Britannic Majesty's Government Of The United Kingdom Of Great Britain And Northern Ireland Sub-surface radar imaging
US20050062639A1 (en) * 2001-09-15 2005-03-24 The Secretary Of State For Defence Sub-surface radar imaging
US7173562B2 (en) 2002-01-08 2007-02-06 Science Applications International Corporation Process for mapping multiple-bounce ghosting artifacts from radar imaging data
US7385553B1 (en) 2002-01-08 2008-06-10 Science Applications International Corporation Process for mapping multiple-bounce ghosting artifacts from radar imaging data
US6812886B2 (en) 2002-01-08 2004-11-02 Science Applications International Corporation Process for mapping multiple-bounce ghosting artifacts from radar imaging data
US20060284762A1 (en) * 2002-01-08 2006-12-21 Garren David A Process for mapping multiple-bounce ghosting artifacts from radar imaging data
US20040021598A1 (en) * 2002-01-08 2004-02-05 Garren David Alan Process for mapping multiple-bounce ghosting artifacts from radar imaging data
US7515098B1 (en) 2002-01-08 2009-04-07 Science Applications International Corporation Method for developing and using an image reconstruction algorithm for multipath scattering
US6646593B1 (en) * 2002-01-08 2003-11-11 Science Applications International Corporation Process for mapping multiple-bounce ghosting artifacts from radar imaging data
US7259715B1 (en) 2002-01-08 2007-08-21 Science Applications International Corporation Method for developing and using an image reconstruction algorithm for multipath scattering
US20050124880A1 (en) * 2002-03-12 2005-06-09 Ryuichi Shinomura Ultrasonograph
US7474778B2 (en) * 2002-03-12 2009-01-06 Hitachi Medical Corporation Ultrasonograph
US6763303B2 (en) * 2002-03-25 2004-07-13 Council Of Scientific And Industrial Research System for classifying seafloor roughness
US20030182062A1 (en) * 2002-03-25 2003-09-25 Bishwajit Chakraborty System for classifying seafloor roughness
US6949930B2 (en) 2002-04-08 2005-09-27 Witten Technologies, Inc. Time domain induction method and apparatus for locating buried objects in a medium by inducing and measuring transient eddy currents
US6700381B2 (en) 2002-04-08 2004-03-02 Witten Technologies Inc. Method and apparatus for locating objects using parametric inversion
US8082286B1 (en) 2002-04-22 2011-12-20 Science Applications International Corporation Method and system for soft-weighting a reiterative adaptive signal processor
US6687188B2 (en) * 2002-05-14 2004-02-03 The United States Of America As Represented By The Secretary Of The Navy Underwater telemetry apparatus and method
US7415065B2 (en) 2002-10-25 2008-08-19 Science Applications International Corporation Adaptive filtering in the presence of multipath
US20040151266A1 (en) * 2002-10-25 2004-08-05 Seema Sud Adaptive filtering in the presence of multipath
US20060098533A1 (en) * 2003-03-25 2006-05-11 Robert Hickling Method and apparatus for echolocation
US7054226B1 (en) * 2003-03-25 2006-05-30 Robert Hickling Method and apparatus for echolocation
DE102004035715B4 (en) * 2003-07-25 2014-09-25 Kabushiki Kaisha Toshiba Sound propagation time measurement device
US7139067B2 (en) * 2003-09-12 2006-11-21 Textron Systems Corporation Three-dimensional imaging with multiframe blind deconvolution
US20050057744A1 (en) * 2003-09-12 2005-03-17 Pohle Richard Henry Three-dimensional imaging with multiframe blind deconvolution
US20050285772A1 (en) * 2004-06-11 2005-12-29 Basir Otman A Microwave method and system for material inspection
US7230564B2 (en) * 2004-06-11 2007-06-12 1M International Corporation Microwave method and system for material inspection
US20060013069A1 (en) * 2004-07-15 2006-01-19 Imagenex Technology Corp. High resolution images from reflected wave energy
US7450470B2 (en) 2004-07-15 2008-11-11 Imagenex Technology Corp. High resolution images from reflected wave energy
US7212466B2 (en) * 2004-07-15 2007-05-01 Imagenex Technology Corp. Producing amplitude values for controlling pixel illumination on a sonar display
US20060013068A1 (en) * 2004-07-15 2006-01-19 Imagenex Technology Corp. Producing amplitude values for controlling pixel illumination on a sonar display
US6888490B1 (en) * 2004-07-20 2005-05-03 Raytheon Company Spatial multibeam ambiguity resolving technique (SMART)
US20070181162A1 (en) * 2004-07-23 2007-08-09 Bsh Bosch Und Siemens Hausgerate Gmbh Method for detecting the load of items to be washed, and dishwasher machine
US7842137B2 (en) * 2004-07-23 2010-11-30 Bsh Bosch Und Siemens Hausgeraete Gmbh Method for detecting the load of items to be washed, and dishwasher machine
US7183963B2 (en) * 2005-03-24 2007-02-27 Agilent Technologies, Inc. System and method for inspecting transportable items using microwave imaging
US20060214835A1 (en) * 2005-03-24 2006-09-28 Lee Gregory S System and method for inspecting transportable items using microwave imaging
US7315487B2 (en) * 2005-07-22 2008-01-01 Institute Of Acoustics, Chinese Academy Of Sciences Method of signal processing for high resolution bathymetric sidescan sonar
US20070091723A1 (en) * 2005-07-22 2007-04-26 Institute Of Acoustics, Chinese Academy Of Sciences Method of signal processing for high resolution bathymetric sidescan sonar
TWI398662B (en) * 2005-10-21 2013-06-11 Raytheon Co Sonar system and method providing low probability of impact on marine mammals
WO2007050289A1 (en) * 2005-10-21 2007-05-03 Raytheon Company Sonar system and method providing low probability of impact on marine mammals
US7486591B2 (en) 2005-10-21 2009-02-03 Raytheon Company Sonar system and method providing low probability of impact on marine mammals
US20080043574A1 (en) * 2005-10-21 2008-02-21 Rooney James H Iii Sonar system and method providing low probability of impact on marine mammals
AU2006306650B2 (en) * 2005-10-21 2010-06-17 Raytheon Company Sonar system and method providing low probability of impact on marine mammals
US7315485B1 (en) * 2005-12-20 2008-01-01 United States Of America As Represented By The Secretary Of The Navy System and method for target classification and clutter rejection in low-resolution imagery
WO2007084121A1 (en) * 2006-01-17 2007-07-26 Robert Hickling Sound source location and quantification using arrays of vector probes
CN101051083B (en) * 2006-04-07 2010-11-03 中国科学院声学研究所 Secondary wave arrival direction estimation sonar signal processing method
WO2008105932A3 (en) * 2006-09-15 2008-10-30 Teledyne Rd Instr Inc System and method for forward looking sonar
WO2008105932A2 (en) * 2006-09-15 2008-09-04 Teledyne Rd Instruments, Inc. System and method for forward looking sonar
US7705767B2 (en) * 2007-02-23 2010-04-27 Nec Corporation Synthetic aperture radar and processing method of reproducing synthetic aperture radar image
US20080204311A1 (en) * 2007-02-23 2008-08-28 Takashi Fujimura Synthetic aperture radar and processing method of reproducing synthetic aperture radar image
US20100171651A1 (en) * 2007-03-29 2010-07-08 DEUTSCHES ZENTRUM FüR LUFT-UND RAUMFAHRT E.V. Method for Examining an Ice Region or Dry Region Using Radar Echo Sounding
US8159384B2 (en) * 2007-03-29 2012-04-17 Deutsches Zentrum Fur Luft-Und Raumfahrt E.V. Method for examining an ice region or dry region using radar echo sounding
US7724183B2 (en) 2007-10-19 2010-05-25 Technology Service Corporation Systems and methods for space-time radar imaging
US20100265124A1 (en) * 2007-10-19 2010-10-21 Technology Service Corporation Systems And Methods for Space-Time Radar Imaging
US20090102701A1 (en) * 2007-10-19 2009-04-23 Technology Service Corporation Systems and methods for space-time radar imaging
US7994967B2 (en) 2007-10-19 2011-08-09 Technology Service Corporation Systems and methods for space-time radar imaging
US20100265117A1 (en) * 2007-10-24 2010-10-21 Elta Systems Ltd. System and method for imaging objects
US8319678B2 (en) * 2007-10-24 2012-11-27 Elta Systems Ltd. System and method for imaging objects
CN102047142A (en) * 2008-05-30 2011-05-04 阿尔卡特朗讯美国公司 Wideband RF detection
CN102047142B (en) * 2008-05-30 2015-01-14 阿尔卡特朗讯美国公司 Wideband RF detection
US8194250B2 (en) * 2008-05-30 2012-06-05 Alcatel Lucent Wideband RF detection
US10451758B2 (en) 2008-08-11 2019-10-22 Airmar Technology Corporation Multi-function broadband phased-array software defined sonar system and method
US9091790B2 (en) 2008-08-11 2015-07-28 Airmar Technology Corporation Multi-function broadband phased-array software defined sonar system and method
US9772417B2 (en) 2008-08-11 2017-09-26 Airmar Technology Corporation Multi-function broadband phased-array software defined sonar system and method
US9772416B2 (en) 2008-08-11 2017-09-26 Airmar Technology Corporation Multi-function broadband phased-array software defined sonar system and method
US8068385B2 (en) 2008-11-24 2011-11-29 Raytheon Company System and method for enhancing weak target signals for a sensor array
US20100128566A1 (en) * 2008-11-24 2010-05-27 Qin Jiang System and method for enhancing weak target signals for a sensor array
US8164983B2 (en) 2009-03-06 2012-04-24 Johnson David A Fish finder
US8116169B2 (en) * 2009-05-13 2012-02-14 Raytheon Company Active sonar system and active sonar method using noise reduction techniques and advanced signal processing techniques
US20110228639A1 (en) * 2009-05-13 2011-09-22 Qin Jiang Active Sonar System and Active Sonar Method Using Noise Reduction Techniques and Advanced Signal Processing Techniques
US8666118B2 (en) 2009-05-20 2014-03-04 Imagenex Technology Corp. Controlling an image element in a reflected energy measurement system
US9541643B2 (en) 2009-07-14 2017-01-10 Navico Holding As Downscan imaging sonar
US8514658B2 (en) 2009-07-14 2013-08-20 Navico Holding As Downscan imaging sonar for reduced interference
US8605550B2 (en) 2009-07-14 2013-12-10 Navico Holding As Downscan imaging sonar
US10024961B2 (en) 2009-07-14 2018-07-17 Navico Holding As Sonar imaging techniques for objects in an underwater environment
US20110012777A1 (en) * 2009-07-14 2011-01-20 Raytheon Company Interferometric Synthetic Aperture Radar for Imaging of Buildings
US9223022B2 (en) 2009-07-14 2015-12-29 Navico Holding As Linear and circular downscan imaging sonar
US8040273B2 (en) * 2009-07-14 2011-10-18 Raytheon Company Radar for imaging of buildings
US20110128819A1 (en) * 2009-12-01 2011-06-02 Raytheon Company Active sonar system and active sonar method using fuzzy logic
US8320216B2 (en) 2009-12-01 2012-11-27 Raytheon Company Active sonar system and active sonar method using fuzzy logic
US8372006B1 (en) * 2010-06-16 2013-02-12 Quantason, LLC Method for detecting and locating a target using phase information
US20130082859A1 (en) * 2010-08-26 2013-04-04 David W. Paglieroni Spatially adaptive migration tomography for multistatic gpr imaging
US8508403B2 (en) * 2010-08-26 2013-08-13 Lawrence Livermore National Security, Llc Spatially adaptive migration tomography for multistatic GPR imaging
US9239382B2 (en) 2010-08-26 2016-01-19 Lawrence Livermore National Security, Llc Attribute and topology based change detection in a constellation of previously detected objects
US8109878B1 (en) * 2010-09-14 2012-02-07 Quantason, LLC Use of coded excitation schemes in the detection and location of a target in a human body such as breast calcifications
US9142206B2 (en) 2011-07-14 2015-09-22 Navico Holding As System for interchangeable mounting options for a sonar transducer
US9182486B2 (en) 2011-12-07 2015-11-10 Navico Holding As Sonar rendering systems and associated methods
US10247823B2 (en) 2011-12-07 2019-04-02 Navico Holding As Sonar rendering systems and associated methods
US9268020B2 (en) 2012-02-10 2016-02-23 Navico Holding As Sonar assembly for reduced interference
US10254428B2 (en) * 2012-05-17 2019-04-09 Deep Imaging Technologies, Inc. Using near and far field ULF and ELF interferometry synthetic aperture radar for subsurface imaging
US20150123835A1 (en) * 2012-05-17 2015-05-07 Deep Imaging Technologies Inc. System and Method Using Near and Far Field ULF and ELF Interferometry Synthetic Aperture Radar for Subsurface Imaging
US9638826B2 (en) * 2012-05-17 2017-05-02 Deep Imaging Technologies Inc. Method using near and far field ULF and ELF interferometry synthetic aperture radar for subsurface imaging
US9354312B2 (en) 2012-07-06 2016-05-31 Navico Holding As Sonar system using frequency bursts
US9244168B2 (en) 2012-07-06 2016-01-26 Navico Holding As Sonar system using frequency bursts
US9367565B2 (en) 2012-07-24 2016-06-14 Navico Holdings As Polygon creation for an aquatic geographic information system
US9361314B2 (en) 2012-07-24 2016-06-07 Navico Holding As Reporting for an aquatic geographic information system
US9430497B2 (en) 2012-07-24 2016-08-30 Navico Holding As Trip replay for an aquatic geographic information system
US9213722B2 (en) 2012-07-24 2015-12-15 Navico Holding As Elevation adjustment for an aquatic geographic information system
US9200882B2 (en) 2012-07-24 2015-12-01 Navico Holding As Contour interval control for an aquatic geographic information system
US9104697B2 (en) * 2012-07-24 2015-08-11 Navico Holdings As Aquatic geographic information system
US20140049418A1 (en) * 2012-08-17 2014-02-20 Geophysical Survey Systems, Inc. Realization of Time-Domain Ultra Wideband Ground-Penetrating Radar Using High Speed Accumulation and Interpolated Sampling
US9057782B2 (en) * 2012-08-17 2015-06-16 Geophysical Survey Systems, Inc. Realization of time-domain ultra wideband ground-penetrating radar using high speed accumulation and interpolated sampling
JP2017508162A (en) * 2014-03-14 2017-03-23 タレス Synthetic antenna sonar and method for forming a synthetic antenna beam
US10319356B2 (en) 2015-02-10 2019-06-11 Navico Holding As Transducer array having a transceiver
US9886938B2 (en) 2015-02-10 2018-02-06 Navico Holding As Transducer array having a transceiver
US10324173B2 (en) 2015-02-13 2019-06-18 Airmar Technology Corporation Acoustic transducer element
CN104793206B (en) * 2015-04-28 2017-03-29 西北工业大学 Using the imaging method of transmitting graing lobe
CN104793206A (en) * 2015-04-28 2015-07-22 西北工业大学 Imaging method through transmitting grating lobes
US10114119B2 (en) 2015-05-20 2018-10-30 Navico Holding As Sonar systems and methods using interferometry and/or beamforming for 3D imaging
US10024957B2 (en) 2015-09-17 2018-07-17 Navico Holding As Adaptive beamformer for sonar imaging
US20200400801A1 (en) * 2015-10-30 2020-12-24 Coda Octopus Group, Inc. Method of stabilizing sonar images
US11846733B2 (en) * 2015-10-30 2023-12-19 Coda Octopus Group Inc. Method of stabilizing sonar images
US10151829B2 (en) 2016-02-23 2018-12-11 Navico Holding As Systems and associated methods for producing sonar image overlay
US10365366B2 (en) 2016-06-21 2019-07-30 Navico Holding As Adjustable range viewing of sonar imagery during trip replay
US9986197B2 (en) 2016-08-24 2018-05-29 Navico Holding As Trip replay experience
CN108956761A (en) * 2017-05-23 2018-12-07 浙江工商职业技术学院 Steel plate all standing ultrasonic detection device and method
CN108956761B (en) * 2017-05-23 2020-12-25 浙江工商职业技术学院 Steel plate full-coverage ultrasonic detection device and method
US11367425B2 (en) 2017-09-21 2022-06-21 Navico Holding As Sonar transducer with multiple mounting options
US11143758B2 (en) 2017-10-13 2021-10-12 Navico Holding As Sonar transducer performance optimization
US11550052B2 (en) 2018-10-17 2023-01-10 United States Of America, As Represented By The Secretary Of The Army Interferometric synthetic aperture acoustic imager
US11249176B2 (en) * 2018-11-30 2022-02-15 Navico Holding As Systems and associated methods for monitoring vessel noise level
CN112416276B (en) * 2020-10-13 2021-07-23 北京匠数科技有限公司 Display picture analysis device, system and method
CN112416276A (en) * 2020-10-13 2021-02-26 北京匠数科技有限公司 Display picture analysis device, system and method
US11520042B1 (en) 2022-02-11 2022-12-06 Mythos AI Inc Apparatus and methods for artificial intelligence bathymetry

Similar Documents

Publication Publication Date Title
US6130641A (en) Imaging methods and apparatus using model-based array signal processing
US11668820B2 (en) Sonar data compression
Wang et al. Time-delay-and time-reversal-based robust capon beamformers for ultrasound imaging
AU2010297524B2 (en) Method and device for measuring a contour of the ground
US5200931A (en) Volumetric and terrain imaging sonar
EP3144700A1 (en) Adaptive beamformer for sonar imaging
US8469887B2 (en) Method and apparatus for flow parameter imaging
EP1004894B1 (en) Method and apparatus for high-frame-rate high-resolution ultrasonic image data acquisition
US9465101B2 (en) Aberration correction with broad transmit beams in medical ultrasound
EP2063292B1 (en) Calibrating a multibeam sonar apparatus
US4400803A (en) Wide swath precision echo sounder
Lo Adaptive array processing for wide-band active sonars
de Moustier Signal processing for swath bathymetry and concurrent seafloor acoustic imaging
US5812494A (en) Wide-angle, forward-looking bathymetric mapping
Allevato 3D imaging method for an air-coupled 40 kHz ultrasound phased-array
Doisy Theoretical accuracy of Doppler navigation sonars and acoustic Doppler current profilers
US5476098A (en) Partially coherent imaging for large-aperture phased arrays
US5548561A (en) Ultrasound image enhancement using beam-nulling
EP2317335B1 (en) Improved beamforming method for analysing signals received by a transducer arrray, and relative detection system
Kraeutner et al. Principal components array processing for swath acoustic mapping
US11187801B2 (en) Spiral sonar
EP0486096B1 (en) Alias suppression in pulsed doppler systems
WO1992000584A1 (en) Method and apparatus for acoustic holographic imaging in marine and other acoustic remote sensing equipment
Chen et al. Iterative adaptive approach for wide-band active sonar array processing
RU2802295C1 (en) Forward-looking sonar with increased range resolution

Legal Events

Date Code Title Description
AS Assignment

Owner name: SIMON FRASER UNIVERSITY, CANADA

Free format text: ASSIGNMENT OF ASSIGNORS INTEREST;ASSIGNORS:KRAEUTNER, PAUL H.;BIRD, JOHN;REEL/FRAME:009441/0255

Effective date: 19980902

STCF Information on status: patent grant

Free format text: PATENTED CASE

REFU Refund

Free format text: REFUND - SURCHARGE FOR LATE PAYMENT, LARGE ENTITY (ORIGINAL EVENT CODE: R1554); ENTITY STATUS OF PATENT OWNER: LARGE ENTITY

FEPP Fee payment procedure

Free format text: PAT HOLDER NO LONGER CLAIMS SMALL ENTITY STATUS, ENTITY STATUS SET TO UNDISCOUNTED (ORIGINAL EVENT CODE: STOL); ENTITY STATUS OF PATENT OWNER: LARGE ENTITY

REMI Maintenance fee reminder mailed
FPAY Fee payment

Year of fee payment: 4

FPAY Fee payment

Year of fee payment: 8

FPAY Fee payment

Year of fee payment: 12