US5991432A - Cytological system illumination integrity checking apparatus and method - Google Patents
Cytological system illumination integrity checking apparatus and method Download PDFInfo
- Publication number
- US5991432A US5991432A US08/911,644 US91164497A US5991432A US 5991432 A US5991432 A US 5991432A US 91164497 A US91164497 A US 91164497A US 5991432 A US5991432 A US 5991432A
- Authority
- US
- United States
- Prior art keywords
- calibration
- variation
- maximum
- determining
- test target
- Prior art date
- Legal status (The legal status is an assumption and is not a legal conclusion. Google has not performed a legal analysis and makes no representation as to the accuracy of the status listed.)
- Expired - Lifetime
Links
Images


Classifications
-
- G—PHYSICS
- G06—COMPUTING; CALCULATING OR COUNTING
- G06V—IMAGE OR VIDEO RECOGNITION OR UNDERSTANDING
- G06V20/00—Scenes; Scene-specific elements
- G06V20/60—Type of objects
- G06V20/69—Microscopic objects, e.g. biological cells or cellular parts
Definitions
- the present invention relates to a method and apparatus for evaluation of temporal and spatial variation of illumination in automated machine vision instruments. More specifically, the evaluation is conducted to characterize variations in global illuminance, static field intensity, dynamic field intensity, strobe repeatability, and intensity due to factors such as, for example, specimen thickness and cleanliness of system calibration hardware. Still more particularly, the present invention relates to automated instruments used for analyzing biological or cytological specimens, such as sputum samples, urine samples or pap smears.
- the present invention provides a method for checking system illumination in an automated cytological system comprising the steps of checking global illumination variation, static field uniformity, dynamic field uniformity, specimen thickness variation, strobe repeatability, calibration plate cleanliness, and strobe dropout.
- specimen thickness refers to the combined thickness of the substrate, objects of interest, mounting media and coverslip.
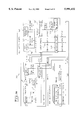
- FIGS. 1A, 1B, 1C and 1D show an automated cytology system and the placement of a calibration and test target into an optical path of an automated microscope as employed by the method and apparatus of the invention.
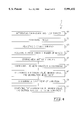
- FIG. 2 shows a histogram of global illumination variation.
- FIG. 3 shows an illustration of two illuminated fields as may be evaluated by a dynamic field uniformity test employed by the method of the invention.
- FIG. 4 shows an evaluation apparatus used in a strobe repeatability test method of the invention.
- FIG. 5 shows a high level flow diagram of one example of the method of the invention to check cytological system illumination integrity.
- FIG. 6 shows a flow diagram of one example of a global illumination test as provided by the method of the invention.
- FIG. 7 shows a flow diagram of one example of a method for checking static field of uniformity as employed by the method of the invention.
- FIG. 8 shows a flow diagram of one method of the invention for checking illumination variation due to specimen thickness variation.
- FIG. 9 shows a flow diagram of one method of the invention for checking strobe repeatability.
- FIG. 10 shows a flow diagram of one method of the invention for checking calibration plate cleanliness.
- FIG. 11 shows a flow diagram of one method of the invention for checking strobe drop out.
- FIG. 12 shows a flow diagram of one method of the invention for checking dynamic field uniformity.
- FIGS. 1A and 1B show a schematic diagram of one embodiment of the apparatus of the invention for checking illumination integrity for an automated microscope. While the method and apparatus of the invention will be discussed in terms of an example herein related to an automated cytology apparatus, it will be understood that the invention is not so limited. The features and principles of the invention may be applied to check urine analysis processes, semiconductor process, defects, liquid crystal devices and other types of processing systems employing, for example, continuous arc lamps, filament lamps, laser sources, tube cameras, PIN diodes and photomultiplier tubes.
- the apparatus of the invention comprises an imaging system 502, a motion control system 504, an image processing system 536, a central processing system 540, and a workstation 542.
- the imaging system 502 is comprised of an illuminator 508, imaging optics 510, a CCD camera 512, an illumination sensor 514 and an image capture and focus system 516.
- the image capture and focus system 516 provides video timing data to the CCD cameras 512, the CCD cameras 512 provide images comprising scan lines to the image capture and focus system 516.
- An illumination sensor intensity is provided to the image capture and focus system 516 where an illumination sensor 514 receives the sample of the image from the optics 510.
- the optics may further comprise an automated microscope.
- the illuminator 508 provides illumination of a slide.
- the image capture and focus system 516 provides data to a VME bus 538.
- the VME bus distributes the data to an image processing system 536.
- the image processing system 536 is comprised of field-of-view processors 568.
- the images are sent along the image bus 564 from the image capture and focus system 516.
- a central processor 540 controls the operation of the invention through the VME bus 538.
- the central processor includes a host CPU 562. In one embodiment the host CPU 562 comprises a Motorola 68030 CPU.
- the motion controller 504 is comprised of a tray handler 518, a microscope stage controller 520, a microscope turret 522, and a calibration slide 524.
- the motor drivers 526 position the slide under the optics.
- a bar code reader 528 reads a barcode located on the calibration slide 524.
- a touch sensor 530 determines whether a slide is under the microscope objectives, and a door interlock 532 prevents operation in case the doors are open.
- Motion controller 534 controls the motor drivers 526 in response to the central processor 540.
- An EthernetTM communication system 560 communicates to a workstation 542 to provide control of the system.
- a hard disk 544 is controlled by workstation 550.
- workstation 550 may comprise a Sun Sparc ClassicTM workstation.
- a tape drive 546 is connected to the processor 550 as well as a modem 548, a monitor 552, a keyboard 554, and a mouse pointing device 556.
- a printer 558 is connected to the EthernetTM network 560.
- the central computer 540 controls the microscope and the processor to acquire and digitize images from the microscope.
- the flatness of the slide may be checked, for example, by contacting the four corners of the slide using a computer controlled touch sensor.
- the computer 540 also controls the microscope stage to position the specimen under the microscope objective, and from one to 15 field of view (FOV) processors 568 which receive images under control of the computer 540.
- FOV field of view
- the calibration and test target 1 may be a clear piece of glass that is approximately 1.45 mm thick.
- the calibration and test target advantageously comprises specified clear areas and image primitives such as horizontal and vertical bar targets.
- Such calibration and test target plates are used for most transmission microscopes to simulate the optical path difference effects introduced by the substrate, coverslip and specimen media.
- the calibration and test target 1 is positioned longitudinally away from a plane of best focus 2 to reduce the effects of flaws in the glass and contaminants 4 that may stick to the surface of the calibration and test target plate.
- the cytological system illumination integrity checking method 100 includes checking global illumination variation at process step 10, checking static field uniformity at process step 12, checking dynamic field uniformity at process step 14, checking specimen thickness variation at process step 16, checking strobe repeatability at process step 18, checking calibration plate cleanliness at process step 20 and checking strobe dropout at process step 22. Each of these process steps will be explained in more detail hereinbelow.
- Illumination sources typically employed in automated vision analysis instruments exhibit variations in energy output from one collected image to another collected image.
- the arc is unconstrained and can vary spatially between flashes.
- the combined effects of energy output variations and spatial variations may cause a variation of illuminance over the entire field of view from collected image to collected image.
- the imaging device in order to approach optimal use of an imaging device, such as a CCD focal plane, the imaging device should be used as near as possible to its optimal dynamic range. That is to say, illuminance should be set at a level suitable for obtaining the optimal discrimination performance of the imaging device for the application.
- FIG. 6 a flow diagram of one method of the invention for providing global illumination variation tests 10 is shown.
- Global illumination tests are used to check the illuminance level of a light source, such as an arc lamp.
- a calibration and test target is introduced into the optical path at process step 60 and positioned at process step 62.
- the system illuminance is adjusted to an optimal level as may best be determined by an operator or automated system, for example.
- a predetermined number of images are acquired at process step 64. In one example of the invention, about one hundred (100) images are acquired. Each image may comprise a 512 ⁇ 512 array of pixels that are 256 grey levels deep. The mean pixel value for each acquired image is computed and temporarily stored at process step 65.
- mean intensity values are tabulated at step 66 in a histogram format like that shown in Table 1.
- the left most column of Table 1 represents the mean intensity of the illuminated field in counts.
- the right most column denotes the number of occurrences of the corresponding mean field intensity for the one hundred images acquired.
- the center column represents a normally distributed variation with a mean and standard deviation similar to the actual data. It is only shown to demonstrate that the actual data varies in accordance with normally distributed population. Therefore, the data can be analyzed using standard statistical parameters.
- FIG. 2 shows a plot of the data in Table 1. It is apparent from FIG. 2 that the variation behaves like a normal random distribution. The maximum, minimum, mean and coefficient of variation for the distribution are determined at process step 67. A coefficient of variation of these mean values is determined at process step 68. These parameters are compared, in step 69 against engineered limits as shown in Table 2. Camera dynamic range is defined herein as the mean of mean voltages for all images. Examples of engineering limits used in one example of the invention for checking global illumination variation are as follows.
- the method of the invention for checking global illumination ensures the field of view is illuminated at the proper intensity and that the global intensity does not vary by more than the limits shown.
- FIG. 7 a flow diagram illustrating the method of the invention for checking static field of uniformity as employed by the method of the invention is shown.
- the field of view illuminated in automated vision analysis instruments can vary in intensity at various points in the field due to misalignments, debris on optical surfaces, poor optical design in addition to other factors.
- the spatial response of the detector such as a CCD camera, may also vary, exhibiting a behavior known as patterning. The totality of these variations may be referred to as static field uniformity.
- a calibration and test target is introduced into the optical path at process step 72.
- a single image is captured and a histogram is generated for the image pixels at process steps 73 and 74 respectively.
- the maximum, minimum values and the coefficient of variation of the pixels are determined for the histogram at step 75.
- the maximum and minimum variation is computed for 99.9% of the field-of-view by ignoring the 0.1% outlying pixels at the tails of the histogram. This value provides a measure of the field uniformity without the affects of stray pixels.
- the variation factors are evaluated by comparing the coefficient of variation against a first predetermined limit 77, comparing the maximum variation against a second predetermined limit 78, comparing the partial field maximum variation against a third predetermined limit 79.
- the illumination may vary dynamically from image to image.
- the field may have a maximum static variation of 15 units.
- the maximum static variation may be also be variation. However, that variation may be evident in the opposite direction, resulting in an actual non-uniformity of 30 units.
- FIG. 3 shows an illustration of two illuminated fields as may be evaluated by a dynamic field uniformity test employed by the method of the invention.
- the pixel on the left 304, 305 respectively, maintained a value of 230.
- the intensity of the pixel on the right 307, 308 respectively differs by 30 counts between the fields. This represents a change in intensity of ⁇ 6.5%.
- the dynamic field uniformity test is run to check for such a condition.
- FIG. 12 shows a flow diagram of one method of the invention for checking dynamic field uniformity.
- a calibration and test target is introduced into the optical path in step 1202.
- Fifty images are collected in step 1203 and a histogram is generated for each image in step 1204.
- the maximum values, minimum values and the coefficient of variation are determined in step 1205 for each illuminated field. Additionally, the maximum and minimum variation is computed for 99.9% of the field-of-view by ignoring the 0.1% outlying pixels at the tails of the histogram.
- a difference is taken between the highest and lowest pixel values for all 50 images in step 1206. This value is divided by two times the mean to determine the ⁇ full field variations in step 1208.
- the same method is used to determine the ⁇ partial field variation in step 1210.
- These values are compared against limits as shown in Table 5 in step 1212.
- the worst, that is the highest, coefficient of variation of the fifty fields is compared against the limit shown in Table 5.
- Table 5 also shows values from an actual test.
- the illumination system of FIG. 1C is designed to operate with prescribed optical path distances.
- specimens are usually mounted on a substrate and a coverslip is placed over the substrate.
- the thickness of the substrate or slide, coverslip and mounting media may vary. These variations introduce a change in the optical path of the illumination system. These changes, if not carefully designed for, may degrade the illumination uniformity.
- uniformity may degrade at the upper or lower end of the slide thickness range due to the same reasons as mentioned in the static field uniformity section. Although this degradation may occur at one or the other or both extremes, it may not occur at the nominal slide thickness. Therefore, illumination uniformity must be checked at the extremes of the designed operating limits.
- the system is designed to accommodate a range of 1.0 mm to 1.9 mm of combined slide, mounting media and coverslip thickness variations.
- FIG. 8 shows a flow diagram of one method of the invention for checking specimen thickness variation.
- a calibration and test target is introduced into the optical path 82. However, this time different parts of the calibration plate are used.
- the calibration plate also contains clear areas that are 1.0 mm and 1.90 mm thick. These areas are used correspondingly to conduct the thickness test.
- the static field uniformity test described above is run twice--once with a 1.0 mm thick slide and a second time with a 1.9 mm thick slide at process steps 84 and 86 respectively.
- the coefficient of variation and maximum variation, for both the full and partial fields, are recorded for each slide thickness 88.
- a second coefficient of variation and a second maximum variation, for both the full and partial fields, are recorded for the second slide thickness 182.
- the results are evaluated by comparing the first coefficient of variation against a first predetermined limit 184, comparing the first maximum variation against a second predetermined limit 186, comparing the first maximum partial field variation against a third predetermined limit 188, comparing the second coefficient of variation against a fourth predetermined limit 282, comparing the second maximum variation against a fifth predetermined limit 284, and comparing the second maximum partial field variation against a sixth predetermined limit 286.
- FIG. 4 shows an evaluation apparatus used in a strobe repeatability test method of the invention.
- a pulsed arc lamp, or strobe 412 for illumination is employed.
- the strobe transmits light through optics 410.
- a beam splitter 404 is positioned to receive the light to split the light into a first beam and a second beam wherein the second beam provides illumination to condenser lens 402 for a microscopic evaluation of the slide 1.
- a detector 406 is positioned in an optical path defined by the beam splitter 404 and a second lens 408 to receive the first beam for providing a detected signal indicative of a first beam intensity.
- the automated microscope may use the detected signal to adjust for illumination variations.
- a running average of detected signals may be obtained and the detected signal may be adjusted for the running average. Aging of the strobe and drive electronics can cause a strobe to become unstable and vary the energy output from flash to flash. This variation is not unlike variations that may occur in other illumination sources.
- the preferred embodiment shown comprises a double beam system where detector 406 comprises a PIN diode positioned to receive light from the strobe as light is split away from the main optical path of light directed toward the specimen. As shown, a beam splitter 404 is placed to split the light before it reaches the specimen.
- FIG. 9 a flow diagram of one method of the invention for checking strobe repeatability 18 is shown.
- Data from the strobe may be collected during the global illumination test at process step 92.
- the maximum, minimum and coefficient of variation of strobe output is determined at process step 94.
- the coefficient of variation is compared against a predetermined coefficient of variation limit. The results are evaluated as follows according to Table 8 at process step 98.
- the calibration and target plate advantageously has a specified clear area for calibration of pixel gain and offset.
- the calibration plate is lowered to remove its surfaces from the focal plane of the objectives.
- large debris on the calibration plate may be visible. This can cause an erroneous calibration.
- the calibration plate dirt check test is run to check for this condition.
- a calibration and test target is introduced into the optical path at process step 102.
- the calibration and test target is moved about 50 microns in both x and y directions from its typical test and calibration position. This is done to highlight potentially contaminated areas that may be masked by the instrument pixel calibration.
- An image is collected and a histogram is generated at process steps 106 and 108 respectively.
- a coefficient of variation, for both full and partial field maximum variations are computed from the histogram data.
- a maximum variation and a minimum variation are computed for a predetermined portion of the field-of-view by ignoring outlying pixels of the histogram so as to provide a measure of the calibration plate cleanliness.
- the results are evaluated by comparing the coefficient of variation against a first predetermined limit at step 1006, comparing the maximum variation against a second predetermined limit at step 1008 and comparing the partial field maximum variation against a third predetermined limit in step 1012.
- FIG. 11 a flow diagram of one method of the invention for checking strobe drop out is shown.
- the method includes the steps of maintaining a running average of strobe intensity samples over a predetermined number of samples 1102, comparing each strobe intensity sample against a dropout limit 1104, counting each strobe intensity sample which does not meet the dropout limit as a dropout sample to obtain a plurality of dropout samples 1106, summing the plurality of dropout samples occurring during a predetermined event to produce a dropout sum 1108, and after the predetermined event, comparing the dropout sum to a dropout sum limit 1110.
- a strobe lamp In operation, occasionally, a strobe lamp will generate arcs that are erratic in position or energy output. This type of behavior can cause the illumination system to produce a field of lower illuminance.
- the strobe is constantly monitored. A running average of the strobe is maintained consisting of 500 samples. All samples taken that exceed 5% of the running average are considered drop outs. The strobe drop out monitor test sums these dropouts during a tray of processing (8 slides), or roughly one hour. After processing a tray, the sum is compared to a limit. In this embodiment, the total of acceptable errant flashes is around 0.03%. The limit is evaluated against a standard as follows:
- strobe dropouts greater than 5% ⁇ 30 dropouts per tray.
- this invention comprises of a suite of tests and parameter monitoring scheme to characterize certain facets of illumination.
- the above-described tests refer specifically to a system with a pulsed arc lamp and CCD imaging device.
- the concepts may be employed to continuous arc lamps, filament lamps, LASER sources, tube cameras, TDI sensors, tube cameras and PIN diodes and photomultiplier tubes.
Abstract
Description
              TABLE 1
______________________________________
Intensity   Normal Distribution
                         Actual Data
______________________________________
226         0.00         0
227         0.00         0
228         0.00         0
229         0.00         0
230         0.00         0
231         0.06         0
232         0.53         0
233         3.06         0
234         10.67        14
235         22.59        23
236         29.00        29
237         22.59        19
238         10.67        15
239         3.06         0
240         0.53         0
241         0.06         0
242         0.00         0
243         0.00         0
244         0.00         0
245         0.00         0
246         0.00         0
______________________________________
              TABLE 2
______________________________________
Parameter Results and Limits Comparison
Parameter Description
               Actual Value
                           Limits
______________________________________
Mean Intensity 236         223 counts < ∞ < 242
                           counts
Coefficient of Variation
               0.53%       <1.0%
Maximum % variation
               0.85%       (max-min)/
                           (2* mean) < 1.5%
______________________________________
              TABLE 3
______________________________________
Intensity Histogram of Entire Field
INT = INTENSITY, # = NUMBER OF
PIXELS AT CORRESPONDING INTENSITY
Int #
______________________________________
 0: 0
 1: 0
 2: 0
 3: 0
 4: 0
 5: 0
 6: 0
 7: 0
 8: 0
 9: 0
 10: 0
 11: 0
 12: 0
 13: 0
 14: 0
 15: 0
 16: 0
 17: 0
 18: 0
 19: 0
 20: 0
 21: 0
 22: 0
 23: 0
 24: 0
 25: 0
 26: 0
 27: 0
 28: 0
 29: 0
 30: 0
 31: 0
 32: 0
 33: 0
 34: 0
 35: 0
 36: 0
 37: 0
 38: 0
 39: 0
 40: 0
 41: 0
 42: 0
 43: 0
 44: 0
 45: 0
 46: 0
 47: 0
 48: 0
 49: 0
 50: 0
 51: 0
 52: 0
 53: 0
 54: 0
 55: 0
 56: 0
 57: 0
 58: 0
 59: 0
 60: 0
 61: 0
 62: 0
 63: 0
 64: 0
 65: 0
 66: 0
 67: 0
 68: 0
 69: 0
 70: 0
 71: 0
 72: 0
 73: 0
 74: 0
 75: 0
 76: 0
 77: 0
 78: 0
 79: 0
 80: 0
 81: 0
 82: 0
 83: 0
 84: 0
 85: 0
 86: 0
 87: 0
 88: 0
 89: 0
 90: 0
 91: 0
 92: 0
 93: 0
 94: 0
 95: 0
 96: 0
 97: 0
 98: 0
 99: 0
100: 0
101: 0
102: 0
103: 0
104: 0
105: 0
106: 0
107: 0
108: 0
109: 0
110: 0
111: 0
112: 0
113: 0
114: 0
115: 0
116: 0
117: 0
118: 0
119: 0
120: 0
121: 0
122: 0
123: 0
124: 0
125: 0
126: 0
127: 0
128: 0
129: 0
130: 0
131: 0
132: 0
l33: 0
134: 0
135: 0
136: 0
137: 0
138: 0
139: 0
140: 0
141: 0
142: 0
143: 0
144: 0
145: 0
146: 0
147: 0
148: 0
149: 0
150: 0
151: 0
152: 0
153: 0
154: 0
155: 0
156: 0
157: 0
158: 0
159: 0
160: 0
161: 0
162: 0
163: 0
164: 0
165: 0
166: 0
167: 0
168: 0
169: 0
170: 0
171: 0
172: 0
173: 0
174: 0
175: 0
176: 0
177: 0
178: 0
179: 0
180: 0
181: 0
182: 0
183: 0
184: 0
185: 0
186: 0
187: 0
188: 0
189: 0
190: 0
191: 0
192: 0
193: 0
194: 0
195: 0
196: 0
197: 0
198: 0
199: 0
200: 0
201: 0
202: 0
203: 0
204: 0
205: 0
206: 0
207: 0
208: 0
209: 0
210: 0
211: 0
212: 0
213: 0
214: 0
215: 0
216: 0
217: 0
218: 0
219: 0
220: 0
221: 0
222: 0
223: 0
224: 2
225: 7
 226: 213
  227: 1424
  228: 7803
  229: 47942
  230: 60366
  231: 74350
  232: 51837
  233: 15630
  234: 2231
 235: 317
 236: 22
237: 0
238: 0
239: 0
240: 0
241: 0
242: 0
243: 0
244: 0
245: 0
246: 0
247: 0
248: 0
249: 0
250: 0
251: 0
252: 0
253: 0
254: 0
255: 0
______________________________________
              TABLE 4
______________________________________
Parameter Description
                    Actual Value
                              Limits
______________________________________
Coefficient of variation:
                    0.6%      <1.0%
Maximum % variation (full field):
                    2.6%      <6.0%
Maximum % Variation 1.7%      <3.0%
(partial field):
______________________________________
              TABLE 5
______________________________________
Parameter Results and Limits Comparison for
Dynamic Field Uniformity
Parameter Description
                     Actual Value
                               Limits
______________________________________
Coefficient of variation
                     0.6%      <1.0%
Maximum % variation (full field):
                     2.8%      <8.0%
Maximum % variation (partial field):
                     1.9%      <4.0%
______________________________________
              TABLE 6
______________________________________
Parameter Results and Limits Comparison for
Thin Slide Field Uniformity
Parameter Description
                    Actual Value
                              Limits
______________________________________
Coefficient of variation:
                    0.6%      <1.0%
Maximum % variation (full field):
                    2.6%      <6.0%
Maximum % Variation 1.7%      <3.0%
(partial field):
______________________________________
              TABLE 7
______________________________________
Parameter Results and Limits Comparison for
Thick Slide Field Uniformity
Parameter Description
                    Actual Value
                              Limits
______________________________________
Coefficient of variation:
                    0.6%      <1.0%
Maximum % variation (full field):
                    2.6%      <6.0%
Maximum % Variation 1.7%      <3.0%
(partial field):
______________________________________
              TABLE 8
______________________________________
Parameter Results and Limits Comparison
for Strobe Repeatability Test
Parameter Description
                  Actual Value
                            Limits
______________________________________
Coefficient of variation:
                  0.6%      <1.0%
Maximum % variation:
                  2.9%      <5.0%
______________________________________
Claims (6)
Priority Applications (1)
| Application Number | Priority Date | Filing Date | Title |
|---|---|---|---|
| US08/911,644 US5991432A (en) | 1994-09-08 | 1997-08-15 | Cytological system illumination integrity checking apparatus and method |
Applications Claiming Priority (2)
| Application Number | Priority Date | Filing Date | Title |
|---|---|---|---|
| US08/303,179 US5715326A (en) | 1994-09-08 | 1994-09-08 | Cytological system illumination integrity checking apparatus and method |
| US08/911,644 US5991432A (en) | 1994-09-08 | 1997-08-15 | Cytological system illumination integrity checking apparatus and method |
Related Parent Applications (1)
| Application Number | Title | Priority Date | Filing Date |
|---|---|---|---|
| US08/303,179 Division US5715326A (en) | 1994-09-08 | 1994-09-08 | Cytological system illumination integrity checking apparatus and method |
Publications (1)
| Publication Number | Publication Date |
|---|---|
| US5991432A true US5991432A (en) | 1999-11-23 |
Family
ID=23170869
Family Applications (6)
| Application Number | Title | Priority Date | Filing Date |
|---|---|---|---|
| US08/303,179 Expired - Lifetime US5715326A (en) | 1994-09-08 | 1994-09-08 | Cytological system illumination integrity checking apparatus and method |
| US08/911,644 Expired - Lifetime US5991432A (en) | 1994-09-08 | 1997-08-15 | Cytological system illumination integrity checking apparatus and method |
| US08/911,611 Expired - Lifetime US5995680A (en) | 1994-09-08 | 1997-08-15 | Cytological system illumination integrity checking apparatus and method |
| US08/911,612 Expired - Lifetime US6011861A (en) | 1994-09-08 | 1997-08-15 | Cytological system illumination integrity checking apparatus and method |
| US08/912,061 Expired - Lifetime US6067370A (en) | 1994-09-08 | 1997-08-15 | Cytological system illumination integrity checking apparatus and method |
| US08/911,807 Expired - Lifetime US5991462A (en) | 1994-09-08 | 1997-08-15 | Cytological system illumination integrity checking method |
Family Applications Before (1)
| Application Number | Title | Priority Date | Filing Date |
|---|---|---|---|
| US08/303,179 Expired - Lifetime US5715326A (en) | 1994-09-08 | 1994-09-08 | Cytological system illumination integrity checking apparatus and method |
Family Applications After (4)
| Application Number | Title | Priority Date | Filing Date |
|---|---|---|---|
| US08/911,611 Expired - Lifetime US5995680A (en) | 1994-09-08 | 1997-08-15 | Cytological system illumination integrity checking apparatus and method |
| US08/911,612 Expired - Lifetime US6011861A (en) | 1994-09-08 | 1997-08-15 | Cytological system illumination integrity checking apparatus and method |
| US08/912,061 Expired - Lifetime US6067370A (en) | 1994-09-08 | 1997-08-15 | Cytological system illumination integrity checking apparatus and method |
| US08/911,807 Expired - Lifetime US5991462A (en) | 1994-09-08 | 1997-08-15 | Cytological system illumination integrity checking method |
Country Status (3)
| Country | Link |
|---|---|
| US (6) | US5715326A (en) |
| AU (1) | AU3364495A (en) |
| WO (1) | WO1996007977A1 (en) |
Cited By (1)
| Publication number | Priority date | Publication date | Assignee | Title |
|---|---|---|---|---|
| US6633684B1 (en) * | 2000-07-07 | 2003-10-14 | Athentech Technologies Corp. | Distortion-free image contrast enhancement |
Families Citing this family (15)
| Publication number | Priority date | Publication date | Assignee | Title |
|---|---|---|---|---|
| US5715326A (en) * | 1994-09-08 | 1998-02-03 | Neopath, Inc. | Cytological system illumination integrity checking apparatus and method |
| US6148096A (en) * | 1995-09-15 | 2000-11-14 | Accumed International, Inc. | Specimen preview and inspection system |
| US6091842A (en) * | 1996-10-25 | 2000-07-18 | Accumed International, Inc. | Cytological specimen analysis system with slide mapping and generation of viewing path information |
| US6430309B1 (en) | 1995-09-15 | 2002-08-06 | Monogen, Inc. | Specimen preview and inspection system |
| DE19633997C1 (en) * | 1996-08-23 | 1998-03-26 | Univ Stuttgart | Remote image inspection facility for image transmission |
| US5872860A (en) * | 1997-03-13 | 1999-02-16 | Ortho Diagnostic Systems, Inc. | Calibration cassette for use in calibrating an automated agglutination reaction analyzing system |
| US6593102B2 (en) | 1999-10-29 | 2003-07-15 | Cytyc Corporation | Cytological stain composition |
| US6665060B1 (en) | 1999-10-29 | 2003-12-16 | Cytyc Corporation | Cytological imaging system and method |
| US6661501B1 (en) | 1999-10-29 | 2003-12-09 | Cytyc Corporation | Cytological stain composition including verification characteristic |
| US6348325B1 (en) | 1999-10-29 | 2002-02-19 | Cytyc Corporation | Cytological stain composition |
| US6535626B1 (en) | 2000-01-14 | 2003-03-18 | Accumed International, Inc. | Inspection system with specimen preview |
| JP2004030596A (en) * | 2002-05-10 | 2004-01-29 | Canon Inc | Image gradation conversion method, image gradation conversion apparatus, system, program, and storage medium |
| CA2582112A1 (en) * | 2006-03-13 | 2007-09-13 | Clemex Technologies Inc. | System and method for automatic measurements and calibration of computerized magnifying instruments |
| US8577171B1 (en) * | 2006-07-31 | 2013-11-05 | Gatan, Inc. | Method for normalizing multi-gain images |
| JP7075773B2 (en) * | 2018-02-16 | 2022-05-26 | オリンパス株式会社 | Image processing equipment, microscope system, image processing method and image processing program |
Citations (12)
| Publication number | Priority date | Publication date | Assignee | Title |
|---|---|---|---|---|
| US4042808A (en) * | 1975-08-11 | 1977-08-16 | Angel Engineering Corporation | Particle count correction |
| US4202033A (en) * | 1977-12-27 | 1980-05-06 | Royco Instruments, Inc. | Apparatus and method utilizing calculator for quality control of hematology sample analysis |
| US4239395A (en) * | 1978-08-07 | 1980-12-16 | Modisette James E | Radiographic imaging system quality monitor |
| US4732473A (en) * | 1984-06-14 | 1988-03-22 | Josef Bille | Apparatus for, and methods of, determining the characteristics of semi-conductor wafers |
| US4741043A (en) * | 1985-11-04 | 1988-04-26 | Cell Analysis Systems, Inc. | Method of and an apparatus for image analyses of biological specimens |
| US4907876A (en) * | 1987-05-08 | 1990-03-13 | Hamamatsu Photonics Kabushiki Kaisha | Examination apparatus for measuring oxygenation in body organs |
| US5103829A (en) * | 1987-05-08 | 1992-04-14 | Hamamatsu Photonics Kabushiki Kaisha | Examination apparatus for measuring oxygenation in body organs |
| US5149972A (en) * | 1990-01-18 | 1992-09-22 | University Of Massachusetts Medical Center | Two excitation wavelength video imaging microscope |
| US5153745A (en) * | 1990-09-28 | 1992-10-06 | Xerox Corporation | Method and apparatus for compensating for illumination variations of a lamp in a document scanning system following extended lamp inactivity |
| US5275951A (en) * | 1991-06-13 | 1994-01-04 | Abbott Laboratories | Liquid level sensing method and device |
| US5315700A (en) * | 1992-02-18 | 1994-05-24 | Neopath, Inc. | Method and apparatus for rapidly processing data sequences |
| US5361140A (en) * | 1992-02-18 | 1994-11-01 | Neopath, Inc. | Method and apparatus for dynamic correction of microscopic image signals |
Family Cites Families (11)
| Publication number | Priority date | Publication date | Assignee | Title |
|---|---|---|---|---|
| JPS53135697A (en) * | 1977-04-30 | 1978-11-27 | Olympus Optical Co Ltd | Automatic cell diagnosis apparatus |
| US5216596A (en) * | 1987-04-30 | 1993-06-01 | Corabi International Telemetrics, Inc. | Telepathology diagnostic network |
| US5030008A (en) * | 1988-10-11 | 1991-07-09 | Kla Instruments, Corporation | Method and apparatus for the automated analysis of three-dimensional objects |
| US5079698A (en) * | 1989-05-03 | 1992-01-07 | Advanced Light Imaging Technologies Ltd. | Transillumination method apparatus for the diagnosis of breast tumors and other breast lesions by normalization of an electronic image of the breast |
| US5255069A (en) * | 1989-06-30 | 1993-10-19 | Eastman Kodak Company | Electro-optical interferometric microdensitometer system |
| US5428690A (en) * | 1991-09-23 | 1995-06-27 | Becton Dickinson And Company | Method and apparatus for automated assay of biological specimens |
| US5303023A (en) * | 1992-03-26 | 1994-04-12 | Allergan, Inc. | Apparatus and method for inspecting a test lens, method of making a test lens |
| US5475420A (en) * | 1993-06-09 | 1995-12-12 | Origin Medsystems, Inc. | Video imaging system with image processing optimized for small-diameter endoscopes |
| US5506675A (en) * | 1994-03-11 | 1996-04-09 | Northrop Grumman Corporation | Laser target designator tester for measuring static and dynamic error |
| US5715326A (en) * | 1994-09-08 | 1998-02-03 | Neopath, Inc. | Cytological system illumination integrity checking apparatus and method |
| US5756990A (en) * | 1996-04-17 | 1998-05-26 | The United States Of America As Represented By The Secretary Of The Army | Simplified simulation of effects of turbulence on digital imagery |
-
1994
- 1994-09-08 US US08/303,179 patent/US5715326A/en not_active Expired - Lifetime
-
1995
- 1995-08-11 AU AU33644/95A patent/AU3364495A/en not_active Abandoned
- 1995-08-11 WO PCT/US1995/010279 patent/WO1996007977A1/en active Application Filing
-
1997
- 1997-08-15 US US08/911,644 patent/US5991432A/en not_active Expired - Lifetime
- 1997-08-15 US US08/911,611 patent/US5995680A/en not_active Expired - Lifetime
- 1997-08-15 US US08/911,612 patent/US6011861A/en not_active Expired - Lifetime
- 1997-08-15 US US08/912,061 patent/US6067370A/en not_active Expired - Lifetime
- 1997-08-15 US US08/911,807 patent/US5991462A/en not_active Expired - Lifetime
Patent Citations (13)
| Publication number | Priority date | Publication date | Assignee | Title |
|---|---|---|---|---|
| US4042808A (en) * | 1975-08-11 | 1977-08-16 | Angel Engineering Corporation | Particle count correction |
| US4202033A (en) * | 1977-12-27 | 1980-05-06 | Royco Instruments, Inc. | Apparatus and method utilizing calculator for quality control of hematology sample analysis |
| US4239395A (en) * | 1978-08-07 | 1980-12-16 | Modisette James E | Radiographic imaging system quality monitor |
| US4732473A (en) * | 1984-06-14 | 1988-03-22 | Josef Bille | Apparatus for, and methods of, determining the characteristics of semi-conductor wafers |
| US4741043A (en) * | 1985-11-04 | 1988-04-26 | Cell Analysis Systems, Inc. | Method of and an apparatus for image analyses of biological specimens |
| US4741043B1 (en) * | 1985-11-04 | 1994-08-09 | Cell Analysis Systems Inc | Method of and apparatus for image analyses of biological specimens |
| US5103829A (en) * | 1987-05-08 | 1992-04-14 | Hamamatsu Photonics Kabushiki Kaisha | Examination apparatus for measuring oxygenation in body organs |
| US4907876A (en) * | 1987-05-08 | 1990-03-13 | Hamamatsu Photonics Kabushiki Kaisha | Examination apparatus for measuring oxygenation in body organs |
| US5149972A (en) * | 1990-01-18 | 1992-09-22 | University Of Massachusetts Medical Center | Two excitation wavelength video imaging microscope |
| US5153745A (en) * | 1990-09-28 | 1992-10-06 | Xerox Corporation | Method and apparatus for compensating for illumination variations of a lamp in a document scanning system following extended lamp inactivity |
| US5275951A (en) * | 1991-06-13 | 1994-01-04 | Abbott Laboratories | Liquid level sensing method and device |
| US5315700A (en) * | 1992-02-18 | 1994-05-24 | Neopath, Inc. | Method and apparatus for rapidly processing data sequences |
| US5361140A (en) * | 1992-02-18 | 1994-11-01 | Neopath, Inc. | Method and apparatus for dynamic correction of microscopic image signals |
Cited By (1)
| Publication number | Priority date | Publication date | Assignee | Title |
|---|---|---|---|---|
| US6633684B1 (en) * | 2000-07-07 | 2003-10-14 | Athentech Technologies Corp. | Distortion-free image contrast enhancement |
Also Published As
| Publication number | Publication date |
|---|---|
| US6011861A (en) | 2000-01-04 |
| US5991462A (en) | 1999-11-23 |
| AU3364495A (en) | 1996-03-27 |
| US5715326A (en) | 1998-02-03 |
| US5995680A (en) | 1999-11-30 |
| US6067370A (en) | 2000-05-23 |
| WO1996007977A1 (en) | 1996-03-14 |
Similar Documents
| Publication | Publication Date | Title |
|---|---|---|
| US5991432A (en) | Cytological system illumination integrity checking apparatus and method | |
| US5499097A (en) | Method and apparatus for checking automated optical system performance repeatability | |
| US5647025A (en) | Automatic focusing of biomedical specimens apparatus | |
| CA2200453C (en) | Cytological system autofocus integrity checking apparatus | |
| EP0179309B1 (en) | Automatic defect detection system | |
| JP3090679B2 (en) | Method and apparatus for measuring a plurality of optical properties of a biological specimen | |
| US5642433A (en) | Method and apparatus for image contrast quality evaluation | |
| EP0374694B1 (en) | Defect detection system and method for pattern to be inspected | |
| US7589892B2 (en) | Specimen imaging apparatus and specimen analyzer | |
| US5715327A (en) | Method and apparatus for detection of unsuitable conditions for automated cytology scoring | |
| US5581631A (en) | Cytological system image collection integrity checking apparatus | |
| JP4387089B2 (en) | Defect inspection apparatus and defect inspection method | |
| US4656663A (en) | Method of film inspection with a microscopical image analyzer | |
| JP4523310B2 (en) | Foreign matter identification method and foreign matter identification device | |
| US20220114738A1 (en) | Method of and microscope comprising a device for detecting movements of a sample with respect to an objective | |
| EP0782736A1 (en) | Method and apparatus for image plane modulation pattern recognition | |
| AU687640C (en) | Method and apparatus for checking automated optical system performance repeatability | |
| AU721417C (en) | Cytological system image collection integrity checking apparatus | |
| Boecker et al. | Autofocus algorithms for fluorescence microscopy | |
| JPH0763665A (en) | Flow-type particle image analyzer |
Legal Events
| Date | Code | Title | Description |
|---|---|---|---|
| STCF | Information on status: patent grant |
Free format text: PATENTED CASE |
|
| AS | Assignment |
Owner name: C/O MEIER MITCHELL & COMPANY, CALIFORNIA Free format text: SECURITY AGREEMENT;ASSIGNOR:TRIPATH IMAGING, INC., A DELAWARE CORPORATION;REEL/FRAME:010526/0422 Effective date: 20000119 |
|
| AS | Assignment |
Owner name: SILICON VALLEY BANK, CALIFORNIA Free format text: SECURITY INTEREST;ASSIGNOR:AUTOCYTE NORTH CAROLINA, LLC;REEL/FRAME:010696/0502 Effective date: 20000131 |
|
| AS | Assignment |
Owner name: SILICON VALLEY BANK, GEORGIA Free format text: SECURITY AGREEMENT;ASSIGNOR:TRIPATH IMAGING, INC., A CORP. OF DELAWARE;REEL/FRAME:011064/0195 Effective date: 20000131 |
|
| AS | Assignment |
Owner name: TRIPATH IMAGING, INC., NORTH CAROLINA Free format text: MERGER;ASSIGNOR:NEOPATH, INC.;REEL/FRAME:012841/0155 Effective date: 19991227 |
|
| AS | Assignment |
Owner name: TRIPATH IMAGING, INC., NORTH CAROLINA Free format text: TERMINATION OF SECURITY INTEREST;ASSIGNOR:MMC/GATX PARTNERSHIP NO. I TRANSAMERICA BUSINESS CREDIT CORPORATION;REEL/FRAME:014567/0155 Effective date: 20030404 |
|
| FPAY | Fee payment |
Year of fee payment: 4 |
|
| AS | Assignment |
Owner name: AUTOCYTE NORTH CAROLINA, INC., NORTH CAROLINA Free format text: RELEASE OF SECURITY AGREEMENT;ASSIGNOR:SILICON VALLEY BANK;REEL/FRAME:018207/0441 Effective date: 20060830 Owner name: TRIPATH IMAGING, INC., NORTH CAROLINA Free format text: RELEASE OF SECURITY AGREEMENT;ASSIGNOR:SILICON VALLEY BANK;REEL/FRAME:018207/0475 Effective date: 20060829 |
|
| FEPP | Fee payment procedure |
Free format text: PAT HOLDER NO LONGER CLAIMS SMALL ENTITY STATUS, ENTITY STATUS SET TO UNDISCOUNTED (ORIGINAL EVENT CODE: STOL); ENTITY STATUS OF PATENT OWNER: LARGE ENTITY |
|
| FPAY | Fee payment |
Year of fee payment: 8 |
|
| FPAY | Fee payment |
Year of fee payment: 12 |