US5841523A - Method for performing spectroscopic analysis of inhomogeneous test samples - Google Patents
Method for performing spectroscopic analysis of inhomogeneous test samples Download PDFInfo
- Publication number
- US5841523A US5841523A US08/425,559 US42555995A US5841523A US 5841523 A US5841523 A US 5841523A US 42555995 A US42555995 A US 42555995A US 5841523 A US5841523 A US 5841523A
- Authority
- US
- United States
- Prior art keywords
- measurements
- test sample
- signal
- signal measurements
- sample
- Prior art date
- Legal status (The legal status is an assumption and is not a legal conclusion. Google has not performed a legal analysis and makes no representation as to the accuracy of the status listed.)
- Expired - Lifetime
Links
Images


Classifications
-
- G—PHYSICS
- G01—MEASURING; TESTING
- G01N—INVESTIGATING OR ANALYSING MATERIALS BY DETERMINING THEIR CHEMICAL OR PHYSICAL PROPERTIES
- G01N21/00—Investigating or analysing materials by the use of optical means, i.e. using sub-millimetre waves, infrared, visible or ultraviolet light
- G01N21/17—Systems in which incident light is modified in accordance with the properties of the material investigated
- G01N21/25—Colour; Spectral properties, i.e. comparison of effect of material on the light at two or more different wavelengths or wavelength bands
- G01N21/27—Colour; Spectral properties, i.e. comparison of effect of material on the light at two or more different wavelengths or wavelength bands using photo-electric detection ; circuits for computing concentration
Definitions
- the present invention relates to an improvement for performing spectroscopic analysis of inhomogeneous test samples. More particularly, a plurality of signal measurements are performed on a test sample and analytical results are calculated only from a set of selected signal measurements most suited for giving reliable answers.
- the method of the present invention has particular application to the spectroscopic determination of the concentration of hemoglobin fractions or derivatives.
- Spectroscopic measurement of fluids is a widely used technique for analytical chemistry.
- Apparatus for performing spectroscopic measurements are well-known in the art.
- the analysis of a test sample may be provided by moving the test sample into an optical cell and performing a transmittance, absorbance or reflectance measurement while the sample is stationery.
- a test sample may be flowed through an optical flow cell and a measurement taken while the sample is flowing through the optical cell.
- such measurements are performed on non-scattering, homogeneous samples.
- some samples contain inhomogeneities, such as air bubbles or particles, which make reliable measurements difficult.
- inhomogeneities in some cases, adversely effect signal measurements requiring the sample to be rerun. More significantly, inhomogeneities will also cause subtle errors which may result in providing a test result which, although plausible, is, nevertheless, incorrect.
- an object of the invention is to provide an improved method for performing spectroscopic analysis of inhomogeneous test samples.
- a more specific object of the invention is to provide a method for improving transmittance, absorbance or reflectance measurements by selecting a specific set of signal measurements having low variability relative to the range or group of sample measurements or to a defined threshold to be used for analysis of a test sample.
- Another object of the invention is to measure more accurately the concentration of hemoglobin fractions or derivatives in a blood sample.
- a further object of the invention is to compare and then select one or more sets of signal measurements provided by optical flow cell analysis of test samples to avoid signal measurements affected by test sample inhomogeneities.
- the aforementioned object of the invention is achieved by the provision of a method of analyzing a plurality of optical cell signal measurements on a test sample; selecting from the measurements one or more sets of measurements having both low variability relative to the range or groups of signal measurements or a defined threshold and either signal level maxima or signal level minima; and utilizing the selected set of measurements to analyze the test sample.
- Another object of the invention is to provide an algorithm for use in conjunction with a clinical laboratory instrument which is designed to perform many repetitive tests on unknown samples.
- a series of transmittance, absorbance or reflectance signal measurements of a test sample are analyzed to select one or more sets of signal measurements having both low variability relative to the range or group of measurements or to a defined threshold and one of high or low transmittance, absorbance or reflectance signal levels for analyzing the test sample.
- a further object of the invention is to provide a method for selecting a set of signal measurements from a spectroscopic analysis of a test sample, where homogeneous regions are selected by either using a temporal scan or a spatial scan of the test sample.
- a test sample is flowed through an optical flow cell to perform a series of transmittance measurements, a set of transmittance measurements are selected which have both low variability relative to the range or group of transmittance measurements or to a defined threshold and one of either transmittance maxima or transmittance minima, and then utilizing the mean value of the set of transmittance measurements to analyze the test sample.
- FIG. 1 is a flow chart of the algorithm used in conjunction with spectroscopic analysis of test samples.
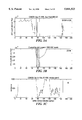
- FIGS. 2A-2C illustrate signal readings for test sample 1595 where:
- FIG. 2A illustrates signals or ADC counts per unit time for an inhomogeneous test sample
- FIG. 2B is an enlargement of the ADC counts per unit time of FIG. 2A showing a selected window having low signal variability
- FIG. 2C illustrates computed variability of the signal levels of the test sample of FIG. 2B and shows a selected window at approximately time unit 97 (x-axis);
- FIGS. 3A-3C illustrate signal readings for test sample 1596 where:
- FIG. 3A illustrates signals or ADC counts per unit time for an inhomogeneous test sample
- FIG. 3B is an enlargement of the ADC counts per unit time of FIG. 3A showing a selected window having low signal variability
- FIG. 3C illustrates computed variability of the signal levels of the test sample of FIG. 3B and shows a selected window at approximately time unit 78 (x-axis);
- FIGS. 4A-4C illustrate signal readings for test sample 1597 where:
- FIG. 4A illustrates signals or ADC counts per unit time for an inhomogeneous test sample
- FIG. 4B is an enlargement of the ADC counts per unit time of FIG. 4A showing a selected window having low signal variability
- FIG. 4C illustrates computed variability of the signal levels of the test sample of FIG. 4B and shows a selected window at approximately time unit 82 (x-axis);
- FIGS. 5A-5C illustrate signal readings for test sample 1598 where:
- FIG. 5A illustrates signals or ADC counts per unit time for an inhomogeneous test sample
- FIG. 5B is an enlargement of the ADC counts per unit time of FIG. 5A showing a selected window having low signal variability
- FIG. 5C illustrates computed variability of the signal levels of the test sample of FIG. 5B and shows a selected window at approximately time unit 84 (x-axis);
- FIGS. 6A-6C illustrate signal readings for test sample 1599 where:
- FIG. 6A illustrates signals or ADC counts per unit time for an inhomogeneous test sample
- FIG. 6B is an enlargement of the ADC counts per unit time emission of FIG. 6A showing a selected window having low signal variability
- FIG. 6C illustrates computed variability of the signal levels of the test sample of FIG. 6B and shows a selected window at approximately time unit 82 (x-axis);
- FIGS. 7A-7C illustrate signal readings for test sample 1600 where:
- FIG. 7A illustrates signals or ADC counts per unit time for an inhomogeneous test sample
- FIG. 7B is an enlargement of the ADC counts per unit time of FIG. 7A showing a selected window having low signal variation
- FIG. 7C illustrates computed variability of the signal levels of the test sample of FIG. 7B and shows a selected window at approximately time unit 83 (x-axis);
- FIGS. 8A-8C illustrate signal readings for test sample 1601 where:
- FIG. 8A illustrates signals or ADC counts per unit time for an inhomogeneous test sample
- FIG. 8B is an enlargement of the ADC counts per unit time of FIG. 8A showing a selected window having low signal variability
- FIG. 8C illustrates computed variability of the signal levels of the test sample of FIG. 8B and shows a selected window at approximately time unit 85 (x-axis);
- FIGS. 9A-9C illustrate signal readings for test sample 1602 where:
- FIG. 9A illustrates signals or ADC counts per unit time for an inhomogeneous test sample
- FIG. 9B is an enlargement of the ADC counts per unit time of FIG. 9A showing a selected window having low signal variability
- FIG. 9C illustrates computed variability of the signal levels of the test sample of FIG. 9B and shows a selected window at approximately time unit 68 (x-axis);
- FIGS. 10A-10C illustrate signal readings for a trailing blank test sample 1603 where:
- FIG. 10A illustrates signals or ADC counts per unit time for a trailing blank sample
- FIG. 10B is an enlargement of the ADC counts per unit time of FIG 10A showing a selected window having low signal variability
- FIG. 10C illustrates computed variability of the signal levels of the test sample of FIG. 10B and shows a selected window at approximately time unit 38 (x-axis);
- FIGS. 11A-11C illustrate signal readings for a leading blank sample 1594 where:
- FIG. 11A illustrates signals or ADC counts per unit time for a leading blank test sample
- FIG. 11B is an enlargement of the ADC counts per unit time of FIG. 11A showing a selected window having low signal variability
- FIG. 11C illustrates computed variability of the signal levels of the test sample of FIG. 11B and shows a selected window at approximately time unit 52 (x-axis);
- FIGS. 12A-12C illustrate signal readings for test sample 2049 where:
- FIG. 12A illustrates signals or ADC counts per unit time for an inhomogeneous test sample
- FIG. 12B is an enlargement of the ADC counts per unit time of FIG. 12A showing a selected window having low signal variability
- FIG. 12C illustrates computed variability of the signal levels of the test sample of FIG. 12B and shows a selected window at approximately time unit 135 (x-axis);
- FIGS. 13A-13C illustrate signal readings for test sample 2050 where:
- FIG. 13A illustrates signals or ADC counts per unit time for an inhomogeneous test sample
- FIG. 13B is an enlargement of the ADC counts per unit time of FIG. 13A showing a selected window having low signal variability
- FIG. 13C illustrates computed variability of the signal levels of the test sample of FIG. 13B and shows a selected window at approximately time unit 163 (x-axis);
- FIGS. 14A-14C illustrate signal readings for test sample 2051 where:
- FIG. 14A illustrates signals or ADC counts per unit time for an inhomogeneous test sample
- FIG. 14B is an enlargement of the ADC counts per unit time of FIG. 14A showing a selected window having low signal variability
- FIG. 14C illustrates computed variability of the signal levels of the test sample of FIG. 14B and shows a selected window at approximately time unit 137 (x-axis);
- FIGS. 15A-15C illustrate signal readings for test sample 2052 where:
- FIG. 15A illustrates signals or ADC counts per unit time for an inhomogeneous test sample
- FIG. 15B is an enlargement of the ADC counts per unit time of FIG. 15A showing a selected window having low signal variability
- FIG. 15C illustrates computed variability of the signal levels of the test sample of FIG. 15B and shows a selected window at approximately time unit 162 (x-axis);
- FIGS. 16A-16C illustrate signal readings for test sample 2053 where:
- FIG. 16A illustrates signals or ADC counts per unit time for an inhomogeneous test sample
- FIG. 16B is an enlargement of the ADC counts per unit time of FIG. 16A showing a selected window having low signal variability
- FIG. 16C illustrates computed variability of the signal levels of the test sample of FIG. 16B and shows a selected window at approximately time unit 169 (x-axis);
- FIGS. 17A-17C illustrate signal readings for test sample 2054 where:
- FIG. 17A illustrates ADC count per unit time for an inhomogeneous test sample
- FIG. 17B is an enlargement of the ADC counts per unit time of FIG. 17A showing a selected window having low signal variability
- FIG. 17C illustrates computed variability of the signal levels of the test sample of FIG. 17B and shows a selected window at approximately time unit 176 (x-axis);
- FIGS. 18A-18C illustrate signal readings for test sample 2055 where:
- FIG. 18A illustrates signals or ADC counts per unit time for an inhomogeneous test sample
- FIG. 18B is an enlargement of the ADC counts per unit time of FIG. 18A showing a selected window having low signal variability
- FIG. 18C illustrates computed variability of the signal levels of the test sample of FIG. 18B and shows a selected window at approximately time unit 165 (x-axis);
- FIGS. 19A-19C illustrate signal readings for test sample 2056 where:
- FIG. 19A illustrates signals or ADC counts per unit time for an inhomogeneous test sample
- FIG. 19B is an enlargement of the ADC counts per unit time of FIG. 19A showing a selected window having low signal variability
- FIG. 19C illustrates computed variability of the signal levels of the test sample of FIG. 19B and shows a selected window at approximately time unit 144 (x-axis);
- FIGS. 20A-20C illustrate signal readings for test sample 2057 where:
- FIG. 20A illustrates signals or ADC counts per unit time for an inhomogeneous test sample
- FIG. 20B is an enlargement of the ADC counts per unit time of FIG. 20A showing a selected window having low signal variability
- FIG. 20C illustrates computed variability of the signal levels of the test sample of FIG. 20B and shows a selected window at approximately time unit 173 (x-axis);
- FIGS. 21A-21C illustrate signal readings for a leading blank test sample 2048 where:
- FIG. 21A illustrates signals or ADC counts per unit time for a leading blank test sample
- FIG. 21B is an enlargement of the ADC counts per unit time of FIG. 21A showing a selected window having low signal variation
- FIG. 21C illustrates computed variability of the signal levels of the test sample of FIG. 21B and shows a selected window at approximately time unit 83 (x-axis);
- FIGS. 22A-22L is the code of a program for use on an analytical instrument for selecting signal measurements according to the algorithm of the present invention
- FIG. 23 is a diagram illustrating absorption spectra of test samples 1595-1602.
- FIG. 24 is a diagram illustrating absorption spectra of test samples 2049-2057.
- An algorithm which, in conjunction with a spectrophotometer, makes possible simple and reliable analysis of inhomogeneous test samples.
- the algorithm teaches (a) finding a Leading Edge of the test sample; (b) collecting all data windows having signal variability below "Thresh 1"; (c) selecting data from one or more data windows satisfying (b) and a signal level criterion (lowest or highest from the set of data windows satisfying "Thresh 1"); (d) alternatively, if no data windows satisfy (b), collecting all data windows from one or more data windows having signal variability below "Thresh 2"; (e) selecting data from one or more data windows satisfying (d) and a signal level criterion (lowest or highest from the set of data windows satisfying "Thresh 2"); (f) alternatively, if no data windows satisfy (d), selecting data from one or more of the lowest variability windows; and (g) if selected data of (f) is greater than "Thresh 3" an error is declared.
- Alternate methods determining variability may be utilized to implement the above algorithm.
- the algorithm is written into a program for use on a computer in communication with or incorporated in a spectrophotometer to provide data analysis of signal measurements.
- the Leading Edge is provided either (a) by setting a threshold at a specified value relative to the signal resulting from a blank sample or (b) setting a specified value as provided by (a) and further setting a signal variability criteria.
- the threshold for the Leading Edge is set at 80% of signal counts as determined by the blank sample.
- Window size is optimally selected to avoid inhomogeneities of the sample while being large enough to provide a good measure of sample variability.
- Sample variability is a function of ADC (Analog to Digital Converter) counts or signals as best reflected by reference to the FIGS.
- the window size is set at eight (8) time units or time ticks, where at each time unit a signal measurement of the sample is performed. Each time unit of the preferred embodiment is equal to 0.1 second and each test sample is analyzed for 10 seconds.
- the time of analysis of a test sample is dependent, in part, on the sample size, the instrument utilized to perform measurements and the stability of the sample for analysis, any of which may vary while still utilizing the algorithm of the present invention.
- instability may be reflected by bubbles in a test sample, a test sample being foamed, severely segmented or being diluted.
- the algorithm provides the capability of selecting from an unsteady sample data for giving a reliable analysis of the sample. It is noted that in the utilization of the algorithm the stability of the signal measurements eventually becomes more important than high or low signal levels, i.e. low or high transmittance, absorbance or reflectance.
- Each variability threshold is empirically set in accordance with the specifications or accuracy of the instrument or device utilized to perform the signal measurements and the window size which, in turn, is a function of the number of signals measured per unit time.
- the thresholds provide the criteria by which signal measurements may be utilized for test sample analysis.
- the values for the thresholds are set to provide a reasonable number of signal measurements for analysis before errors are noted in the results. Errors may be noted mathematically by converting signal measurements to absorbance for a known control and then assessing error. For example, "Threshold 1" may be set whereby at least 50% of the signal measurements can be used for analysis.
- “Threshold 2" may be set whereby at least 80% of the signal measurements can be used for analysis.
- “Threshold 1" was set in the range of 200 to 400 variability units or 25 to 50 times the number of time units in the window.
- “Threshold 2” was set in the range of 400 to 800 variability units or 50 to 100 times the number of time units in the window.
- “Threshold 3” was set at in the range of 800 to 1600 variability units or 100 to 200 times the number of time units in the window. It is noted that where the variability of a sample being analyzed exceeds "Threshold 3", the measuring system will flag an error to the system controller.
- “Threshold 1" is set at 200 variable units; “Threshold 2” is set at 400 variable units; and “Threshold 3” is set at 800 variable units. It is noted that as the thresholds are decreased, a smaller number of signal measurements meet the variability criteria for selection. This means that more signal measurements will be characterized as outliers.
- the thresholds provided in the algorithm also relate to the specifications or reliability of instrument performing the signal measurements. An instrument with higher accuracy will allow a lower "Threshold 3" to be set.
- Data selection for the sample being analyzed first requires that a wavelength of maxium sensitivity be selected, for example, in the case of blood, a wavelength showing high absorbance, i.e. 577 nm.
- the selected wavelength will also be one where inhomogeneities in the sample will have the greatest effect.
- the data set from a 256 channel optical detector spanning wavelengths 520-680 nm is analyzed relative to a wavelength or metric base selected, as noted above, based on maxium sensitivity to test sample inhomogeneities.
- One or more sets of measurement signals is selected according to the criteria defined by the algorithm.
- a single set of measurement signals or window is selected for sample analysis.
- Signal measurements are selected using either a temporal scan or spatial scan of the test sample. Optimally, in the case of a temporal scan of a flowing test sample, a plurality of serial signal measurements are analyzed.
- a data set or window is selected by examining windows having both low variability and either maxium transmittance when the inhomogeneities decrease transmittance or minium transmittance when the inhomogeneities increase transmittance.
- the data from other measured wavelengths from the selected window is utilized for analysis of the test sample by use of appropriate equations as known in the art.
- the wavelengths would be in range 520-680 nm. at which the hemoglobin fractions or derivatives have good absorption. Analysis from alternate wavelengths may be performed according to the analyte or component being evaluated in a test sample or for control purposes.
- the window selected by use of the algorithm is shaded.
- the chief advantage of the present method is that it makes the measurement subsystem of an analytical instrument, particularly a spectrophotometer, much less affected by inhomogeneities, i.e. bubbles or artifacts in the sample than previous systems.
- the entire sample is measured a plurality of times and the test sample analysis is calculated only from a portion of the sample measurements most suitable for giving reliable answers. This means that if there are some bubbles in the sample, the portions of the sample with the bubbles will be avoided and only the best portion of the sample will be used to calculate results.
- the presence of inhomogeneities during the measurement would typically ruin the measurement of the test sample. Even worse, for some types of inhomogeneities, i.e. micro-bubbles, the error can be subtle, giving plausible but incorrect results that cannot be detected.
- the algorithm defined by the present invention, also compensates for dilution in the system by selecting the least-diluted portion of the sample for measurement.
- the algorithm is used in conjunction with an apparatus for spectrophotometrically determining the concentration of hemoglobin fractions or derivatives including tHb (total hemoglobin), O 2 Hb (oxyhemoglobin), HHb (deoxyhemoglobin), MetHb (methemoglobin), and COHb (carboxyhemoglobin).
- the signals generated by the detectors of the spectrophotometer are analyzed using the algorithm of the present invention written in the form of a software program and executed on an appropriate computer, such as a microprocessor.
- a 16-bit analog to digital converter having a measurement range of 100 ADC to 60K ADC counts.
- Signal variability as described herein, is a function of ADC counts.
- the sample window size is also an important variable as a small window size will not allow a true measure of variability. While a smaller window size may be more adept at avoiding an inhomogeneity in the test sample, there is incumbent risk at not providing a true measure of variability of the sample.
- signal selection is used to determine groups or sets of signal measurements which contain only low variability within the group; and the selected groups are used to perform the sample analysis. Optimally, after these groups or sets are selected, the group having the lowest transmittance (or highest transmittance, depending on the inhomogeneity and sample) may also be chosen.
- the window will be selected utilizing maximum transmittance when the inhomogeneity decreases transmittance and, alternatively, choose a window having minimum transmittance when the inhomogeneity causes increased transmittance. For example, bubbles will, in general, increase transmittance in opaque fluids but will decrease transmittance in clear fluids. Particulate matter will typically decrease transmittance.
- test samples 1595-1602.
- test samples 1595-1602.
- Each sample was introduced into a prototype co-oximeter (800 series, Ciba Corning Diagnostics Corp.) for measurement of hemoglobin derivatives or fractions.
- the test sample is hemolyzed prior to entering a fluid flow cell for signal measurements (transmittance).
- Blank samples 1594 and 1603 consisting of an optically clear fluid were also analyzed.
- the signal measurements provided by the lead blank sample, 1594 are utilized in the determination of test sample transmittance.
- Measurement signals for each test sample and blank were made at a series of times, every 0.1 sec. for 10 sec. for a total of 100 measurements or 100 time ticks. The measurements were divided into windows or segments of 8 points or 8 time ticks. The criteria for window size is based on the collection of signals which avoid inhomogeneities in the test sample and the flow rate of the sample past the detector or the portion of measurable sample or passage through the optical flow cell. Signal measurements for test samples 1595-1602 and blanks 1594 and 1603 are provided in FIGS. 2-11, respectively, illustrating ADC counts per time unit for the test samples. The window chosen by the algorithm for the sample or blank is shown in the shaded area of each respective figure. The mean value of the data provided in the window is utilized to calculate the concentration of hemoglobin derivatives or fractions.
- FIG. 2B (immediately before and after the selected window) indicate inhomogeneities present in the test sample as reflected by signal measurement variation.
- FIG. 6B (after the selected window) indicate dilution or microbubble effects present in the test sample.
- FIG. 8B shows a very good sample run, relatively free of inhomogeneities.
- Table I provides the resultant hemoglobin derivative or fraction concentrations for test samples 1595-1602, the variance of each test sample and statistical analysis of the set of data. An analysis of each of FIGS. 3-10 shows that the signal measurements for each test sample were variable, but with proper window selection by the algorithm provided acceptable test results were obtained.
- test samples 2049-2057 A blood sample from a health voluntary donor was divided into nine (9) test samples 2049-2057. Each sample was introduced into a prototype co-oximeter (800 series, Ciba Corning Diagnostics Corp.) for measurement of hemoglobin derivatives or fractions. The test sample is hemolyzed prior to entering a fluid flow cell for signal measurements (transmittance). A lead blank sample, 2048, consisting of an optically clear fluid was also analyzed. The signal measurements provided by the lead blank sample 2048 are utilized in the determination of test sample transmittance.
- co-oximeter 800 series, Ciba Corning Diagnostics Corp.
- Measurement signals for each test sample and blank were made at a series of times, every 0.1 sec. for 10 sec. for a total of 100 measurements or 100 time ticks. The measurements were divided into windows or segments of 8 points or 8 time ticks. The criteria for window size is based on the collection of signals which avoid inhomogeneities in the test sample and the flow rate of the sample past the detector or the portion of measurable sample or passage through the optical flow cell. Signal measurements for each test sample and blank are provided in FIGS. 12-21 illustrating absorption spectra for the test samples. The window chosen by algorithm for the sample or blank is shown in the shaded area of each respective figure. The mean value of the data provided in the window was utilized to calculate the concentration of hemoglobin derivatives or fractions.
- Table II provides the resultant hemoglobin derivative or fraction concentrations for test samples 2049-2057, the variance of each test sample and statistical analysis of the set of data.
- An analysis of each of FIGS. 12-21 shows that the signal measurements for each test sample were variable, but with proper window selection by the algorithm provided acceptable test results were obtained with the exception of sample 2056.
- test sample 2056 it is noted that the signal variance, 872, was large in comparison to the signal variation of test samples 2049-2055 and 2057. This variation would cause the sample to be rejected according to the thresholds set for the algorithm.
Abstract
Description
              TABLE I
______________________________________
Smpl
ID    tHb    HHb    O2Hb  COHb  MetHb fit coef
                                              var
______________________________________
001595
      4.42   -2.25  -0.54 103.24
                                -0.46 7.407e-009
                                              359
001596
      4.47   -2.07  -0.48 102.85
                                -0.30 l.400e-008
                                               44
001597
      4.41   -2.05  -0.45 l02.77
                                -0.27 6.950e-009
                                              121
001598
      4.44   -1.95  -0.42 102.76
                                -0.39 2.642e-009
                                              122
001599
      4.38   -2.04  -0.37 102.97
                                -0.56 6.558e-009
                                              160
001600
      4.43   -1.99  -0.47 102.74
                                -0.28 4.983e-009
                                              318
001601
      4.39   -1.86  -0.28 l02.43
                                -0.28 l.881e-009
                                               63
001602
      4.32   -1.86  -0.24 102.45
                                -0.35 3.366e-009
                                              135
All   4.41   -2.01  -0.41 102.78
                                -0.36
Means:
All   0.05    0.13   0.10  0.26  0.10
STDs:
______________________________________
                                  TABLE II
__________________________________________________________________________
Smpl ID
      tHb HHb O2Hb
                  COHb MetHb
                           fit coef
                                 var
__________________________________________________________________________
002049
      17.97
          -1.00
              -0.49
                  101.55
                       -0.06
                           4.178e-009
                                 435
002050
      18.09
          -1.11
              -0.64
                  101.73
                       0.02
                           6.739e-009
                                 201
002051
      18.03
          -0.94
              -0.31
                  101.21
                       0.03
                           4.891e-009
                                 79
002052
      17.94
          -1.03
              -0.31
                  101.34
                       -0.01
                           2.950e-009
                                 173
002053
      18.07
          -1.07
              -0.45
                  101.42
                       0.11
                           4.845e-009
                                 157
002054
      17.50
          -1.12
              -0.15
                  101.31
                       -0.04
                           4.841e-009
                                 379
002055
      18.16
          -0.99
              -0.25
                  101.18
                       0.06
                           4.394e-009
                                 233
002056
      14.40
          -1.04
              -0.20
                  101.02
                       -0.18
                           6.080e-009
                                 872
002057
      17.97
          -1.07
              -0.21
                  101.22
                       0.07
                           3.559e-009
                                 198
All Means:
      17.5710
          -1.0423
              -0.2884
                  101.3307
                       0.0000
All STDs:
      1.2028
          0.0598
              0.2386
                  0.2129
                       0.0861
Means:
      17.9538
          -1.0413
              -0.3513
                  101.3700
                       0.0225
STDs: 0.2049
          0.0624
              0.1632
                  0.1902
                       0.0575
(Without Sample #2056)
__________________________________________________________________________
Claims (28)
Priority Applications (13)
| Application Number | Priority Date | Filing Date | Title |
|---|---|---|---|
| US08/425,559 US5841523A (en) | 1995-04-20 | 1995-04-20 | Method for performing spectroscopic analysis of inhomogeneous test samples |
| PCT/IB1996/000359 WO1996033400A1 (en) | 1995-04-20 | 1996-04-19 | Method for spectroscopic analysis of inhomogeneous samples |
| PL96322887A PL322887A1 (en) | 1995-04-20 | 1996-04-19 | Method of spectroscopically analysing heterogenous samples |
| BR9608331A BR9608331A (en) | 1995-04-20 | 1996-04-19 | Method for spectroscopic analysis of inhomogeneous sample |
| AT96908316T ATE204079T1 (en) | 1995-04-20 | 1996-04-19 | METHOD FOR THE SPECTRA ANALYSIS OF INHOMOGENEOUS SAMPLES |
| JP8531594A JPH11503832A (en) | 1995-04-20 | 1996-04-19 | Spectroscopic analysis method for heterogeneous samples |
| EP96908316A EP0821785B1 (en) | 1995-04-20 | 1996-04-19 | Method for spectroscopic analysis of inhomogeneous samples |
| CA002218115A CA2218115A1 (en) | 1995-04-20 | 1996-04-19 | Method for spectroscopic analysis of inhomogeneous samples |
| DE69614374T DE69614374T2 (en) | 1995-04-20 | 1996-04-19 | METHOD FOR SPECTRAL ANALYSIS OF INHOMOGENIC SAMPLES |
| ES96908316T ES2162037T3 (en) | 1995-04-20 | 1996-04-19 | PROCEDURE OF SPECTROSCOPIC ANALYSIS OF NON-HOMOGENEAS SAMPLES. |
| DK96908316T DK0821785T3 (en) | 1995-04-20 | 1996-04-19 | Method for spectroscopic analysis of inhomogeneous samples |
| AU51613/96A AU5161396A (en) | 1995-04-20 | 1996-04-19 | Method for spectroscopic analysis of inhomogeneous samples |
| KR1019970707326A KR19990007803A (en) | 1995-04-20 | 1996-04-19 | Spectrophotometric analysis method of heterogeneous sample |
Applications Claiming Priority (1)
| Application Number | Priority Date | Filing Date | Title |
|---|---|---|---|
| US08/425,559 US5841523A (en) | 1995-04-20 | 1995-04-20 | Method for performing spectroscopic analysis of inhomogeneous test samples |
Publications (1)
| Publication Number | Publication Date |
|---|---|
| US5841523A true US5841523A (en) | 1998-11-24 |
Family
ID=23687081
Family Applications (1)
| Application Number | Title | Priority Date | Filing Date |
|---|---|---|---|
| US08/425,559 Expired - Lifetime US5841523A (en) | 1995-04-20 | 1995-04-20 | Method for performing spectroscopic analysis of inhomogeneous test samples |
Country Status (13)
| Country | Link |
|---|---|
| US (1) | US5841523A (en) |
| EP (1) | EP0821785B1 (en) |
| JP (1) | JPH11503832A (en) |
| KR (1) | KR19990007803A (en) |
| AT (1) | ATE204079T1 (en) |
| AU (1) | AU5161396A (en) |
| BR (1) | BR9608331A (en) |
| CA (1) | CA2218115A1 (en) |
| DE (1) | DE69614374T2 (en) |
| DK (1) | DK0821785T3 (en) |
| ES (1) | ES2162037T3 (en) |
| PL (1) | PL322887A1 (en) |
| WO (1) | WO1996033400A1 (en) |
Cited By (4)
| Publication number | Priority date | Publication date | Assignee | Title |
|---|---|---|---|---|
| US6505060B1 (en) * | 2000-09-29 | 2003-01-07 | Datex-Ohmeda, Inc. | Method and apparatus for determining pulse oximetry differential values |
| US6549861B1 (en) | 2000-08-10 | 2003-04-15 | Euro-Celtique, S.A. | Automated system and method for spectroscopic analysis |
| US6675030B2 (en) | 2000-08-21 | 2004-01-06 | Euro-Celtique, S.A. | Near infrared blood glucose monitoring system |
| US7198955B1 (en) * | 1997-03-03 | 2007-04-03 | Nir Diagnostics Inc. | Method and apparatus for measurement of blood substitutes |
Families Citing this family (2)
| Publication number | Priority date | Publication date | Assignee | Title |
|---|---|---|---|---|
| KR100428861B1 (en) * | 2001-06-09 | 2004-04-28 | 주식회사 현대시스콤 | Apparatus for testing of voice service in sub system of base station/control station, its method |
| BRPI0802336A2 (en) * | 2008-04-17 | 2009-12-29 | Gomes Paulo Alberto Paes | process, handheld equipment and device for in vitro photometric determination of hemoglobin concentration in a one-step diluted blood sample |
Citations (12)
| Publication number | Priority date | Publication date | Assignee | Title |
|---|---|---|---|---|
| US3966323A (en) * | 1973-11-21 | 1976-06-29 | Hitachi, Ltd. | Apparatus for producing timing signal for photometric measurement |
| US4627014A (en) * | 1984-04-09 | 1986-12-02 | Eastman Kodak Company | Method and apparatus for determination of an analyte and method of calibrating such apparatus |
| US4885711A (en) * | 1984-03-14 | 1989-12-05 | Neff Dennis B | Data processing |
| US5036857A (en) * | 1989-10-26 | 1991-08-06 | Rutgers, The State University Of New Jersey | Noninvasive diagnostic system for coronary artery disease |
| EP0479569A2 (en) * | 1990-10-04 | 1992-04-08 | Calgon Corporation | Tube clarifier method for monitoring and/or controlling clarification processes |
| US5121337A (en) * | 1990-10-15 | 1992-06-09 | Exxon Research And Engineering Company | Method for correcting spectral data for data due to the spectral measurement process itself and estimating unknown property and/or composition data of a sample using such method |
| US5226417A (en) * | 1991-03-11 | 1993-07-13 | Nellcor, Inc. | Apparatus for the detection of motion transients |
| US5291426A (en) * | 1991-02-27 | 1994-03-01 | The Perkin-Elmer Corporation | Method of correcting spectral data for background |
| US5379238A (en) * | 1989-03-03 | 1995-01-03 | Stark; Edward W. | Signal processing method and apparatus |
| US5396440A (en) * | 1993-01-12 | 1995-03-07 | The Dow Chemical Company | Optimum calibration frequency determination |
| US5428558A (en) * | 1993-12-17 | 1995-06-27 | The Perkin-Elmer Corporation | Correction of spectra for stray radiation |
| US5568400A (en) * | 1989-09-01 | 1996-10-22 | Stark; Edward W. | Multiplicative signal correction method and apparatus |
-
1995
- 1995-04-20 US US08/425,559 patent/US5841523A/en not_active Expired - Lifetime
-
1996
- 1996-04-19 ES ES96908316T patent/ES2162037T3/en not_active Expired - Lifetime
- 1996-04-19 AU AU51613/96A patent/AU5161396A/en not_active Abandoned
- 1996-04-19 PL PL96322887A patent/PL322887A1/en unknown
- 1996-04-19 EP EP96908316A patent/EP0821785B1/en not_active Expired - Lifetime
- 1996-04-19 DK DK96908316T patent/DK0821785T3/en active
- 1996-04-19 WO PCT/IB1996/000359 patent/WO1996033400A1/en not_active Application Discontinuation
- 1996-04-19 AT AT96908316T patent/ATE204079T1/en active
- 1996-04-19 JP JP8531594A patent/JPH11503832A/en not_active Abandoned
- 1996-04-19 CA CA002218115A patent/CA2218115A1/en not_active Abandoned
- 1996-04-19 BR BR9608331A patent/BR9608331A/en unknown
- 1996-04-19 KR KR1019970707326A patent/KR19990007803A/en not_active Application Discontinuation
- 1996-04-19 DE DE69614374T patent/DE69614374T2/en not_active Expired - Lifetime
Patent Citations (12)
| Publication number | Priority date | Publication date | Assignee | Title |
|---|---|---|---|---|
| US3966323A (en) * | 1973-11-21 | 1976-06-29 | Hitachi, Ltd. | Apparatus for producing timing signal for photometric measurement |
| US4885711A (en) * | 1984-03-14 | 1989-12-05 | Neff Dennis B | Data processing |
| US4627014A (en) * | 1984-04-09 | 1986-12-02 | Eastman Kodak Company | Method and apparatus for determination of an analyte and method of calibrating such apparatus |
| US5379238A (en) * | 1989-03-03 | 1995-01-03 | Stark; Edward W. | Signal processing method and apparatus |
| US5568400A (en) * | 1989-09-01 | 1996-10-22 | Stark; Edward W. | Multiplicative signal correction method and apparatus |
| US5036857A (en) * | 1989-10-26 | 1991-08-06 | Rutgers, The State University Of New Jersey | Noninvasive diagnostic system for coronary artery disease |
| EP0479569A2 (en) * | 1990-10-04 | 1992-04-08 | Calgon Corporation | Tube clarifier method for monitoring and/or controlling clarification processes |
| US5121337A (en) * | 1990-10-15 | 1992-06-09 | Exxon Research And Engineering Company | Method for correcting spectral data for data due to the spectral measurement process itself and estimating unknown property and/or composition data of a sample using such method |
| US5291426A (en) * | 1991-02-27 | 1994-03-01 | The Perkin-Elmer Corporation | Method of correcting spectral data for background |
| US5226417A (en) * | 1991-03-11 | 1993-07-13 | Nellcor, Inc. | Apparatus for the detection of motion transients |
| US5396440A (en) * | 1993-01-12 | 1995-03-07 | The Dow Chemical Company | Optimum calibration frequency determination |
| US5428558A (en) * | 1993-12-17 | 1995-06-27 | The Perkin-Elmer Corporation | Correction of spectra for stray radiation |
Cited By (4)
| Publication number | Priority date | Publication date | Assignee | Title |
|---|---|---|---|---|
| US7198955B1 (en) * | 1997-03-03 | 2007-04-03 | Nir Diagnostics Inc. | Method and apparatus for measurement of blood substitutes |
| US6549861B1 (en) | 2000-08-10 | 2003-04-15 | Euro-Celtique, S.A. | Automated system and method for spectroscopic analysis |
| US6675030B2 (en) | 2000-08-21 | 2004-01-06 | Euro-Celtique, S.A. | Near infrared blood glucose monitoring system |
| US6505060B1 (en) * | 2000-09-29 | 2003-01-07 | Datex-Ohmeda, Inc. | Method and apparatus for determining pulse oximetry differential values |
Also Published As
| Publication number | Publication date |
|---|---|
| JPH11503832A (en) | 1999-03-30 |
| DE69614374D1 (en) | 2001-09-13 |
| CA2218115A1 (en) | 1996-10-24 |
| BR9608331A (en) | 1999-02-23 |
| WO1996033400A1 (en) | 1996-10-24 |
| KR19990007803A (en) | 1999-01-25 |
| AU5161396A (en) | 1996-11-07 |
| EP0821785B1 (en) | 2001-08-08 |
| ATE204079T1 (en) | 2001-08-15 |
| EP0821785A1 (en) | 1998-02-04 |
| DE69614374T2 (en) | 2001-11-22 |
| DK0821785T3 (en) | 2001-10-08 |
| ES2162037T3 (en) | 2001-12-16 |
| PL322887A1 (en) | 1998-03-02 |
Similar Documents
| Publication | Publication Date | Title |
|---|---|---|
| EP0419222B1 (en) | Method for the prediction of properties of biological matter by analysis of the near-infrared spectrum thereof | |
| Hall et al. | Near-infrared spectrophotometry: a new dimension in clinical chemistry | |
| DE60031427T2 (en) | METHOD FOR CALIBRATING A SPECTROSCOPY DEVICE | |
| US8472693B2 (en) | Method for determining at least one hemoglobin related parameter of a whole blood sample | |
| US8837803B2 (en) | Method and apparatus for determining mean cell volume of red blood cells | |
| CN109239360B (en) | Reaction curve abnormity detection method and device | |
| Radtke et al. | Hemoglobin screening in prospective blood donors: comparison of different blood samples and different quantitative methods | |
| EP0453036A2 (en) | Analytical instrument and method of calibrating an analytical instrument | |
| US7663738B2 (en) | Method for automatically detecting factors that disturb analysis by a photometer | |
| EP0476192B1 (en) | Characterizing matter of biological origin using near infrared spectroscopy | |
| EP1017993B1 (en) | Spectroscopic analysis of samples with turbidity and high absorbance | |
| JP2008530536A (en) | Method and apparatus for measuring non-invasiveness of specimen | |
| JP2001516019A (en) | Method and apparatus for creating a basis set for use in spectral analysis | |
| CN101044988A (en) | Method and device for automatic distinguishing kidney stone types by computer tomography contrast | |
| Wiener | The effect of haematocrit on reagent strip tests for glucose | |
| US5841523A (en) | Method for performing spectroscopic analysis of inhomogeneous test samples | |
| US5541854A (en) | Method of analyzing multiple range test data | |
| JPS6332132B2 (en) | ||
| CA2514743C (en) | Performance improvement for hematology analysis | |
| WO2007066589A1 (en) | Method and apparatus for examining and diagnosing life style-related disease using near-infrared spectroscopy | |
| JPH0225134B2 (en) | ||
| MXPA97008076A (en) | Method for spectroscopic analysis of inhomogeneous samples | |
| US20230152335A1 (en) | Blood coagulation time measurement method | |
| Hopkins | 14 Derivative Quotient Method Regression, or the Norris Regression | |
| Rowlands et al. | Application of Cusum techniques to the routine monitoring of analytical performance in clinical laboratories |
Legal Events
| Date | Code | Title | Description |
|---|---|---|---|
| AS | Assignment |
Owner name: CIBA CORNING DIAGNOSTICS CORP., MASSACHUSETTS Free format text: ASSIGNMENT OF ASSIGNORS INTEREST;ASSIGNORS:DEGEN, BEAT R.;GARYANTES, MICHAEL F.;REEL/FRAME:008658/0171 Effective date: 19950419 |
|
| STCF | Information on status: patent grant |
Free format text: PATENTED CASE |
|
| FEPP | Fee payment procedure |
Free format text: PAYOR NUMBER ASSIGNED (ORIGINAL EVENT CODE: ASPN); ENTITY STATUS OF PATENT OWNER: LARGE ENTITY |
|
| FPAY | Fee payment |
Year of fee payment: 4 |
|
| REMI | Maintenance fee reminder mailed | ||
| FPAY | Fee payment |
Year of fee payment: 8 |
|
| FEPP | Fee payment procedure |
Free format text: PAYER NUMBER DE-ASSIGNED (ORIGINAL EVENT CODE: RMPN); ENTITY STATUS OF PATENT OWNER: LARGE ENTITY Free format text: PAYOR NUMBER ASSIGNED (ORIGINAL EVENT CODE: ASPN); ENTITY STATUS OF PATENT OWNER: LARGE ENTITY |
|
| FPAY | Fee payment |
Year of fee payment: 12 |
|
| AS | Assignment |
Owner name: BAYER CORPORATION,PENNSYLVANIA Free format text: MERGER;ASSIGNOR:CHIRON DIAGNOSTICS CORPORATION;REEL/FRAME:024626/0992 Effective date: 19990305 Owner name: SIEMENS HEALTHCARE DIAGNOSTICS INC.,NEW YORK Free format text: ASSIGNMENT OF ASSIGNORS INTEREST;ASSIGNOR:BAYER CORPORATION;REEL/FRAME:024630/0014 Effective date: 20070101 |