US5249122A - Method and apparatus for forming images using orthogonal polynomials for temporal deconvolution - Google Patents
Method and apparatus for forming images using orthogonal polynomials for temporal deconvolution Download PDFInfo
- Publication number
- US5249122A US5249122A US07/494,121 US49412190A US5249122A US 5249122 A US5249122 A US 5249122A US 49412190 A US49412190 A US 49412190A US 5249122 A US5249122 A US 5249122A
- Authority
- US
- United States
- Prior art keywords
- images
- product
- functions
- orthonormal functions
- computing
- Prior art date
- Legal status (The legal status is an assumption and is not a legal conclusion. Google has not performed a legal analysis and makes no representation as to the accuracy of the status listed.)
- Expired - Fee Related
Links
Images


Classifications
-
- G—PHYSICS
- G16—INFORMATION AND COMMUNICATION TECHNOLOGY [ICT] SPECIALLY ADAPTED FOR SPECIFIC APPLICATION FIELDS
- G16H—HEALTHCARE INFORMATICS, i.e. INFORMATION AND COMMUNICATION TECHNOLOGY [ICT] SPECIALLY ADAPTED FOR THE HANDLING OR PROCESSING OF MEDICAL OR HEALTHCARE DATA
- G16H50/00—ICT specially adapted for medical diagnosis, medical simulation or medical data mining; ICT specially adapted for detecting, monitoring or modelling epidemics or pandemics
- G16H50/50—ICT specially adapted for medical diagnosis, medical simulation or medical data mining; ICT specially adapted for detecting, monitoring or modelling epidemics or pandemics for simulation or modelling of medical disorders
-
- G—PHYSICS
- G16—INFORMATION AND COMMUNICATION TECHNOLOGY [ICT] SPECIALLY ADAPTED FOR SPECIFIC APPLICATION FIELDS
- G16Z—INFORMATION AND COMMUNICATION TECHNOLOGY [ICT] SPECIALLY ADAPTED FOR SPECIFIC APPLICATION FIELDS, NOT OTHERWISE PROVIDED FOR
- G16Z99/00—Subject matter not provided for in other main groups of this subclass
-
- G—PHYSICS
- G16—INFORMATION AND COMMUNICATION TECHNOLOGY [ICT] SPECIALLY ADAPTED FOR SPECIFIC APPLICATION FIELDS
- G16H—HEALTHCARE INFORMATICS, i.e. INFORMATION AND COMMUNICATION TECHNOLOGY [ICT] SPECIALLY ADAPTED FOR THE HANDLING OR PROCESSING OF MEDICAL OR HEALTHCARE DATA
- G16H30/00—ICT specially adapted for the handling or processing of medical images
- G16H30/20—ICT specially adapted for the handling or processing of medical images for handling medical images, e.g. DICOM, HL7 or PACS
-
- G—PHYSICS
- G16—INFORMATION AND COMMUNICATION TECHNOLOGY [ICT] SPECIALLY ADAPTED FOR SPECIFIC APPLICATION FIELDS
- G16H—HEALTHCARE INFORMATICS, i.e. INFORMATION AND COMMUNICATION TECHNOLOGY [ICT] SPECIALLY ADAPTED FOR THE HANDLING OR PROCESSING OF MEDICAL OR HEALTHCARE DATA
- G16H30/00—ICT specially adapted for the handling or processing of medical images
- G16H30/40—ICT specially adapted for the handling or processing of medical images for processing medical images, e.g. editing
-
- G—PHYSICS
- G16—INFORMATION AND COMMUNICATION TECHNOLOGY [ICT] SPECIALLY ADAPTED FOR SPECIFIC APPLICATION FIELDS
- G16H—HEALTHCARE INFORMATICS, i.e. INFORMATION AND COMMUNICATION TECHNOLOGY [ICT] SPECIALLY ADAPTED FOR THE HANDLING OR PROCESSING OF MEDICAL OR HEALTHCARE DATA
- G16H50/00—ICT specially adapted for medical diagnosis, medical simulation or medical data mining; ICT specially adapted for detecting, monitoring or modelling epidemics or pandemics
- G16H50/20—ICT specially adapted for medical diagnosis, medical simulation or medical data mining; ICT specially adapted for detecting, monitoring or modelling epidemics or pandemics for computer-aided diagnosis, e.g. based on medical expert systems
Definitions
- the invention relates generally to the application of an array processor for the processing of medical (scintigraphic) or other digitized time sequential images requiring deconvolution to extract a final result different and distinct from the original images, but related to information contained in the original images. Also, data having substantial Poisson noise content can be efficiently processed.
- the prior art teaches that extracting information from images by deconvolution is done by the transformation of the desired quantity (or image) by the use of the well known Fourier transform and subsequent arithmetic operations.
- the Fourier transform allows the change of an image from the spatial domain to the frequency domain, while the inverse Fourier allows transformation from the frequency domain back to the spatial domain again.
- the computation of deconvolution with another function also in the same frequency domain requires a simple arithmetic operation, whereas in the spatial domain the deconvolution operation would require multiple steps.
- deconvolution is highly inefficient as compared to deconvolution in the frequency domain, i.e. the same operation can be performed in the frequency domain more efficiently. This is why a tool that allows minimal operations to compute deconvolution is beneficial whenever a large number of images having multiple pixels need to be processed to extract information contained therein.
- the application of the temporal deconvolution method is a method which can be used to isolate the response (blood flow) of a human organ (such as a kidney) from measurements (images) derived from other organs.
- the measurement of parameters (image acquisition) in other places on the body, e.g. the heart, to determine the response of the organ being studied is called the "input function”.
- the input function Upon operation on images making up the input function, by using the tool of temporal deconvolution, or the DOP method, the result is a linear response function (LRF).
- LRF linear response function
- the LRF in this context describes the time activity curve that would result from the time sequence observation of a human organ or portion of an organ (pixel), and can be related to blood flow rates through said organ.
- the LRF thus is extracted from the combination of the input function along with other knowledge of the system and represents the characteristics of the system comprised of the organ under study (e.g. kidney) plus the other parts of the body being monitored (e.g. heart) to determine the operation of the subject organ (e.g. kidney). Accordingly, it is an object of the present invention to disclose a tool in the form of an array processor, or, in the alternative, a method, wherein, multi-pixel images containing digitized information can be deconvolved in conjunction with other information to extract information contained in multiple time related images or similar time sequential data.
- the kinetic information presented in, and obtained from, dynamic scintigraphic images is distorted because radioactive tracer uptake in an organ, such as a kidney, is a complex function dependent on the amount of tracer injected, the temporal course of blood activity, and diffusion and transport processes within the organ under study as well as in other organs. It is therefore an object of the present invention to extract information contained in such images acquired via scintigraphic techniques so as to reduce, or eliminate the interaction in such images of the various mechanisms of blood flow and tracer concentration changes.
- the method and apparatus shown herein will allow the evaluation of the amount of blood flow through the organ being studied free of the distractions and misinformation created by the concurrent interaction of simultaneous physical phenomena present in a normal functioning kidney.
- images computed from data using returns derived from the reflection of sonic waves off various objects contain a high degree of noise and require the step of deconvolution for extraction of useful data, interpretation or final transformation into a human intelligible form. It is an object of the present invention to improve interpretation of such images by providing higher tolerance to the noise contained in such raw sonar data while simultaneously reducing the computation burden required to perform said deconvolution.
- SAR Synthetic Aperture Radar
- time sequential data such as time sequential images, or pulses
- step of deconvolution in the presence of noise for final presentation in human readable form.
- FIG. 1A Time activity curves of the LRF and the blood input function.
- the output function was determined by numerical convolution of the input function with the LRF B-D: show the linear response functions (LRF's) calculated at "no noise" levels with various deconvolution tools so as to compare the results obtained in the prior art with the results obtained by the present method.
- FIG. 2 Linear response functions calculated at a noise level of 1,000 counts.
- A Time activity curves of the LRF, the input function I and organ output function O. Noise was added to the input function I and organ output function O.
- B-D LRF calculated by the DOP method to compare with results obtained in the prior art.
- FIG. 3 Computer simulated curves for the linear response function h, the blood input function I, and the organ output function O. A: no noise added, B: noise added only to the organ output function.
- FIG. 4 Linear response functions calculated by the DOP method. Input and output functions did not contain noise components (FIG. 3A).
- FIGS. 4A, C, E partition blood volume was set to zero.
- the DOP algorithm converged quickly and remained also stable when high numbers of polynomials were used.
- FIGS. B, D, F partition blood volume (or background) c*B(t) was added to the organ output function O(t) before deconvolution.
- the DOP method needed almost 15-20 polynomials to reconstruct the theoretically expected delta-functional partition c* ⁇ (t) in the linear response function and an error free organ linear response function.
- FIG. 5 Linear response functions calculated by the DOP method. Noise was added to the output function (FIG. 3B).
- FIG. A, C, E partition blood volume was set to zero.
- the DOP method needed almost 10 polynomials to reconstruct an oscillating but systematic error free organ linear response function which is superimposed by the theoretically expected delta-functional partition c* ⁇ (t). Increase of the number polynomials distorted both, the organ linear response and the partition blood volume value.
- FIG. 6 Scintigraphic images from a dynamic radioactive iodine tracer study. The gray scale was adjusted in each image to encompass the same range of count rates. The images demonstrate the typical incorporation of the tracer by the thyroid.
- FIG. 7 Time activity curve from a region of interest including the entire thyroid gland. The curve represents the output function A(t) of the thyroid.
- FIG. 8 Depicts a detector curve obtained by placing a scintillation detector over the heart to count the time activity course of the tracer in the blood pool. Blood samples were obtained 3.5, 5, 10 and 20 min after injection, and the activity calculated in 0.5-1 ml plasma. The discrete plasma values were interpolated by an exponential fit, and the plasma value at 5 min was used to normalize the detector curve at this time point. Detector values at times greater than 5 min were then replaced by values obtained from the interpolated plasma curve. This procedure corrected the detector curve for nontarget tissue activity and forms the input function B(t).
- FIG. 9. Depicts images of the LRF function.
- the gray scale was adjusted in each image to encompass a qualitative comparison of the images, which reflect increasing values at the first points, reach a maximum, decrease quickly, and then remain nearly constant (or decrease with a relatively small time constant).
- FIG. 10 shows a time course of the LRF values in the entire thyroid.
- the oscillations were caused by the polynomial approach of the deconvolution technique and are not related to physiological processes.
- FIG. 11 outlines the hardware structure of an array processor working in conjunction with a general purpose host computer wherein the array processor is connected directly onto the data, address and control bus of the host to process the incoming data from the A/D converters efficiently.
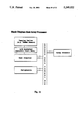
- FIG. 12 details the software operations to be conducted by the array processor and the host processor to extract the information in the digitized images.
- FIG. 13 outlines the flow diagram of the disclosed DOP method as implemented in a general purpose computer, such as the Digital Equipment Corporation VAX 11/750.
- Knop et al. "Deconvolution analysis of 99m Tc-methylene diphosphonate kinetics in metabolic bone disease", Eur. J. Nucl. Med., 6:63-67 (1981). They applied this method to ROI data from patients with metabolic bone diseases to distinguish small differences in the kinetics of different bone tracers.
- Knop et al. "Biokinetics of bone tracers by means of deconvolution analysis-comparison of 99m Tc-MDP, 99m Tc-DPD, 99m Tc-EHDP", Nucl. Med., 21:145-149 (1982).
- the present application solves postulated but unsolved problems related to deconvolution detailed in Stritzke et al., (1985). Unlike Stritzke et al., (1985), where merely a statement of the problem associated with deconvolution was stated, the present application provides a full understanding and complete derivation of the solution to the integral equation of a single pixel time activity curve using orthogonal polynomials. Previously, only approximative solutions, as described in Montz and Stritzke, "Schilddrussenjans-hardance", NucCompact, 13:176-178 (1982), or a brief statement of the problem devoid of the details necessary to implement the solution were presented. Knopp et al., (1981); Knopp et al., (1982); and Stritzke et al., (1985).
- FIG. 1 shows a comparison of the DOP method described herein with the Fourier transform method and the discrete deconvolution method for curves both with and without Poisson noise.
- the organ activity A and activity in the blood B are related to the linear response function LRF (impulse response function) h L of the tissue being imaged by the convolution integral as described in Colin et al., “Etude experimentale du renogramme", Arch. Kreisllauff., 16:289-306 (1965).
- LRF impulse response function
- h is the "true" organ linear response function
- c is the activity within the blood pool of the tissue being imaged
- ⁇ is the Dirac delta function.
- the Dirac delta function in equ.2 represents a singularity, meaning that the linear response function reaches an infinite high function value at time zero.
- Standard deconvolution methods including the DOP method cannot handle singularities like this explicitly. Therefore, it is necessary to develop a form of equ.1 which can be deconvolved without the negative effects associated with this singularity.
- One way to accomplish this is to introduce the accumulative residence time distribution function H L , as described in Bassingthwaighte, "Circulatory transport and the convolution integral", Mayo Clin.
- the DOP method like any deconvolution analysis method, requires that a series of scintigraphic images be obtained concurrently with sampling of venous blood.
- the scintigrams need to be acquired with constant time intervals. If, however, images are not obtained at uniform time intervals, interpolation of data has to be employed. The same process can be applied to the results obtained from the venous blood samples.
- the sign (°) on a symbol indicates that the time sampling is not necessarily uniform.
- venous blood samples B o can be taken at times t i o over the time period T of the study, but more than one sample will improve confidence in the result.
- the units of the samples B o are in activity per unit time measured in a well counter.
- Equ.13 is the final stochastic description of the tracer behavior in an organ and is independent of specific compartmental models. It is temporally deconvoluted to yield the integral of the response function H L . Given H L , h is derived by numerical differentiation.
- H L > is connected to the known (measured) function
- the method of inversion of equ.14 (deconvolution) which is used herein requires the introduction of a set of orthonormal polynomials p k (t), e.g. Legendre Polynomials, as described in Arfken, Mathematical Methods for Physicists, Academic Press, New York and London (1968), calculated from their recurrence relation (Rodrigues' formula):
- the first five functions can be written:
- the p k (t) are orthogonal in the interval 1 ⁇ t ⁇ 1 with the orthogonality-completeness relation ⁇ p m
- p k > are combined with B to produce the adjoint operator
- the coefficients ⁇ mi calculated from equ.23 can be used to construct a second set of functions using the Legendre polynomials calculated in equ.15 ##EQU18## or equivalently ##EQU19## which is also an orthogonal function system.
- d m > are now being used to invert the integral equ.14. For this purpose start with the completeness or closure condition as described in Liboff, Introductory Ouantum Mechanics. Holden-Day, California (1980) ##EQU20## (note that
- steps 1 and 2 no image data is required.
- d m > are only dependent on the input function and the type of polynomials.
- the computation can be performed in the host computer within a few seconds.
- Use of an array processor can speed this phase of the implementation, but this is not the major computational load of the method.
- Steps 3, 4 and 5 require access to the entire image set of 50-150 images.
- the mini-computers typically used in nuclear medicine, it is usually not possible to have all of these images resident in memory at one time.
- To avoid multiple disk transfers of the data set it has been suggested to depict a subset of the image data (e.g. 1/16 of each image) for complete data processing through steps 3-6 which are the number "crunching" intensive portion of the method.
- these have been implemented on an array processor (Analogic, AP 400).
- Time activity curves were computer simulated in order to compare DOP with the Fourier deconvolution, and discrete deconvolution or the matrix method. Let ⁇ t denote the time interval between consecutive time samples, so that the sequence of calculated values is
- N was set to 64.
- the input function B n and the linear response function h were computed as
- the output function A(t n ) was calculated by numerical convolution of B n with h(t n ) (FIG. 1A). Because the Fourier method as well as the discrete deconvolution method do not handle implicitly the presence of blood volume (delta functional partition in the linear response function), the contribution of blood volume (c) in equ.2 was set to zero in all calculations. Consequently, the LRF
- FIG. 1 shows the results of applying the DOP, the Fourier and the discrete deconvolution method in calculating the linear response function from the input and the output curves.
- Deconvolution by the DOP method (FIG. 1B) and the Fourier method (FIG. 1C) reproduced the LRF exactly.
- an oscillating curve which is especially distorted in the first half, was obtained (FIG. 1D).
- count-dependent Poisson noise was added to the data points of the input and output curves before deconvolution (FIGS. 2A, 3A, 4A).
- the input and output curves were scaled to produce count rates of 1000 counts in their peak values.
- FIGS. 3A and B shows the curves for the case of no added Poisson noise and FIG. 3B shows the curves when Poisson noise is added in sets of 50 data points each.
- FIGS. 3A and B shows the curves for the case of no added Poisson noise and FIG. 3B shows the curves when Poisson noise is added in sets of 50 data points each.
- 4A, C, E show the computer simulated LRFs overlaid by the LRFs calculated by the DOP method for the data in FIG. 3A (no-noise).
- the parameter varied was the number of polynomials which ranged from 5 to 20.
- the blood volume partition was set to zero.
- the method of computation converged quickly and there was practically no difference between simulated and calculated LRF.
- the performance of the DOP method changes slightly when a partition blood volume c ⁇ B(t) (blood background) was added to the output function A(t).
- the partition blood volume c(x,y) ⁇ B(t) is the amount of radioactivity contributed by the blood in tissues surrounding the organ or tissue of interest.
- the total activity measured by the gamma camera at the time t in the pixel x,y is A(x,y,t)+c(x,y) ⁇ B(t).
- FIGS. 4B, D, F show the resulting LRFs obtained after having added blood background. Parameter was again the number of polynomials (Z). The DOP method now converged much slower than in the absence of blood background. In order to obtain a perfect reproduction of the calculated LRF, at least 15-20 polynomials were necessary.
- the delta functional partition c ⁇ (t) represented by the dashed area in FIGS. 4B, D, F resulted from the deconvolution process, and did not distort the time course of the LRF.
- the curve in FIG. 4F can be interpreted as the sum of the "true" organ response h(t) and a delta functional partition c ⁇ (t) (see also equ.2).
- the acquisition mode of the dynamic scintigraphic study and the determination of the input function depends on the tracer used and the organ to be investigated. Thus it is described a data acquisition and processing of the input function for the clinical example used in this disclosure.
- the gamma camera was positioned over the thyroid of the patient and images were recorded in 5 sec intervals for 100 sec, 10 sec intervals for 2 min, 20 sec intervals for 1 min, 1 min intervals for 4 min, and 2 min intervals for 18 min. Since simultaneous images of the heart and thyroid could not be recorded with the gamma camera available, an external scintillation detector was placed over the heart of the patient. The counts recorded by the probe were automatically written into one corner of the images. This was accomplished by a electronic switch and buffer system linking the gamma camera and the computer. Each counting event passing by the pulse height analyzer of the probe caused an x,y signal fitting in one of the corners of the gamma camera image.
- the coordinates were shifted sequentially pixel by pixel by step-wise electronic offset addition ⁇ x, ⁇ y to the x and y position.
- the size of the total area thus casing the detector's events was a 8 ⁇ 8 matrix.
- blood samples were drawn at 5, 10 and 20 min after injection.
- the scintigraphic study was then interpolated, and the input function generated by drawing a region of interest over the 8 ⁇ 8 matrix.
- the input function recorded over the heart region mainly reflect the tracer's time course in the blood. Since 123 I is diffusible, the curve included activity which had accumulated in extra cardiac tissue.
- the recorded curve from the cardiac region of interest was normalized with the 6 min plasma value.
- the heart curve for times greater than 6 minutes was replaced by an exponential fit of the plasma values through 5, 10, 20 minutes.
- the linear response function (LRF) was calculated in each pixel as a function of time using calibration factors of the gamma camera F G and the well counter F W that were determined prior to patient study according the procedure described in the following section.
- the gamma camera was calibrated by use of phantoms of the approximate shape of the organ being studied (thyroid phantom, Alderson liver and kidney phantom). These were filled with a known activity of the radionuclide used in the study, and placed in a scattering medium approximating the size and shape of the region of a patient being imaged at the approximate depths of the organ in this region.
- the calibration factor F G (MBq*min/counts) was calculated by drawing a region of interest around the organ and dividing the known activity (MBq) by the corresponding count-rate (counts/min).
- the well counter was calibrated by counting a known activity in 1-2 ml solution and calculating the factor F W (MBq*min/counts).
- FIG. 6 typical images from a dynamic 123 I thyroid study as described above are shown.
- the grey scale has been adjusted in each image to encompass exactly the same range of count rates, so that visual comparison of these images with the results from the deconvolution process can easily be made.
- FIG. 7 the time activity curve from a region of interest (ROI) drawn over the entire thyroid is shown. This curve portrays the accumulation of the tracer into the thyroid. It should be noted that parameters like peak value, height, or slope of this curve are functions of at least two organs (the thyroid, and the kidneys) which clear the iodine from the blood with comparable rates.
- the activity in the patient's blood was monitored simultaneously with the acquisition of the scintigraphic data by the method described above.
- the upper curve in FIG. 8 served as a first order approximation of the input function. This curve was then corrected and normalized by plasma samples taken during the scintigraphic acquisition (see FIG. 8 lower curve).
- FIG. 9 images of the LRF calculated from the organ and blood activity (input-output events) are shown.
- the 8 images are a subset of the total of 50 images produced and represent the first 6 minutes of the tracer kinetics.
- the grey scale has been adjusted in each image here as before.
- the LRF images show the response to a delta functional input of the tracer into the blood and, because no recirculation of the tracer in the blood is allowed, the dependence of the LRF on the kidneys or other organs was thus eliminated. This can be visualized by looking at the LRF images (FIG. 9) and at the time course of the LRF values in the entire thyroid (FIG. 10).
- the image and curve values commence with low values, rapidly reach a maximum, followed by a rapid and then a slower oscillating decline.
- This initial response leading to the peak value represents the rapid transfer of the tracer from the blood compartment to both thyroid and non-thyroid tissue spaces.
- the rapid decline from the peak is due to a rapid reflow of the tracer from the extracellular space into the blood.
- the LRF declines more slowly, at rate a.
- This part of the LRF can be approximated by a monoexponential function A ⁇ e -a ⁇ t where A represents the injected activity remaining in the thyroid most of which is trapped and organified (clearance).
- A was determined in each pixel x,y and presented the Iodine plasma clearance A(x,y) in a functional image.
- DOP deconvolution methods with orthogonal polynomials
- the DOP method described is best used with an array processor.
- the method has been divided into a preprocess step and the actual time consuming estimation of the LRF in each pixel.
- the preprocess step can be performed in the host computer and needs numerical values of a well defined input function. See FIG. 13 for the typical flow diagram of a program used to extract features from images of size 64 by 64 using a general purpose host computer, such as Digital Equipment's Corporation VAX 11/750.
- an array processor can be interfaced to the data/address/control bus of a general purpose host to perform those matrix computations for which the host is not optimized for.
- a hardware configuration for such a host/array processor combination is shown in FIG. 11, wherein the image is digitized by the analog to digital converter(s) and subsequently stored in the host's memory. Now the array processor has access to the data as well as the precomputed two dimensional matrixes c z and d z as outlined in equations 15 to 23, and 34.
- the host general purpose computer in accordance with FIG. 12 showing the software flow in a host/array processor combination then performs the computation of orthogonal functions of the degree Z, the estimation of an adjoint operator, and an orthonormalization process.
- This preprocess results in two Z*U matrices, where U is the number of the images and Z the degree or number of the polynomials used.
- the matrix values do not depend on any measurements of the organ data. Although the rest of the process needs only the operations of multiplication and summation of the image data with the matrices determined from the preprocess, it is time consuming and therefore assigned to the array processor for processing.
- the method can be performed in blocks of values.
- the computation is straight forward and does not need any a priori information in terms of shape and periodicity of the scintigraphic data.
- the LRF images were calculated using typically 15 Legendre polynomials and the scintigraphic images interpolated into 50 images.
- the computation time on a PDP-11/23 without hardware floating point arithmetic was about 3 hours.
- Kaplan et al. (1969) observed that the presence of even minor errors in the measured data result in large perturbations in the solution (ill-conditioned nature of the matrix approach). Kaplan et al., "The inverse problem of radioisotope diagnosis: A computational method for determining the location and size of tumors", Math. Biosc., 5:39-55 (1969). Diffey et al. (1976) proposed data bounding to contain noise components which exceed certain limits. Diffey et al. (1976). This is an iterative process reducing the adverse impact of noise. This kind of noise reduction, or simple smoothing techniques, may help. Nonetheless, it must be emphasized that the simple discrete deconvolution method is inherently inaccurate.
- Fleming and Goddard (1974) introduced a deconvolution technique for the renogram in which the Laplace Transform of the input function plays a role.
- Fleming and Goddard "A technique for the deconvolution of the renogram", Phys. Med. Biol., 19:546-549 (1974). This means that a mathematical expression must be found which is not too complicated for the required operations and is a good approximation of the input function.
- Stekelenburg et al. (1978) and (1976) and Kenney (1975) suggested a two or three exponential approximation of the input function.
- Kenney “Deconvolution analysis of the scintillation camera renogram", Br. J. Radiol., 48:481-486 (1975).
- Partition blood volume can be assumed to be zero when non-diffusible tracers are being used, like 99m Tc-labeled blood cells which do not leave the blood pool during the time of investigation. Then the integral term in equ.39, specifically the linear response function, describes flow and dispersion through the target organ.
Abstract
The present invention disclose a tool in the form of an array processor, or, in the alternative, a method, wherein, multi-pixel images containing digitized information can be deconvolved in conjunction with other information to extract information contained in multiple time related images or similar time sequential data.
Description
1. Technical Field
The invention relates generally to the application of an array processor for the processing of medical (scintigraphic) or other digitized time sequential images requiring deconvolution to extract a final result different and distinct from the original images, but related to information contained in the original images. Also, data having substantial Poisson noise content can be efficiently processed.
2. Background Art
The prior art teaches that extracting information from images by deconvolution is done by the transformation of the desired quantity (or image) by the use of the well known Fourier transform and subsequent arithmetic operations. The Fourier transform allows the change of an image from the spatial domain to the frequency domain, while the inverse Fourier allows transformation from the frequency domain back to the spatial domain again. In the frequency domain, the computation of deconvolution with another function also in the same frequency domain requires a simple arithmetic operation, whereas in the spatial domain the deconvolution operation would require multiple steps. Because of the added required steps in the spatial domain, deconvolution is highly inefficient as compared to deconvolution in the frequency domain, i.e. the same operation can be performed in the frequency domain more efficiently. This is why a tool that allows minimal operations to compute deconvolution is beneficial whenever a large number of images having multiple pixels need to be processed to extract information contained therein.
Furthermore, some images contain high amounts of noise that may render some Fourier based and other deconvolution methods ineffective. The present application describes a method that is highly tolerant of noise contained in images to be deconvolved.
Accordingly, in the medical context, the application of the temporal deconvolution method (DOP), described in this disclosure, is a method which can be used to isolate the response (blood flow) of a human organ (such as a kidney) from measurements (images) derived from other organs. The measurement of parameters (image acquisition) in other places on the body, e.g. the heart, to determine the response of the organ being studied is called the "input function". Upon operation on images making up the input function, by using the tool of temporal deconvolution, or the DOP method, the result is a linear response function (LRF). The LRF in this context describes the time activity curve that would result from the time sequence observation of a human organ or portion of an organ (pixel), and can be related to blood flow rates through said organ. The LRF thus is extracted from the combination of the input function along with other knowledge of the system and represents the characteristics of the system comprised of the organ under study (e.g. kidney) plus the other parts of the body being monitored (e.g. heart) to determine the operation of the subject organ (e.g. kidney). Accordingly, it is an object of the present invention to disclose a tool in the form of an array processor, or, in the alternative, a method, wherein, multi-pixel images containing digitized information can be deconvolved in conjunction with other information to extract information contained in multiple time related images or similar time sequential data.
For example, continuing in the medical field, specifically in the area of scintigraphic images, the kinetic information presented in, and obtained from, dynamic scintigraphic images is distorted because radioactive tracer uptake in an organ, such as a kidney, is a complex function dependent on the amount of tracer injected, the temporal course of blood activity, and diffusion and transport processes within the organ under study as well as in other organs. It is therefore an object of the present invention to extract information contained in such images acquired via scintigraphic techniques so as to reduce, or eliminate the interaction in such images of the various mechanisms of blood flow and tracer concentration changes. The method and apparatus shown herein will allow the evaluation of the amount of blood flow through the organ being studied free of the distractions and misinformation created by the concurrent interaction of simultaneous physical phenomena present in a normal functioning kidney.
As another example of the application of this invention, in the sonar field, images computed from data using returns derived from the reflection of sonic waves off various objects contain a high degree of noise and require the step of deconvolution for extraction of useful data, interpretation or final transformation into a human intelligible form. It is an object of the present invention to improve interpretation of such images by providing higher tolerance to the noise contained in such raw sonar data while simultaneously reducing the computation burden required to perform said deconvolution.
It is yet another object of the present invention to apply the teachings of the present invention to the field of radar where the interpretation of, for example, Synthetic Aperture Radar (SAR) images requires the deconvolution of image data polluted by data acquisition noise inherent in the processing of low signal to noise ratio radar returns. In this context, it is an object of present the invention to reduce effects created by the change in radar crossection of the target, scintillation, receiver noise, analog to digital converter noise etc. as well as reduce the computational load typically required for the deconvolution of such images.
It is yet another objective of the present invention to improve the interpretation of seismic data images used in oil exploration by providing computational means for reducing the effect of noise on said images and reduce the time required to compute the images generated from seismic, or other shock wave energy reflections or returns.
Generally, it is an object of this invention to improve the interpretation of information contained in time sequential data, such as time sequential images, or pulses, requiring the step of deconvolution in the presence of noise for final presentation in human readable form.
FIG. 1A. Time activity curves of the LRF and the blood input function. The output function was determined by numerical convolution of the input function with the LRF B-D: show the linear response functions (LRF's) calculated at "no noise" levels with various deconvolution tools so as to compare the results obtained in the prior art with the results obtained by the present method.
FIG. 2. Linear response functions calculated at a noise level of 1,000 counts. A: Time activity curves of the LRF, the input function I and organ output function O. Noise was added to the input function I and organ output function O. B-D: LRF calculated by the DOP method to compare with results obtained in the prior art.
FIG. 3. Computer simulated curves for the linear response function h, the blood input function I, and the organ output function O. A: no noise added, B: noise added only to the organ output function.
FIG. 4. Linear response functions calculated by the DOP method. Input and output functions did not contain noise components (FIG. 3A). Left side of FIGS. 4A, C, E: partition blood volume was set to zero. The parameter p=5,10,20 denotes the number of polynomials used. The DOP algorithm converged quickly and remained also stable when high numbers of polynomials were used. Right side of FIGS. B, D, F: partition blood volume (or background) c*B(t) was added to the organ output function O(t) before deconvolution. The new organ output function was calculated by O'(t)=O(t)+0.5*B(t). The DOP method needed almost 15-20 polynomials to reconstruct the theoretically expected delta-functional partition c*δ(t) in the linear response function and an error free organ linear response function.
FIG. 5. Linear response functions calculated by the DOP method. Noise was added to the output function (FIG. 3B). Left side of FIG. A, C, E: partition blood volume was set to zero. The parameter p=5,10,20 denotes the number of polynomials used. There is an "optimal" number of polynomials (typically Z=15) which reconstructs an oscillating but systematic error free LRF. Higher numbers of polynomials increase the amplitudes of inherent oscillations. Right side of FIGS. B, D, F: partition blood volume (or background) c*B(t) was added to the organ output function O(t) before deconvolution. The new organ output function was calculated by O'(t)=O(t)+0.5*B(t). The DOP method needed almost 10 polynomials to reconstruct an oscillating but systematic error free organ linear response function which is superimposed by the theoretically expected delta-functional partition c*δ(t). Increase of the number polynomials distorted both, the organ linear response and the partition blood volume value.
FIG. 6. Scintigraphic images from a dynamic radioactive iodine tracer study. The gray scale was adjusted in each image to encompass the same range of count rates. The images demonstrate the typical incorporation of the tracer by the thyroid.
FIG. 7. Time activity curve from a region of interest including the entire thyroid gland. The curve represents the output function A(t) of the thyroid.
FIG. 8. Depicts a detector curve obtained by placing a scintillation detector over the heart to count the time activity course of the tracer in the blood pool. Blood samples were obtained 3.5, 5, 10 and 20 min after injection, and the activity calculated in 0.5-1 ml plasma. The discrete plasma values were interpolated by an exponential fit, and the plasma value at 5 min was used to normalize the detector curve at this time point. Detector values at times greater than 5 min were then replaced by values obtained from the interpolated plasma curve. This procedure corrected the detector curve for nontarget tissue activity and forms the input function B(t).
FIG. 9. Depicts images of the LRF function. The gray scale was adjusted in each image to encompass a qualitative comparison of the images, which reflect increasing values at the first points, reach a maximum, decrease quickly, and then remain nearly constant (or decrease with a relatively small time constant).
FIG. 10 shows a time course of the LRF values in the entire thyroid. The oscillations were caused by the polynomial approach of the deconvolution technique and are not related to physiological processes.
FIG. 11 outlines the hardware structure of an array processor working in conjunction with a general purpose host computer wherein the array processor is connected directly onto the data, address and control bus of the host to process the incoming data from the A/D converters efficiently.
FIG. 12 details the software operations to be conducted by the array processor and the host processor to extract the information in the digitized images.
FIG. 13 outlines the flow diagram of the disclosed DOP method as implemented in a general purpose computer, such as the Digital Equipment Corporation VAX 11/750.
I. Historical perspective
Because the application of the present invention is multifaceted, its details will be discussed with respect to the medical subject of scintigraphic images of human organs.
A number of different deconvolution techniques have proven useful for obtaining LRF's from clinical studies. Van Stekelenburg, "Hippuran transit times: A new approach", Phys. Med. Biol., 23:291-301 (1978); Van Stekelenburg et al., N. A. Kooman, "A Three-compartment model for the transport and distribution of hippuran", Phys. Med. Biol., 21:74-84 (1976); Diffey et al., "The 99m Tc DTPA dynamic renal scan with deconvolution analysis", J. Nucl. Med., 17:352-355 (1976); Alderson et al., "Deconvolution analysis in radionuclide quantitation of left to right cardiac shunts", J. Nucl. Med., 20:502-506 (1979); and Kuruc et al., "An improved deconvolution technique for improvement after suboptimal bolus injection", Radiol., 148:233-238 (1983). A recent article has reviewed these techniques, and described the methodological problems connected with the determination of the LRF. Szabo et al., "Model identification and estimation of organ-function parameters using radioactive tracers and the impulse-response function", Eur. J. Nucl. Med., 11:265-274 (1985). Because of the problem of noise in the data, most mathematical methods for temporal deconvolution have been successfully employed only with time activity curves from regions of interests (ROI) over whole or large portions of an organ. Knop et al. (1981) applied an analysis method using orthogonal polynomials. Knop et al., "Deconvolution analysis of 99m Tc-methylene diphosphonate kinetics in metabolic bone disease", Eur. J. Nucl. Med., 6:63-67 (1981). They applied this method to ROI data from patients with metabolic bone diseases to distinguish small differences in the kinetics of different bone tracers. Knop et al., "Biokinetics of bone tracers by means of deconvolution analysis-comparison of 99m Tc-MDP, 99m Tc-DPD, 99m Tc-EHDP", Nucl. Med., 21:145-149 (1982).
Unlike Stritzke et al., (1985), the present formulation of the DOP method described in this application does not require any specific model in terms of a deterministic description (or compartmental modeling) of the tracer kinetics. Stritzke et al., ("Funktionsszintigraphie: Eine einheitliche Methode zur Quantifizierung von Stoffwechsel und Funktion in Organen", Nucl. Med., 24:211-221 (1985). Furthermore, the present method can account for the contribution of the blood pool itself to the time activity curves obtained from clinical studies. The DOP technique described herein thus provides an alternative to the standard compartmental approach of analyzing dynamic scintigraphic data.
The present application solves postulated but unsolved problems related to deconvolution detailed in Stritzke et al., (1985). Unlike Stritzke et al., (1985), where merely a statement of the problem associated with deconvolution was stated, the present application provides a full understanding and complete derivation of the solution to the integral equation of a single pixel time activity curve using orthogonal polynomials. Previously, only approximative solutions, as described in Montz and Stritzke, "Schilddrussen Funktions-bilder der 123-Jodid Clearance", NucCompact, 13:176-178 (1982), or a brief statement of the problem devoid of the details necessary to implement the solution were presented. Knopp et al., (1981); Knopp et al., (1982); and Stritzke et al., (1985).
It is the aim of this application to describe the method employed for full temporal deconvolution as well as the computation of results using an array processor. Array processors are widely available in nuclear medicine clinics for other "number-crunching" tasks. Their availability makes feasible the use of full temporal deconvolution on a pixel by pixel basis for image processing. FIG. 1 shows a comparison of the DOP method described herein with the Fourier transform method and the discrete deconvolution method for curves both with and without Poisson noise.
II. Theory
Assuming linearity and time invariance, as described in Meier and Zierler, "On the theory of the indicator-dilution method for measurement of blood flow and volume", J. Appl. Physiol., 6:731-744 (1954) and Zierler, "Theoretical basis of indicator dilution methods for measuring flow and volume", Circ. Res., 10:393-407 (1962), the organ activity A and activity in the blood B are related to the linear response function LRF (impulse response function) hL of the tissue being imaged by the convolution integral as described in Colin et al., "Etude experimentale du renogramme", Arch. Kreisllauff., 16:289-306 (1965). ##EQU1## It is assumed that A,B and hL are differentiable functions over the time period of the study T, with the exception that hL has a delta function partition which reflects the activity within the blood volume imaged as part of the pixel x,y. Thus, the linear response function (LRF) in equ.1 is given by Stritzke et al., (1985):
h.sub.L (x,y,t)=h(x,y,t)+c(x,y,)·δ(t) (2)
where h is the "true" organ linear response function, c is the activity within the blood pool of the tissue being imaged, and δ is the Dirac delta function. The Dirac delta function in equ.2 represents a singularity, meaning that the linear response function reaches an infinite high function value at time zero. Standard deconvolution methods including the DOP method cannot handle singularities like this explicitly. Therefore, it is necessary to develop a form of equ.1 which can be deconvolved without the negative effects associated with this singularity. One way to accomplish this is to introduce the accumulative residence time distribution function HL, as described in Bassingthwaighte, "Circulatory transport and the convolution integral", Mayo Clin. Proc., 42:137-154 (1967), which is defined as: ##EQU2## Substituting equ.2 into equ.3, one obtains: ##EQU3## where it is observed that the delta function δ has been integrated out. Now define the integral of the activity I as: ##EQU4## Using equ.1 and equ.3, equ.5 can be rewritten as: ##EQU5##
The DOP method, like any deconvolution analysis method, requires that a series of scintigraphic images be obtained concurrently with sampling of venous blood. The scintigrams need to be acquired with constant time intervals. If, however, images are not obtained at uniform time intervals, interpolation of data has to be employed. The same process can be applied to the results obtained from the venous blood samples.
In this disclosure, the sign (°) on a symbol indicates that the time sampling is not necessarily uniform. The dynamic study may consist of N images. For a given set of time points 0≦ti o ≦t2 o . . . ≦tp-1 o ≦tp o . . . ≦tN o =T, the sampling of the scintigraphic images is defined as: ##EQU6## where A is the activity in terms of counts per unit time in pixel x,y as determined by the gamma camera at time tp o post-injection. Any number of venous blood samples Bo can be taken at times ti o over the time period T of the study, but more than one sample will improve confidence in the result. The units of the samples Bo are in activity per unit time measured in a well counter.
With discrete sampling, the equation giving the integral of the activity (equ.6) can be written as: ##EQU7## where So is the pixel count in the scintigram as defined in equ.7. The expansion of Io and Bo using orthogonal polynomials which is used to deconvolve equ.6 requires equal time sampling. If necessary, linear interpolation is used to convert Io and Bo to I and B sampled over U time points tn defined as
t.sub.n =(n-1) ·Δt, n=1,2, . . ., U (9)
with Δt=T/(U-1) and U·t≦T. The linear interpolation of the sampled integral images Io into the uniformly time sampled integral images I can be conducted in the following way. First, a set of interpolation coefficients are calculated for each time point tn with t1 ≦t2 . . . ≦tn ≦T:
α.sub.n =(t.sub.n.sup.o -t.sub.n)·D.sub.n.sup.o
β.sub.n =1+t.sub.n ·D.sub.n.sup.o -t.sub.n.sup.o ·D.sub.n.sup.o (10)
where: ##EQU8##
This is performed in the host computer. Then, the interpolation of the integral images is performed in the array processor as
I(x,y,t.sub.n)=Εn·I.sup.o (x,y,t.sub.N.sup.o)β.sub.n ·I.sup.o (x,y,t.sub.n.sup.o). (12)
Using linear interpolation or cubic spline interpolation, as described in Spath, Spline-Algorithmen zur Konstruktion glatter Kurven und Flachen. R. Oldenburg Verlag Munchen, Wien (1978) and Press et al., Numerical Recipes, The Art of Scientific Computing, Cambridge University Press, Cambridge, N.Y. (1986), for the input function Bo, and replacing the integral with its approximation by a Riemann sum, equ.6 can be written as: ##EQU9## Equ.13 is the final stochastic description of the tracer behavior in an organ and is independent of specific compartmental models. It is temporally deconvoluted to yield the integral of the response function HL. Given HL, h is derived by numerical differentiation.
With the assumption of square integrability of the functions HL, B and I in the time interval 0 ≦t ≦T during the investigation, equ.13 can be written in the Dirac notation
|I>=|B|H.sub.L >. (14)
The desired function |HL > is connected to the known (measured) function |I> by the operator |B|. The method of inversion of equ.14 (deconvolution) which is used herein requires the introduction of a set of orthonormal polynomials pk (t), e.g. Legendre Polynomials, as described in Arfken, Mathematical Methods for Physicists, Academic Press, New York and London (1968), calculated from their recurrence relation (Rodrigues' formula):
(k+1)·p.sub.k+1 +k·p.sub.k-1 =(2·k+1)·t·p.sub.k |t|≦1 (15a)
The pk (t) are normalized by setting pk (1)=1. In particular the first five functions can be written:
p.sub.0 (t)=1
p.sub.1 (t)=t
p.sub.2 (t)=(3·t.sup.2 -1)/2
p.sub.3 (t)=(5·t.sup.3 -3·t)/2
p.sub.4 (t)=(35·t.sup.4 -30·t.sup.2 +3)/8
p.sub.5 (t)=(63·t.sup.5 -70·t.sup.3 +15·t))/8 (15b)
The pk (t) are orthogonal in the interval 1≦t≦1 with the orthogonality-completeness relation <pm |pn >=δmn ·2/(2n+1), where δmn is called the Kronecker delta and is defined by δmn =0 for n≠m, δmn =1 for n=m. The polynomials |pk > are combined with B to produce the adjoint operator |B|+ according to equ.A.8,
|b.sub.k >=|B|.sup.+ p.sub.k >, k=0,1,2, . . . , Z. (16a)
In approximating the integral in equ.16 by a Riemann sum, |bk > can be written ##EQU10## where n=1,2, . . . , U corresponds to the time points tn (the time points including Δt are transformed into the interval [-1,1]) of the interpolated scintigraphic study). The |bk > are linearly independent but not necessarily orthogonal. From a set of linearly independent functions such as |bk > an orthonormal set of function |cm > over [-1,1] can be constructed by simple linear combination of the |bk >, such that <ci |cj >=δij, i,j= 0,1,2, . . . , Z. In order to calculate the coefficients of the new linear combination |ck >, the classical Gram-Schmidt method, as described in Zurmuh, Praktische Mathematik fur Ingenieure und Physiker. Springer, Berlin, N.Y. (1965) and Delves and Mohamed, Computational Methods for Integral Equations, Cambridge University Press, Cambridge, London, N.Y. (1985), was modified by starting with the following set of equations: ##EQU11## The coefficients ami, m=2 . . . Z, i=1 . . . m-1 can be calculated by forming suitable scalar products <ci, |cj > from each line in equ.17. Forming the scalar product <b1 |c2 > in equ.17b yields
<b.sub.1 |c.sub.2 >=0=a.sub.21 ·<b.sub.1 |c.sub.1 >+<b.sub.1 |b.sub.2 >
a.sub.21 =-<b.sub.1 |b.sub.2 > (18b)
and forming the scalar products <c1 |c3 > and <c2 |C3 > in equ.17c yields
<c.sub.1 |c.sub.3 >=0=a.sub.31 ·<c.sub.1 |c.sub.1 >+a.sub.32 ·<b.sub.1 |c.sub.2 >+<c.sub.1 |b.sub.3 >
<c.sub.2 |c.sub.3 >=0 =a.sub.31 ·<c.sub.2 |c.sub.1 >+a.sub.32 ·b.sub.2 |c.sub.2 >+<c.sub.2 |b.sub.3 >
a.sub.31 =-<b.sub.1 |b.sub.3 > (18c)
a.sub.32 =-<b.sub.2 |b.sub.3 >
For equ.17d one obtains ##EQU12## and generally:
a(m,j)=-<c.sub.j |b.sub.m >, m=1 . . . Z, j=1 . . . m-1. (18e)
In order to form an orthonormal set of functions |cm >, the ami (equ.18e) must be divided by their norm factors. With these factors a new set of coefficients is calculated by ##EQU13## where ∥b1 ∥=<b1 |b1 > denotes the norm. ##EQU14## Hence, the set of equ.17 can now be rewritten: ##EQU15## This function set can easily be rearranged to ##EQU16## where the τmi are given by: ##EQU17## It should be noted that an orthogonal function system, if multiplied by an arbitrary constant k≠ 0, remains an orthogonal function system. Thus, the coefficients τmi calculated from equ.23 can be used to construct a second set of functions using the Legendre polynomials calculated in equ.15 ##EQU18## or equivalently ##EQU19## which is also an orthogonal function system. The |cm > and |dm > are now being used to invert the integral equ.14. For this purpose start with the completeness or closure condition as described in Liboff, Introductory Ouantum Mechanics. Holden-Day, California (1980) ##EQU20## (note that |cm ><cm | is an operator). Now it can be written |HL > as the identity ##EQU21## With insertion of equ.22 into equ.26, it is found ##EQU22## With equ.16 follows ##EQU23## and using equ.24 and equ.14 the final result is ##EQU24## The expression for accumulative residence time distribution function |HL > can be written for computer implementation in the final form ##EQU25## The LRF can be calculated by numerical differentiation of equ.24 ##EQU26## using following five point formula as described in Hildebrand, Introduction to Numerical Analysis, McGraw-Hill, New York (1974) ##EQU27## According to the definitions given in equ.3 and equ.4 the partition blood volume can be determined by
c(x,y)=H(x,y,t=0) (32)
III. Implementation
Computer implementation of the DOP method is carried out by the following step-by-step procedure.
1. Calculate the functions |Cm > according to equ.15-23 where the |cm > represent a Z·U matrix, Z denotes the number of polynomials, and U the number of images: ##EQU28##
2. Calculate the orthogonal set of functions |dm > according to equ.24 with ##EQU29##
3. If the scintigraphic images are not recorded at uniform time intervals, integrate and interpolate the scintigrams according to equ.8-2.
4. Calculate a new set of values |fm > representing the second sum term in equ.29: ##EQU30##
5. Calculate equ.29 in the form: ##EQU31##
6. Finally calculate the linear response function h by numerical differentiation according to equ.31.
In steps 1 and 2, no image data is required. The elements of |cm > and |dm > are only dependent on the input function and the type of polynomials. The computation can be performed in the host computer within a few seconds. Use of an array processor can speed this phase of the implementation, but this is not the major computational load of the method. Steps 3, 4 and 5 require access to the entire image set of 50-150 images. In the mini-computers, typically used in nuclear medicine, it is usually not possible to have all of these images resident in memory at one time. To avoid multiple disk transfers of the data set, it has been suggested to depict a subset of the image data (e.g. 1/16 of each image) for complete data processing through steps 3-6 which are the number "crunching" intensive portion of the method. To test out the concept of the invention, these have been implemented on an array processor (Analogic, AP 400).
IV. Results
Time activity curves were computer simulated in order to compare DOP with the Fourier deconvolution, and discrete deconvolution or the matrix method. Let Δt denote the time interval between consecutive time samples, so that the sequence of calculated values is
B.sub.n =B(n·Δt), n=0,1,2,3, . . . , N
h.sub.n =h(n·Δt)=h(t) (37)
For simplicity, N was set to 64. The input function Bn and the linear response function h were computed as
B.sub.n =t.sub.n ·a·exp(-b·t.sub.n) with a=10.0, b=0.25 (arbitrarily)
h(t.sub.n)=c·exp(-d·t.sub.n) with c=0.25, d=0.1 (38)
The output function A(tn) was calculated by numerical convolution of Bn with h(tn) (FIG. 1A). Because the Fourier method as well as the discrete deconvolution method do not handle implicitly the presence of blood volume (delta functional partition in the linear response function), the contribution of blood volume (c) in equ.2 was set to zero in all calculations. Consequently, the LRF |h> can be calculated immediately by retaining the output function |A> instead of calculating its integral |I>.
FIG. 1 shows the results of applying the DOP, the Fourier and the discrete deconvolution method in calculating the linear response function from the input and the output curves. Deconvolution by the DOP method (FIG. 1B) and the Fourier method (FIG. 1C) reproduced the LRF exactly. When the LRF was derived with the discrete deconvolution method, an oscillating curve, which is especially distorted in the first half, was obtained (FIG. 1D). To compare the effect of noise on each of these methods, count-dependent Poisson noise was added to the data points of the input and output curves before deconvolution (FIGS. 2A, 3A, 4A). The input and output curves were scaled to produce count rates of 1000 counts in their peak values. For each data point, a random number generator was used to select a value from a Poisson distribution having a mean value equal to the original value stored in each data point. Lo, Ph.D. Thesis, University of Southern California (1979). These curves were then deconvolved by different deconvolution methods (FIGS. 2-4, B-D). The LRF calculated with the DOP method performed much better at all noise levels than the LRFs calculated with Fourier- and discrete-deconvoluton methods. It is significant that very small amounts of noise at 50,000 counts distorted the LRFs calculated by the Fourier method. In general, the DOP mechanism was superior to the other methods in that it demonstrated the smallest systematic and statistical errors over the range of noise levels tested.
The calculation of the LRF (or its integral) according to equ.30 requires the finite summation m=1 . . . Z of orthogonal functions |dm > and |cm >. The number of polynomial (Z) used determines the performance of the resulting LRF. This approach is analogous to the problem of Fourier analysis of multi-gated cardiac studies. The question is how many Fourier harmonics are needed to fit the time activity curve and yet smooth noise. Bacharach et al. (1985), "Optimum Fourier filtering of cardiac data: a minimum-error method", J. Nucl. Med., 24:1176-1184 (1983). King et al. proposed a nonstationary temporal Wiener filter to produce an "optimal" suppression of noise in pixel time activity curves. King and Miller, "Use of nonstationary temporal Wiener filter in nuclear medicine", Eur. J. Nucl. Med., 10:458-461 (1985). In order to investigate a similar "multi-harmonic" effect with the DOP method, a computer-simulated blood input and organ output curves as well as the organ linear response functions using the same parameters as given in equ.38. were computed. FIGS. 3A and B shows the curves for the case of no added Poisson noise and FIG. 3B shows the curves when Poisson noise is added in sets of 50 data points each. FIGS. 4A, C, E show the computer simulated LRFs overlaid by the LRFs calculated by the DOP method for the data in FIG. 3A (no-noise). The parameter varied was the number of polynomials which ranged from 5 to 20. In all three calculations the blood volume partition was set to zero. The method of computation converged quickly and there was practically no difference between simulated and calculated LRF. In the absence of noise, the quality of the calculated LRF is independent of the degree of polynomials (Z=5-20). The performance of the DOP method changes slightly when a partition blood volume c·B(t) (blood background) was added to the output function A(t). The partition blood volume c(x,y)·B(t) is the amount of radioactivity contributed by the blood in tissues surrounding the organ or tissue of interest. The total activity measured by the gamma camera at the time t in the pixel x,y is A(x,y,t)+c(x,y)·B(t). When in vivo measurements are made, c must be 0<c<1. To demonstrate the impact of this contribution, we discussed the extreme situations, c=0, which means that there is no contribution from extraneous tissue activity, and c=0.5, which we think is, from the biologic point of view, the worst case situation or nearly so.
FIGS. 4B, D, F show the resulting LRFs obtained after having added blood background. Parameter was again the number of polynomials (Z). The DOP method now converged much slower than in the absence of blood background. In order to obtain a perfect reproduction of the calculated LRF, at least 15-20 polynomials were necessary. It should be noted that the delta functional partition c·δ(t) represented by the dashed area in FIGS. 4B, D, F resulted from the deconvolution process, and did not distort the time course of the LRF. The curve in FIG. 4F can be interpreted as the sum of the "true" organ response h(t) and a delta functional partition c·δ(t) (see also equ.2).
The rapid convergence of the DOP method is distorted by the presence of noise in the data. FIG. 5 shows the LRFs calculated from the blood input curve and the organ output curve seen in FIG. 3B. Noise was added only to the organ curve. Comparing the LRFs in FIGS. 5A, C, E with those in FIGS. 4A, C, E demonstrates that the presence of noise dramatically alters the convergence characteristics of the DOP method. Low numbers of polynomials (Z=5) produce systematic errors in the first half of the LRF (FIG. 5A). High numbers of polynomials (Z=20) amplify inherent oscillations in the LRF dramatically. In between these extremes an "optimal" number of polynomials can be determined which leads to a still oscillating but systematic error-free LRF (FIG. 5C). The presence of blood volume (blood background) does not change this behavior essentially as can be seen from FIGS. 5B, D, E. There is also an "optimal" number of polynomials which permits a systematic error free LRF. But in the presence of noise, it might be cumbersome to mathematically separate components of the "true" response from a possibly underlying blood background activity. Therefore, in all clinical studies, which are always contaminated with noise, it has been recommended to eliminate the delta functional partition of the LRF by integration of the organ output function followed by differentiation of the integral of the linear response function.
The acquisition mode of the dynamic scintigraphic study and the determination of the input function depends on the tracer used and the organ to be investigated. Thus it is described a data acquisition and processing of the input function for the clinical example used in this disclosure.
The gamma camera was positioned over the thyroid of the patient and images were recorded in 5 sec intervals for 100 sec, 10 sec intervals for 2 min, 20 sec intervals for 1 min, 1 min intervals for 4 min, and 2 min intervals for 18 min. Since simultaneous images of the heart and thyroid could not be recorded with the gamma camera available, an external scintillation detector was placed over the heart of the patient. The counts recorded by the probe were automatically written into one corner of the images. This was accomplished by a electronic switch and buffer system linking the gamma camera and the computer. Each counting event passing by the pulse height analyzer of the probe caused an x,y signal fitting in one of the corners of the gamma camera image. In order to prevent counting overflow, the coordinates were shifted sequentially pixel by pixel by step-wise electronic offset addition Δx, Δy to the x and y position. The size of the total area thus casing the detector's events was a 8×8 matrix. Simultaneously with acquisition, blood samples were drawn at 5, 10 and 20 min after injection. The scintigraphic study was then interpolated, and the input function generated by drawing a region of interest over the 8×8 matrix. The input function recorded over the heart region mainly reflect the tracer's time course in the blood. Since 123 I is diffusible, the curve included activity which had accumulated in extra cardiac tissue. In order to overcome the problem of processing such a compound curve, the recorded curve from the cardiac region of interest was normalized with the 6 min plasma value. In a second step, the heart curve for times greater than 6 minutes was replaced by an exponential fit of the plasma values through 5, 10, 20 minutes. With the "corrected input" curve and the scintigraphic images, the linear response function (LRF) was calculated in each pixel as a function of time using calibration factors of the gamma camera FG and the well counter FW that were determined prior to patient study according the procedure described in the following section.
In many of our applications the gamma camera was calibrated by use of phantoms of the approximate shape of the organ being studied (thyroid phantom, Alderson liver and kidney phantom). These were filled with a known activity of the radionuclide used in the study, and placed in a scattering medium approximating the size and shape of the region of a patient being imaged at the approximate depths of the organ in this region. The calibration factor FG (MBq*min/counts) was calculated by drawing a region of interest around the organ and dividing the known activity (MBq) by the corresponding count-rate (counts/min). The well counter was calibrated by counting a known activity in 1-2 ml solution and calculating the factor FW (MBq*min/counts). The calibration of the gamma camera is only an approximation for any given patient when organ size and depths vary from that of those used to measure FG. Methods have been developed for generating buildup factors to generate attenuation corrected images for use in absolute volume and activity measurements. Wu et al., "Tc-99m HIDA dosimetry in patients with various hepatic disorders", J. Nucl. Med., 25:905- 912 (1984); Siegel et al., "The buildup factor: Effect of scatter on absolute volume determination", J. Nucl. Med., 26:390-394 (1985); and Keller et al., "Direct determination of the attenuation coefficient for radionuclide volume. measurements", J. Nucl. Med., 28:102-107 (1987).
In FIG. 6 typical images from a dynamic 123 I thyroid study as described above are shown. The grey scale has been adjusted in each image to encompass exactly the same range of count rates, so that visual comparison of these images with the results from the deconvolution process can easily be made. In FIG. 7, the time activity curve from a region of interest (ROI) drawn over the entire thyroid is shown. This curve portrays the accumulation of the tracer into the thyroid. It should be noted that parameters like peak value, height, or slope of this curve are functions of at least two organs (the thyroid, and the kidneys) which clear the iodine from the blood with comparable rates. The activity in the patient's blood was monitored simultaneously with the acquisition of the scintigraphic data by the method described above. The upper curve in FIG. 8 served as a first order approximation of the input function. This curve was then corrected and normalized by plasma samples taken during the scintigraphic acquisition (see FIG. 8 lower curve).
In FIG. 9, images of the LRF calculated from the organ and blood activity (input-output events) are shown. The 8 images are a subset of the total of 50 images produced and represent the first 6 minutes of the tracer kinetics. In order to compare the kinetic behavior of the LRF with the scintigraphic data, the grey scale has been adjusted in each image here as before. The LRF images show the response to a delta functional input of the tracer into the blood and, because no recirculation of the tracer in the blood is allowed, the dependence of the LRF on the kidneys or other organs was thus eliminated. This can be visualized by looking at the LRF images (FIG. 9) and at the time course of the LRF values in the entire thyroid (FIG. 10). The image and curve values commence with low values, rapidly reach a maximum, followed by a rapid and then a slower oscillating decline. This initial response leading to the peak value represents the rapid transfer of the tracer from the blood compartment to both thyroid and non-thyroid tissue spaces. The rapid decline from the peak is due to a rapid reflow of the tracer from the extracellular space into the blood. Thereafter, the LRF declines more slowly, at rate a. This part of the LRF can be approximated by a monoexponential function A·e-a·t where A represents the injected activity remaining in the thyroid most of which is trapped and organified (clearance). A was determined in each pixel x,y and presented the Iodine plasma clearance A(x,y) in a functional image. Montz and Stritzke (1982). The example demonstrated herein is physiologically abnormal because some of the trapped 123 I is being released rather than being retained and organified. If all of the trapped 123 I is retained, the rate constant would be zero and the LRF would show a constant plateau for 0≦t≦T, where t denotes the time, and T=25 min the duration of the study. We have not studied this process for longer than 25 minutes.
VI. Hardware Implementation
It has been shown here that the approach based on deconvolution methods with orthogonal polynomials (DOP) leads to an estimation of the linear response function contained within the time sequence of the same, single pixel in the associated images. The DOP method described is best used with an array processor. The method has been divided into a preprocess step and the actual time consuming estimation of the LRF in each pixel. The preprocess step can be performed in the host computer and needs numerical values of a well defined input function. See FIG. 13 for the typical flow diagram of a program used to extract features from images of size 64 by 64 using a general purpose host computer, such as Digital Equipment's Corporation VAX 11/750. Conversely, for more efficient operation and reduced computation time, an array processor can be interfaced to the data/address/control bus of a general purpose host to perform those matrix computations for which the host is not optimized for. A hardware configuration for such a host/array processor combination is shown in FIG. 11, wherein the image is digitized by the analog to digital converter(s) and subsequently stored in the host's memory. Now the array processor has access to the data as well as the precomputed two dimensional matrixes cz and dz as outlined in equations 15 to 23, and 34.
The host general purpose computer in accordance with FIG. 12 showing the software flow in a host/array processor combination then performs the computation of orthogonal functions of the degree Z, the estimation of an adjoint operator, and an orthonormalization process. This preprocess results in two Z*U matrices, where U is the number of the images and Z the degree or number of the polynomials used. The matrix values do not depend on any measurements of the organ data. Although the rest of the process needs only the operations of multiplication and summation of the image data with the matrices determined from the preprocess, it is time consuming and therefore assigned to the array processor for processing. For the computers usually available in nuclear medicine, the method can be performed in blocks of values. This is usually the preferred method because of limitations of the host's and array processor's memory. This causes some inefficiencies in terms of full computation speed of the array processor, but avoids multiple disk to memory transfers of the scintigraphic data. The computation is straight forward and does not need any a priori information in terms of shape and periodicity of the scintigraphic data. The LRF images were calculated using typically 15 Legendre polynomials and the scintigraphic images interpolated into 50 images. The computation time on a PDP-11/23 without hardware floating point arithmetic was about 3 hours. This time decreased to 45 minutes using a PDP-11/34 with floating point arithmetic and cache memory, and was further dramatically decreased by the implementation of the DOP method on a PDP-11/34 with floating point arithmetic, cache memory, and array processor. With the latter configuration, the computation intensive part of the method was reduced to 3 minutes for the full computation of the LRF in floating point format. The time to compute a LRF in 120 images (64×64 matrix size) on a VAX-11/750 with hardware floating point and 8MB of memory was 10-20 minutes depending on the clinical load on the computer.
Comparing the DOP method with the Fourier transform and discrete deconvolution methods, the most widely used tools in the literature for deconvolution purposes. Diffey et al. (1976); Alderson et al. (1979); Kuruc et al. (1983); Knesaurek and Spaventi, "Comparison of three deconvolution techniques in renography", Eur. J. Nucl. Med, 9:254-256 (1984); Jacquez, Compartmental analysis in biology and medicine, Elsevier Publishing Co, NY. (1972); Gremmel et al., "Auswertung von Isotopennephrogrammen durch die Entfaltungsmethode", Nucl. Med., 18:46-51 (1979); Valentinuzzi, "Discrete deconvolution", Med. Biol. Eng., 13:123-125 (1975); and Ham et al., "Radionuclide quantitation of left-to-right cardiac shunts using deconvolution analysis: Concise communication", J. Nucl. Med., 22:688-692 (1981). The results demonstrate that the DOP method is superior to these other methods, particularly when data are contaminated with noise. The difficulty in applying the technique of dividing Fourier transforms or discrete deconvolution is that the methods per se do not acknowledge the existence of noise in the data. Diffey et al. (1976); Hunt, " The inverse problem of radiography", Mathem. Biosc., 8:161-179 (1970). Kaplan et al. (1969) observed that the presence of even minor errors in the measured data result in large perturbations in the solution (ill-conditioned nature of the matrix approach). Kaplan et al., "The inverse problem of radioisotope diagnosis: A computational method for determining the location and size of tumors", Math. Biosc., 5:39-55 (1969). Diffey et al. (1976) proposed data bounding to contain noise components which exceed certain limits. Diffey et al. (1976). This is an iterative process reducing the adverse impact of noise. This kind of noise reduction, or simple smoothing techniques, may help. Nonetheless, it must be emphasized that the simple discrete deconvolution method is inherently inaccurate. One reason that the DOP method handles presence of noise very well may be explained by analyzing equ.30. Every value of the LRF (or its integral) in time calculated in a particular pixel is (among other terms) proportional to a sum term which represents the integral over all organ output data in time and in this particular pixel. Consequently, the statistical quality of the LRF at time tn is not only dependent on the statistical quality of the measured organ output function at tn, but rather on the total count rates accumulated during the entire study.
Many methods have been investigated which seek to achieve other satisfactory solutions by the incorporation of a priori knowledge of the organ. These are expressed in mathematical form as a set of constraints, such as a combination of smoothness, monotonicity or non-negativity or total linear least squares (TLLS). Kuruc et al., "An improved deconvolution technique for the calculation of renal retention functions", Comp. Biom. Res., 15:46-56 (1982); and Van Huffel et al., "Reliable and efficient deconvolution technique based on total linear least squares for calculating the renal retention function", Med. & Biol. Eng. & Comp., 25:26-33 (1987). In general, incorporation of constraints leads to either an iterative or a regularized matrix technique. Hunt (1970); Kuruc et al. (1982); Van Huffel et al. (1987); Phillips, "A technique for the numerical solution of certain integral equations of the first kind", J. Assoc. Comput. Mach., 9:84-97 (1962); and Twomey, "The application of numerical filtering to the solution of integral equations encountered in indirect sensing measurements", J. Franklin Inst., 279:95-109 (1965). The calculation of the regularization parameters is either relatively time consuming or must be estimated empirically from simulation studies. The constraints applied are supposed to vary with the system studied and there is probably no optimal deconvolution applicable to the solution of every problem. Nimmon et al., "Practical application of deconvolution techniques to dynamic studies", In: Medical Radionuclide Imaging, IAEA, Wien 367-388 (1981).
Fleming and Goddard (1974) introduced a deconvolution technique for the renogram in which the Laplace Transform of the input function plays a role. Fleming and Goddard, "A technique for the deconvolution of the renogram", Phys. Med. Biol., 19:546-549 (1974). This means that a mathematical expression must be found which is not too complicated for the required operations and is a good approximation of the input function. Stekelenburg et al. (1978) and (1976) and Kenney (1975) suggested a two or three exponential approximation of the input function. Kenney, "Deconvolution analysis of the scintillation camera renogram", Br. J. Radiol., 48:481-486 (1975).
The choice of number of polynomials used is a consideration which still remains to be settled. A criterion which provides the right or optimal number of polynomials is certainly dependent on the type of study and the noise levels. This application does not attempt to fully evaluate this criterion. However, computer simulations show that, in the case of input-output events containing no noise components, DOP needs not more than 5 polynomials in order to calculate a systematic error-free LRF for the one case tested. With data containing noise components, there was noted an "optimal" number of polynomials which did minimize the amplitudes of inherent oscillations. This parameter has been determined experimentally when used in clinical studies. In studies like the 99m Tc-MDP bone, or 123 I thyroid, or 99m Tc-HIDA hepatobliary scans, 15 polynomials fit the LRF without evidence of oscillations or oversmoothing the LRF. It has been shown, as described in Stritzke et al., "Performance of quantitative functional imaging using optimal two-dimensional restoration and temporal deconvolution of dynamic scintigraphic studies", Comp. Ass. Radiol. (CAR), Berlin (1987), that application of two-dimensional count and image dependent restoration filters significantly improved the quality of functional images derived from the LRF calculated according to the method described. King et al., "Digital restoration of Indium-111 and Iodine-123 SPECT images with optimized Metz filters", J. Nucl. Med., 27:1327-1336 (1986). Thus, in filtered 131 I-hippuran studies 20 polynomials resulted in optimal fits.
The problem of how to handle contributions of blood-background or more accurate partition blood volume (see equ.2) measured simultaneously with the target organ activity in a deconvolution process has not been satisfactory addressed as yet in the literature. Chackett (1978) showed that Steckelenburg's (1978) and (1976) compartment analysis of the renogram can be modified to take into account the fact that the measured output function often includes a contribution directly from the input function. Chackett, "The application of transform methods to hippuran renograms", Phys. Med. Biol., 23:1199-1202 (1978). In the renogram case this comes about because the gamma camera placed over the kidneys inevitably measures extra-renal plasma activity. Chackett assumed, as in this disclosure, that this additional activity bears a constant proportionality to B(t). It was shown, as described in Stritzke et al., (1985), that a constant partition of the blood (or plasma) activity simultaneously measured with the target organ activity generally leads to a delta functional partition or singularity of the linear response function. This principally happens when diffusible tracers are being used and monitored by a single detector or gamma camera systems which are not able to distinguish regional blood and organ activity. With equ.1 and equ.2 one can write the relationship between measured activity, partition blood volume and blood input function as: ##EQU32## where the first term represents partition blood volume and the integral term the transfer of the tracer from blood to and through the cells of the target organ. Partition blood volume can be assumed to be zero when non-diffusible tracers are being used, like 99m Tc-labeled blood cells which do not leave the blood pool during the time of investigation. Then the integral term in equ.39, specifically the linear response function, describes flow and dispersion through the target organ.
It has been showed how to handle the sometimes inevitable singularity δ(t) in the linear response function. When diffusible tracers are being used, it might be recommended to apply the "integral" technique by using equ.14 in order to eliminate δ(t). Sometimes it is more convenient to apply the equation |A>=|B'H> (instead of equ.14) where B'(t) is given simply by the first derivative of the blood input function B(t). Thus the organ function |A> needs not be integrated (which often saves computing time). If the user is assured that partition blood volume might not have a significant contribution to the organ linear response function, equ.14 can be replaced by |A>=|B|h>. The deconvolution process then returns the linear response function instead of its integral. This approach has been applied to measure blood flow and volume in a mechanical circulation phantom and in animals using technetium pertechnetate and technetium labeled red blood cells, respectively. Stritzke et al., "Non invasive assessment of absolute renal blood flow (RBF) by temporal deconvolution using orthogonal polynomials", J. Nucl. Med., 29:862-863 (1988).
From the above description of the invention it is apparent that there is provided a method as well as an apparatus having particular advantages before listed as desirable, but which can be clearly susceptible to simple modifications in form, proportion, number of parts and function without departing from the principle involved or sacrificing any of its advantages.
In order to comply with the language of the statutes the invention has been described in language specific to one area, that of scintigraphic imaging. It is to be understood that the invention is no limited to the specific features shown, but that the means comprised herein and disclosed are applicable to other fields, not limited to the ones enumerated before, namely seismic, radar etc.
The invention is therefore claimed in any of its forms or modifications within the legitimate and valid scope of the appended claims. ##SPC1##
Claims (6)
1. An apparatus for the extraction of blood flow rate in an internal organ of a human body by analysis of a time sequence of scintigraphic images taken from the internal organ comprising:
means for digitizing scinitgraphic data, whose amplitude represents the time sequence of activity of a radioactive tracer in the internal organ;
means for storing and retrieving a first plurality of orthonormal functions cz ;
means for storing and retrieving a second plurality of orthonormal functions dz having the same number of elements as function cz ;
means for calculating a set of values fz from the product of the elements of dz and the amplitude value of each pixel of each of said images; and
means for calculating said blood flow rate from the sum of the products of each individual element of cz and fz.
2. A method of extracting information about blood flow rate in an internal organ from a sequence of digitized scintigraphic images comprising the steps of:
injecting a radioactive tracer into the blood stream;
monitoring scintigraphic activity at an area of interest;
digitizing said scintigraphic activity, whose amplitude represents the time sequence of concentration of said tracer in the blood stream at said area of interest to form a time sequence of images;
identifying a first plurality of orthonormal functions cz having a number of elements equal to the product of the number of images times the number of orthonormal polynomials used within said cz functions
applying a second plurality of orthonormal functions dz having the same number of elements as said function cz to calculate a set of values fz from the product of the elements of dz and the amplitude value of each pixel of each of said images; and
calculating said blood flow rate from the sum of the products of each individual element of cz and fz.
3. An apparatus for extraction of features of a portion of space by analyzing a time sequence of RADAR system acquired impages, comprising:
means for digitizing RADAR system acquired data in the form of images, said images having pixels whose amplitudes represent the amount of microwave energy returned from the portion of space;
means for computing a first plurality of orthonormal functions, each of said first orthonormal functions having a plurality of first elements, said functions derived from known characterisitcis of said RADAR system;
means for computing a second plurality of orthonormal functions, each of said second orthonormal functions having a plurality of second elements;
means for computing a first product for each pixel element contained in said sequence of images, said first product being computed from each second element of said second plurality of orthonormal functions and pixels from said images; and
means for computing a sum of a second product, said second product computed from each first element of said first orthonormal functions and each element of said first product.
4. A method for the extraction of features contained within a time sequence of RADAR system acquired images, comprising:
digitizing RADAR system acquired data in the form of images, said images having pixels whose amplitudes represent the amount of microwave energy returned from a portion of space;
computing a first plurality of orthonormal functions, each of said first orthonormal functions having a plurality of first elements, said functions derived from known characteristics of said RADAR system;
computing a second plurality of orthonormal functions, each of said second orthonormal functions having a plurality of second elements;
computing a first product for each pixel element contained in said sequence of images, said first product computed from each second element of said second orthonormal functions and pixels from said images;
computing a sum of a second product, said second product computed from each first element of said first orthonormal functions and each element of said first product.
5. An apparatus for the extraction of geophysical details about a selected area by analyzing a time sequence of seismic images comprising:
means for collecting and digitizing seismic data in the form of seismic images, said seismic images having pixels whose amplitudes represent the amount of shock energy returned from the selected area;
means for computing a first plurality of orthonormal functions, each of said first orthonormal functions having a plurality of first elements, said functions being related to the known transfer function of said means for collecting seismic data;
means for computing a second plurality of orthonormal functions, each of said second orthonormal functions having a plurality of second elements;
means for computing a first product for each pixel element contained in said sequence of images, said first product being computed from each second element of said second plurality of orthonormal functions and pixels from said images; and
means for computing a sum of a second product, said second product computed from each first element of said first orthonormal functions and each element of said first product.
6. A method for the extraction of geophysical details contained within a time sequence of seismic images acquired with a means for collecting seismic data, comprising:
collecting and digitizing seismic data in the form of images, said images having pixels whose amplitudes represent the amount of shock energy returned from an area to be surveyed;
computing a first plurality of orthonormal functions, each of said first orthonormal functions having a plurality of first elements, said first orthonormal functions being related to the known transfer function of said means for collecting seismic data;
computing a second plurality of orthonormal functions, each of said second functions having a pluurality of second elements;
computing a first product for each pixel element contained in said sequence of images, said first product computed from each second element of said second orthonormal functions and pixels from said images;
computing a sum of a second product, said second product computed from each first element of said first orthonormal functions and each element of said first product.
Priority Applications (8)
| Application Number | Priority Date | Filing Date | Title |
|---|---|---|---|
| US07/494,121 US5249122A (en) | 1990-03-15 | 1990-03-15 | Method and apparatus for forming images using orthogonal polynomials for temporal deconvolution |
| US07/498,820 US5287273A (en) | 1990-03-15 | 1990-03-23 | Functional organ images |
| EP91907229A EP0524217A4 (en) | 1990-03-15 | 1991-03-15 | Functional organ images |
| AU76967/91A AU7696791A (en) | 1990-03-15 | 1991-03-15 | A method and apparatus for forming images using orthogonal polynomials for temporal deconvolution |
| PCT/US1991/001764 WO1991014233A1 (en) | 1990-03-15 | 1991-03-15 | A method and apparatus for forming images using orthogonal polynomials for temporal deconvolution |
| EP91907818A EP0520038A4 (en) | 1990-03-15 | 1991-03-15 | A method and apparatus for forming images using orthogonal polynomials for temporal deconvolution |
| AU75486/91A AU7548691A (en) | 1990-03-15 | 1991-03-15 | Functional organ images |
| PCT/US1991/001762 WO1991014232A1 (en) | 1990-03-15 | 1991-03-15 | Functional organ images |
Applications Claiming Priority (1)
| Application Number | Priority Date | Filing Date | Title |
|---|---|---|---|
| US07/494,121 US5249122A (en) | 1990-03-15 | 1990-03-15 | Method and apparatus for forming images using orthogonal polynomials for temporal deconvolution |
Related Child Applications (1)
| Application Number | Title | Priority Date | Filing Date |
|---|---|---|---|
| US07/498,820 Continuation-In-Part US5287273A (en) | 1990-03-15 | 1990-03-23 | Functional organ images |
Publications (1)
| Publication Number | Publication Date |
|---|---|
| US5249122A true US5249122A (en) | 1993-09-28 |
Family
ID=23963132
Family Applications (1)
| Application Number | Title | Priority Date | Filing Date |
|---|---|---|---|
| US07/494,121 Expired - Fee Related US5249122A (en) | 1990-03-15 | 1990-03-15 | Method and apparatus for forming images using orthogonal polynomials for temporal deconvolution |
Country Status (4)
| Country | Link |
|---|---|
| US (1) | US5249122A (en) |
| EP (1) | EP0520038A4 (en) |
| AU (1) | AU7696791A (en) |
| WO (1) | WO1991014233A1 (en) |
Cited By (30)
| Publication number | Priority date | Publication date | Assignee | Title |
|---|---|---|---|---|
| US5761346A (en) * | 1994-11-10 | 1998-06-02 | University Of Kentucky Research Foundation | Method of discrete orthogonal basis restoration |
| WO2000060520A1 (en) * | 1999-03-30 | 2000-10-12 | Koninklijke Philips Electronics N.V. | Deriving time-averaged moments |
| US20060030773A1 (en) * | 1994-09-21 | 2006-02-09 | Uber Arthur E Iii | Data communication and control for medical imaging systems |
| US20070213662A1 (en) * | 2004-11-24 | 2007-09-13 | Medrad, Inc. | System And Apparatus For Modeling Pressures Generated During An Injection Procedure |
| US20070225601A1 (en) * | 1994-09-21 | 2007-09-27 | Medrad, Inc. | Injection systems capable of using feedback for adjustment of injection parameters |
| US20080126037A1 (en) * | 2006-08-02 | 2008-05-29 | Fabian Sievers | Computer System for Simulating a Physical System |
| US8612195B2 (en) | 2009-03-11 | 2013-12-17 | Exxonmobil Upstream Research Company | Gradient-based workflows for conditioning of process-based geologic models |
| US8892412B2 (en) | 2009-03-11 | 2014-11-18 | Exxonmobil Upstream Research Company | Adjoint-based conditioning of process-based geologic models |
| US9008759B2 (en) | 2007-07-17 | 2015-04-14 | Bayer Medical Care Inc. | Devices and systems for determination of parameters for a procedure, for estimation of cardiopulmonary function and for fluid delivery |
| US9302044B2 (en) | 2006-12-29 | 2016-04-05 | Bayer Healthcare Llc | Patient-based parameter generation systems for medical injection procedures |
| US9421330B2 (en) | 2008-11-03 | 2016-08-23 | Bayer Healthcare Llc | Mitigation of contrast-induced nephropathy |
| US9616166B2 (en) | 2004-11-16 | 2017-04-11 | Bayer Healthcare Llc | Systems and methods of determining injection protocols for diagnostic imaging procedures |
| US9949704B2 (en) | 2012-05-14 | 2018-04-24 | Bayer Healthcare Llc | Systems and methods for determination of pharmaceutical fluid injection protocols based on x-ray tube voltage |
| US9959389B2 (en) | 2010-06-24 | 2018-05-01 | Bayer Healthcare Llc | Modeling of pharmaceutical propagation and parameter generation for injection protocols |
| US10898638B2 (en) | 2016-03-03 | 2021-01-26 | Bayer Healthcare Llc | System and method for improved fluid delivery in multi-fluid injector systems |
| US20210103044A1 (en) * | 2019-04-29 | 2021-04-08 | Adnoviv Inc. | System and methods for radar-based detection of people in a room |
| US11141535B2 (en) | 2017-08-31 | 2021-10-12 | Bayer Healthcare Llc | Fluid path impedance assessment for improving fluid delivery performance |
| US11278853B2 (en) | 2013-03-13 | 2022-03-22 | Bayer Healthcare Llc | Method for controlling fluid accuracy and backflow compensation |
| US11385372B2 (en) * | 2015-12-22 | 2022-07-12 | Shell Usa, Inc. | Method and system for generating a seismic gather |
| US11461644B2 (en) | 2018-11-15 | 2022-10-04 | D-Wave Systems Inc. | Systems and methods for semantic segmentation |
| US11481669B2 (en) | 2016-09-26 | 2022-10-25 | D-Wave Systems Inc. | Systems, methods and apparatus for sampling from a sampling server |
| US11478581B2 (en) | 2017-08-31 | 2022-10-25 | Bayer Healthcare Llc | Fluid injector system volume compensation system and method |
| US11501195B2 (en) | 2013-06-28 | 2022-11-15 | D-Wave Systems Inc. | Systems and methods for quantum processing of data using a sparse coded dictionary learned from unlabeled data and supervised learning using encoded labeled data elements |
| US11531852B2 (en) | 2016-11-28 | 2022-12-20 | D-Wave Systems Inc. | Machine learning systems and methods for training with noisy labels |
| US11586915B2 (en) | 2017-12-14 | 2023-02-21 | D-Wave Systems Inc. | Systems and methods for collaborative filtering with variational autoencoders |
| US11598664B2 (en) | 2017-08-31 | 2023-03-07 | Bayer Healthcare Llc | Injector pressure calibration system and method |
| US11625612B2 (en) | 2019-02-12 | 2023-04-11 | D-Wave Systems Inc. | Systems and methods for domain adaptation |
| US11779702B2 (en) | 2017-08-31 | 2023-10-10 | Bayer Healthcare Llc | Method for dynamic pressure control in a fluid injector system |
| US11786652B2 (en) | 2017-08-31 | 2023-10-17 | Bayer Healthcare Llc | System and method for drive member position and fluid injector system mechanical calibration |
| US11900264B2 (en) | 2019-02-08 | 2024-02-13 | D-Wave Systems Inc. | Systems and methods for hybrid quantum-classical computing |
Citations (4)
| Publication number | Priority date | Publication date | Assignee | Title |
|---|---|---|---|---|
| US4111191A (en) * | 1972-05-01 | 1978-09-05 | Shaw Robert F | Apparatus and method for examining blood vessels of interest by tracking position with respect to time of particles introduced therein |
| US4326539A (en) * | 1978-11-28 | 1982-04-27 | Wladimir Obermajer | Process for measuring the cardiac volume |
| US4458688A (en) * | 1982-07-06 | 1984-07-10 | Siemens Gammasonics, Inc. | Method and apparatus for cardiac nuclear imaging |
| US4633400A (en) * | 1984-12-21 | 1986-12-30 | Conoco Inc. | Method for waveform feature extraction from seismic signals |
Family Cites Families (1)
| Publication number | Priority date | Publication date | Assignee | Title |
|---|---|---|---|---|
| US4602348A (en) * | 1982-12-20 | 1986-07-22 | Hart Hiram E | Deconvolution method and apparatus |
-
1990
- 1990-03-15 US US07/494,121 patent/US5249122A/en not_active Expired - Fee Related
-
1991
- 1991-03-15 AU AU76967/91A patent/AU7696791A/en not_active Abandoned
- 1991-03-15 WO PCT/US1991/001764 patent/WO1991014233A1/en not_active Application Discontinuation
- 1991-03-15 EP EP91907818A patent/EP0520038A4/en not_active Withdrawn
Patent Citations (4)
| Publication number | Priority date | Publication date | Assignee | Title |
|---|---|---|---|---|
| US4111191A (en) * | 1972-05-01 | 1978-09-05 | Shaw Robert F | Apparatus and method for examining blood vessels of interest by tracking position with respect to time of particles introduced therein |
| US4326539A (en) * | 1978-11-28 | 1982-04-27 | Wladimir Obermajer | Process for measuring the cardiac volume |
| US4458688A (en) * | 1982-07-06 | 1984-07-10 | Siemens Gammasonics, Inc. | Method and apparatus for cardiac nuclear imaging |
| US4633400A (en) * | 1984-12-21 | 1986-12-30 | Conoco Inc. | Method for waveform feature extraction from seismic signals |
Non-Patent Citations (72)
| Title |
|---|
| Alderson, et al., "Deconvolution Analysis in Radionuclide Quantitation of Left-to-Right Cardiac Shunts", J. Nucl. Med., 20:502-506 (1979). |
| Alderson, et al., Deconvolution Analysis in Radionuclide Quantitation of Left to Right Cardiac Shunts , J. Nucl. Med., 20:502 506 (1979). * |
| Bacharach, et al., "Optimum Fourier filtering of cardiac data: a minimum-error method", J. Nucl. Med., 24:1176-1184 (1983). |
| Bacharach, et al., Optimum Fourier filtering of cardiac data: a minimum error method , J. Nucl. Med., 24:1176 1184 (1983). * |
| Bassingthwaighte, "Circulatory transport and the convolution integral", Mayo. Clin. Proc., 42:137-154 (1967). |
| Bassingthwaighte, Circulatory transport and the convolution integral , Mayo. Clin. Proc., 42:137 154 (1967). * |
| Chackett, "The Application of Transform Methods to Hippuran Renograms", Phys. Med. Biol., 23:1199-1202 (1978). |
| Chackett, The Application of Transform Methods to Hippuran Renograms , Phys. Med. Biol., 23:1199 1202 (1978). * |
| Colin, et al., "Etude experimentale due renogramme", Arch. Kreisllauff., 16:289-306 (1965). |
| Colin, et al., Etude experimentale due renogramme , Arch. Kreisllauff., 16:289 306 (1965). * |
| Diffey, et al., "The 99m Tc-DTPA Dynamic Renal Scan With Deconvolution Analysis", J. Nucl. Med., 17:352-355 (1976). |
| Diffey, et al., The 99m Tc DTPA Dynamic Renal Scan With Deconvolution Analysis , J. Nucl. Med., 17:352 355 (1976). * |
| Fleming, et al., "A Technique for the Deconvolution of the Renogram", Phys. Med. Biol., 19:546-549 (1974). |
| Fleming, et al., A Technique for the Deconvolution of the Renogram , Phys. Med. Biol., 19:546 549 (1974). * |
| Gremmel, et al., "Auswertung von Isotopennephrogrammen durch die Entfaltungsmethode", Nucl.-Med., 18:46-51 (1979). |
| Gremmel, et al., Auswertung von Isotopennephrogrammen durch die Entfaltungsmethode , Nucl. Med., 18:46 51 (1979). * |
| Ham, et al., "Radionuclide quantitation of left-to-right cardiac shunts using deconvolution analysis: Concise communication", J. Nucl. Med., 22:688-692 (1981). |
| Ham, et al., Radionuclide quantitation of left to right cardiac shunts using deconvolution analysis: Concise communication , J. Nucl. Med., 22:688 692 (1981). * |
| Hunt, "The Inverse Problem of Radiography", Mathematical Biosciences, 8:161-179 (1970). |
| Hunt, The Inverse Problem of Radiography , Mathematical Biosciences, 8:161 179 (1970). * |
| Kaplan et al., "The Inverse Problem of Radioisotope Diagnosis: A Computational Method for Determining the Location and Size of Tumors", Mathematical Biosciences, 5:39-55 (1969). |
| Kaplan et al., The Inverse Problem of Radioisotope Diagnosis: A Computational Method for Determining the Location and Size of Tumors , Mathematical Biosciences, 5:39 55 (1969). * |
| Keller, et al., "Direct Determination of the Attenuation Coefficient for Radionuclide Volume Measurements", J. Nucl. Med., 28:102-107 (1987). |
| Keller, et al., Direct Determination of the Attenuation Coefficient for Radionuclide Volume Measurements , J. Nucl. Med., 28:102 107 (1987). * |
| Kenny, et al., "Deconvolution analysis of the scintillation camera renogram", B. J. of Radiology, 48:481-486 (1975). |
| Kenny, et al., Deconvolution analysis of the scintillation camera renogram , B. J. of Radiology, 48:481 486 (1975). * |
| King et al., "Use of a nonstationary temporal Wiener filter in nuclear medicient", Eur. J. Nucl. Med., 10:458-461 (1985). |
| King et al., Use of a nonstationary temporal Wiener filter in nuclear medicient , Eur. J. Nucl. Med., 10:458 461 (1985). * |
| King, et al., "Digital Restoration of Indium-111 and Iodine-123 SPECT Images with Optimized Metz Filters", J. Nucl. Med., 27:1327-1336 (1986). |
| King, et al., Digital Restoration of Indium 111 and Iodine 123 SPECT Images with Optimized Metz Filters , J. Nucl. Med., 27:1327 1336 (1986). * |
| Knesaurek, et al., "Comparison of three deconvolution techniques in renography", Eur. J. Nucl. Med., 9:254-256 (1984). |
| Knesaurek, et al., Comparison of three deconvolution techniques in renography , Eur. J. Nucl. Med., 9:254 256 (1984). * |
| Knop, et al., "Biokinetics of Bone Tracers by Means of Deconvolution Analysis-Comparison of 99m TcMDP, 99m TcDPD and 99m TcEHDP", Nucl.-Med., 21:144-145 (1982). |
| Knop, et al., "Deconvolution Analysis of 99m Te-Methylene Diphosphonate Kinetics in Metabolic Bone Disease", Eur. J. Nucl. Med., 6:63-67 (1981). |
| Knop, et al., Biokinetics of Bone Tracers by Means of Deconvolution Analysis Comparison of 99m TcMDP, 99m TcDPD and 99m TcEHDP , Nucl. Med., 21:144 145 (1982). * |
| Knop, et al., Deconvolution Analysis of 99m Te Methylene Diphosphonate Kinetics in Metabolic Bone Disease , Eur. J. Nucl. Med., 6:63 67 (1981). * |
| Kuruc, et al., "An Improved deconvolution technique for improvement after suboptimal bolus injection", Radiol., 148:233-238 (1983). |
| Kuruc, et al., "An Improved Deconvolution Technique for the Calculation ofenal Retention Functions", Computer and Biomedical Research, 15:46-56 (1982). |
| Kuruc, et al., An Improved deconvolution technique for improvement after suboptimal bolus injection , Radiol., 148:233 238 (1983). * |
| Kuruc, et al., An Improved Deconvolution Technique for the Calculation of Renal Retention Functions , Computer and Biomedical Research, 15:46 56 (1982). * |
| Meier, et al., "On the Theory of the Indicator-Dilution Method for Measurement of Blood Flow and Volume", J. App. Phys., 6:731-744 (1954). |
| Meier, et al., On the Theory of the Indicator Dilution Method for Measurement of Blood Flow and Volume , J. App. Phys., 6:731 744 (1954). * |
| Montz et al., "Functional Imaging of Thyroidal 123 I-Clearance", NucCompact, 13:176-178 (1982). |
| Montz et al., Functional Imaging of Thyroidal 123 I Clearance , NucCompact, 13:176 178 (1982). * |
| Nimmon, et al., "Practical Application of Deconvolution Techniques to Dynamic Studies", IAEA, pp. 367-388 (1981). |
| Nimmon, et al., Practical Application of Deconvolution Techniques to Dynamic Studies , IAEA, pp. 367 388 (1981). * |
| Phillips, "A Technique for the Numerical Solution of Certain Integral Equations of the First Kind", J. Assoc. Comp. Mach., 9:84-97 (1962). |
| Phillips, A Technique for the Numerical Solution of Certain Integral Equations of the First Kind , J. Assoc. Comp. Mach., 9:84 97 (1962). * |
| Siegel, et al., "The Buildup Factor: Effect of Scatter on Absolute Volume Determination", J. Nucl. Med., 26:390-394 (1985). |
| Siegel, et al., The Buildup Factor: Effect of Scatter on Absolute Volume Determination , J. Nucl. Med., 26:390 394 (1985). * |
| Stritzke et al., "Non invasive assessment of absolute renal blood flow (RBF) by temporal deconvolution using orthogonal polynomials", J. Nucl. Med., 29:862-863 (1988). |
| Stritzke et al., Non invasive assessment of absolute renal blood flow (RBF) by temporal deconvolution using orthogonal polynomials , J. Nucl. Med., 29:862 863 (1988). * |
| Stritzke, et al., "Funktionsszintigraphie: Eine einheitliche Methode zur Quantifizierung von Stoffwechsel und Funktion in Organen", Nucl.-Med., 24:211-221 (1985). (and accompanying English translation). |
| Stritzke, et al., "Performance of Quantitative Functional Imaging Using Optimal Two-Dimensional Restoration and Temporal Deconvolution of Dynamic Scintigraphic Studies", in: Computer Assisted Radiography, Springer-Verlag, pp. 697-702 (1987). |
| Stritzke, et al., Funktionsszintigraphie: Eine einheitliche Methode zur Quantifizierung von Stoffwechsel und Funktion in Organen , Nucl. Med., 24:211 221 (1985). (and accompanying English translation). * |
| Stritzke, et al., Performance of Quantitative Functional Imaging Using Optimal Two Dimensional Restoration and Temporal Deconvolution of Dynamic Scintigraphic Studies , in: Computer Assisted Radiography, Springer Verlag, pp. 697 702 (1987). * |
| Szabo, et al., "Model identification and estimation of organ-function parameters using radioactive tracers and the impulse-response function", Eur. J. Nucl. Med., 11:265-274 (1985). |
| Szabo, et al., Model identification and estimation of organ function parameters using radioactive tracers and the impulse response function , Eur. J. Nucl. Med., 11:265 274 (1985). * |
| Twomy, "The Application of Numerical Filtering to the Solution of Integral Equations Encountered in Indirect Sensing Measurements", J. of the Franklin Institute, 279:95-109 (1965). |
| Twomy, The Application of Numerical Filtering to the Solution of Integral Equations Encountered in Indirect Sensing Measurements , J. of the Franklin Institute, 279:95 109 (1965). * |
| Valentinuzzi, et al., "Discrete Deconvolution", Medical and Biological Engineering, 13:123-125 (1975). |
| Valentinuzzi, et al., Discrete Deconvolution , Medical and Biological Engineering, 13:123 125 (1975). * |
| Van Huffel, et al., "Reliable and efficient deconvolution technique based on total linear least squares for calculating the renal retention function", Med. & Biol. Eng. & Comput., 25:26-33, (1987). |
| Van Huffel, et al., Reliable and efficient deconvolution technique based on total linear least squares for calculating the renal retention function , Med. & Biol. Eng. & Comput., 25:26 33, (1987). * |
| Van Stekelenburg, "Hippuran Transit Times in the Kidney: a New Approach", Phys. Med. Biol., 23:291-301 (1978). |
| Van Stekelenburg, et al., "A Three-compartment Model for the Transport and Distribution of Hippuran", Phys. Med. Biol., 21:74-84 (1976). |
| Van Stekelenburg, et al., A Three compartment Model for the Transport and Distribution of Hippuran , Phys. Med. Biol., 21:74 84 (1976). * |
| Van Stekelenburg, Hippuran Transit Times in the Kidney: a New Approach , Phys. Med. Biol., 23:291 301 (1978). * |
| Wu, et al., "Tc-99m HIDA Dosimetry in Patients with Various Hepatic Disorders", J. Nucl. Med., 25:905-912 (1984). |
| Wu, et al., Tc 99m HIDA Dosimetry in Patients with Various Hepatic Disorders , J. Nucl. Med., 25:905 912 (1984). * |
| Zierler, "Theoretical Basis of Indicator-Dilution Methods for Measuring Flow and Volume", Circ. Research, 10:393-407 (1962). |
| Zierler, Theoretical Basis of Indicator Dilution Methods for Measuring Flow and Volume , Circ. Research, 10:393 407 (1962). * |
Cited By (47)
| Publication number | Priority date | Publication date | Assignee | Title |
|---|---|---|---|---|
| US20070282199A1 (en) * | 1994-09-21 | 2007-12-06 | Medrad, Inc. | Methods of injecting fluids for use in imaging and therapeutic procedures where feedback enables adjustment of injection parameters |
| US7672710B2 (en) | 1994-09-21 | 2010-03-02 | Medrad, Inc. | Data communication and control for medical imaging systems |
| US8055328B2 (en) | 1994-09-21 | 2011-11-08 | Medrad, Inc. | Interface unit for use with injectors and imaging systems and related devices |
| US20060030773A1 (en) * | 1994-09-21 | 2006-02-09 | Uber Arthur E Iii | Data communication and control for medical imaging systems |
| US20070282198A1 (en) * | 1994-09-21 | 2007-12-06 | Medrad, Inc. | Systems for controlling injection and/or imaging procedures |
| US20070225601A1 (en) * | 1994-09-21 | 2007-09-27 | Medrad, Inc. | Injection systems capable of using feedback for adjustment of injection parameters |
| US7937134B2 (en) | 1994-09-21 | 2011-05-03 | Medrad, Inc. | Systems for controlling injection and/or imaging procedures |
| US8160679B2 (en) | 1994-09-21 | 2012-04-17 | Medrad, Inc. | Methods of coordinating an imaging procedure and an injection procedure |
| US20090326370A1 (en) * | 1994-09-21 | 2009-12-31 | Medrad, Inc. | Interface unit for use with injectors and imaging systems and related devices |
| US20090247866A1 (en) * | 1994-09-21 | 2009-10-01 | Medrad, Inc. | Data communication and control for medical imaging systems |
| US5761346A (en) * | 1994-11-10 | 1998-06-02 | University Of Kentucky Research Foundation | Method of discrete orthogonal basis restoration |
| WO2000060520A1 (en) * | 1999-03-30 | 2000-10-12 | Koninklijke Philips Electronics N.V. | Deriving time-averaged moments |
| US6584338B1 (en) * | 1999-03-30 | 2003-06-24 | Koninklijke Philips Electronics N.V. | Deriving time-averaged moments |
| US9616166B2 (en) | 2004-11-16 | 2017-04-11 | Bayer Healthcare Llc | Systems and methods of determining injection protocols for diagnostic imaging procedures |
| US9950107B2 (en) | 2004-11-24 | 2018-04-24 | Bayer Healthcare Llc | Systems and methods for managing workflow for injection procedures |
| US9238099B2 (en) | 2004-11-24 | 2016-01-19 | Bayer Healthcare Llc | System and apparatus for modeling pressures generated during an injection procedure |
| US10166326B2 (en) | 2004-11-24 | 2019-01-01 | Bayer Healthcare Llc | Devices, systems and methods for determining parameters of one or more phases of an injection procedure |
| US20070213662A1 (en) * | 2004-11-24 | 2007-09-13 | Medrad, Inc. | System And Apparatus For Modeling Pressures Generated During An Injection Procedure |
| US20080126037A1 (en) * | 2006-08-02 | 2008-05-29 | Fabian Sievers | Computer System for Simulating a Physical System |
| US9302044B2 (en) | 2006-12-29 | 2016-04-05 | Bayer Healthcare Llc | Patient-based parameter generation systems for medical injection procedures |
| US10463782B2 (en) | 2006-12-29 | 2019-11-05 | Bayer Healthcare Llc | Patient-based parameter generation systems for medical injection procedures |
| US9008759B2 (en) | 2007-07-17 | 2015-04-14 | Bayer Medical Care Inc. | Devices and systems for determination of parameters for a procedure, for estimation of cardiopulmonary function and for fluid delivery |
| US9421330B2 (en) | 2008-11-03 | 2016-08-23 | Bayer Healthcare Llc | Mitigation of contrast-induced nephropathy |
| US8892412B2 (en) | 2009-03-11 | 2014-11-18 | Exxonmobil Upstream Research Company | Adjoint-based conditioning of process-based geologic models |
| US8612195B2 (en) | 2009-03-11 | 2013-12-17 | Exxonmobil Upstream Research Company | Gradient-based workflows for conditioning of process-based geologic models |
| US9959389B2 (en) | 2010-06-24 | 2018-05-01 | Bayer Healthcare Llc | Modeling of pharmaceutical propagation and parameter generation for injection protocols |
| US11191501B2 (en) | 2012-05-14 | 2021-12-07 | Bayer Healthcare Llc | Systems and methods for determination of pharmaceutical fluid injection protocols based on x-ray tube voltage |
| US9949704B2 (en) | 2012-05-14 | 2018-04-24 | Bayer Healthcare Llc | Systems and methods for determination of pharmaceutical fluid injection protocols based on x-ray tube voltage |
| US11278853B2 (en) | 2013-03-13 | 2022-03-22 | Bayer Healthcare Llc | Method for controlling fluid accuracy and backflow compensation |
| US11501195B2 (en) | 2013-06-28 | 2022-11-15 | D-Wave Systems Inc. | Systems and methods for quantum processing of data using a sparse coded dictionary learned from unlabeled data and supervised learning using encoded labeled data elements |
| US11385372B2 (en) * | 2015-12-22 | 2022-07-12 | Shell Usa, Inc. | Method and system for generating a seismic gather |
| US11672902B2 (en) | 2016-03-03 | 2023-06-13 | Bayer Healthcare Llc | System and method for improved fluid delivery in multi-fluid injector systems |
| US10898638B2 (en) | 2016-03-03 | 2021-01-26 | Bayer Healthcare Llc | System and method for improved fluid delivery in multi-fluid injector systems |
| US11481669B2 (en) | 2016-09-26 | 2022-10-25 | D-Wave Systems Inc. | Systems, methods and apparatus for sampling from a sampling server |
| US11531852B2 (en) | 2016-11-28 | 2022-12-20 | D-Wave Systems Inc. | Machine learning systems and methods for training with noisy labels |
| US11478581B2 (en) | 2017-08-31 | 2022-10-25 | Bayer Healthcare Llc | Fluid injector system volume compensation system and method |
| US11141535B2 (en) | 2017-08-31 | 2021-10-12 | Bayer Healthcare Llc | Fluid path impedance assessment for improving fluid delivery performance |
| US11598664B2 (en) | 2017-08-31 | 2023-03-07 | Bayer Healthcare Llc | Injector pressure calibration system and method |
| US11779702B2 (en) | 2017-08-31 | 2023-10-10 | Bayer Healthcare Llc | Method for dynamic pressure control in a fluid injector system |
| US11786652B2 (en) | 2017-08-31 | 2023-10-17 | Bayer Healthcare Llc | System and method for drive member position and fluid injector system mechanical calibration |
| US11826553B2 (en) | 2017-08-31 | 2023-11-28 | Bayer Healthcare Llc | Fluid path impedance assessment for improving fluid delivery performance |
| US11586915B2 (en) | 2017-12-14 | 2023-02-21 | D-Wave Systems Inc. | Systems and methods for collaborative filtering with variational autoencoders |
| US11461644B2 (en) | 2018-11-15 | 2022-10-04 | D-Wave Systems Inc. | Systems and methods for semantic segmentation |
| US11900264B2 (en) | 2019-02-08 | 2024-02-13 | D-Wave Systems Inc. | Systems and methods for hybrid quantum-classical computing |
| US11625612B2 (en) | 2019-02-12 | 2023-04-11 | D-Wave Systems Inc. | Systems and methods for domain adaptation |
| US20210103044A1 (en) * | 2019-04-29 | 2021-04-08 | Adnoviv Inc. | System and methods for radar-based detection of people in a room |
| US11709245B2 (en) * | 2019-04-29 | 2023-07-25 | Adnoviv Inc. | System and methods for radar-based detection of people in a room |
Also Published As
| Publication number | Publication date |
|---|---|
| WO1991014233A1 (en) | 1991-09-19 |
| EP0520038A1 (en) | 1992-12-30 |
| AU7696791A (en) | 1991-10-10 |
| EP0520038A4 (en) | 1995-01-25 |
Similar Documents
| Publication | Publication Date | Title |
|---|---|---|
| US5249122A (en) | Method and apparatus for forming images using orthogonal polynomials for temporal deconvolution | |
| US5287273A (en) | Functional organ images | |
| Reutter et al. | Direct least-squares estimation of spatiotemporal distributions from dynamic SPECT projections using a spatial segmentation and temporal B-splines | |
| Feng et al. | An evaluation of the algorithms for determining local cerebral metabolic rates of glucose using positron emission tomography dynamic data | |
| Hanson | Bayesian and related methods in image reconstruction from incomplete data | |
| Zaidi et al. | Scatter modelling and compensation in emission tomography | |
| Alpert et al. | Estimation of the local statistical noise in emission computed tomography | |
| Snyder | Parameter estimation for dynamic studies in emission-tomography systems having list-mode data | |
| WO2005004038A1 (en) | Reconstruction of the current flow in a vessel system | |
| Stritzke et al. | Deconvolution using orthogonal polynomials in nuclear medicine: a method for forming quantitative functional images from kinetic studies | |
| Liang et al. | An analytical approach to quantitative reconstruction of non-uniform attenuated brain SPECT | |
| Di Bella et al. | Blind estimation of compartmental model parameters | |
| Stearns et al. | Accelerated image reconstruction for a cylindrical positron tomograph using Fourier domain methods | |
| Maitra et al. | Variability assessment in positron emission tomography and related generalized deconvolution models | |
| Boardman | Constrained optimisation and its application to scintigraphy | |
| Trussell et al. | Errors in Reprojection Methods in Computenzed Tomography | |
| Kim et al. | Inversion for the attenuated Radon transform with constant attenuation | |
| Maitra et al. | Estimating the variability of reconstructed PET data: a technique based on approximating the reconstruction filter by a sum of Gaussian kernels | |
| Stokely | Regional multiparameter estimation from tomographic diffusible tracer clearance curves: Modification of the double-integral method | |
| Maltz et al. | Direct kinetic parameter estimation from dynamic ECT sinogram using dimension-reduced time-activity basis | |
| Chen et al. | Decay correction methods in dynamic PET studies | |
| Lau et al. | Non-invasive quantification of physiological processes with dynamic PET using blind deconvolution | |
| Gullberg et al. | Efficient estimation of dynamic cardiac SPECT kinetic parameters using weighted least squares estimates of dynamic reconstructions | |
| Gullberg et al. | Spectral decomposition of the exponential Radon transform | |
| Hudson et al. | Density deconvolution using spectral mixture models |
Legal Events
| Date | Code | Title | Description |
|---|---|---|---|
| AS | Assignment |
Owner name: MOUNT SINAI SCHOOL OF MEDICINE OF THE CITY OF NEW Free format text: ASSIGNMENT OF ASSIGNORS INTEREST.;ASSIGNOR:STRITZKE, PETER;REEL/FRAME:005441/0852 Effective date: 19900410 |
|
| CC | Certificate of correction | ||
| FEPP | Fee payment procedure |
Free format text: PAYOR NUMBER ASSIGNED (ORIGINAL EVENT CODE: ASPN); ENTITY STATUS OF PATENT OWNER: SMALL ENTITY |
|
| FPAY | Fee payment |
Year of fee payment: 4 |
|
| REMI | Maintenance fee reminder mailed | ||
| LAPS | Lapse for failure to pay maintenance fees | ||
| FP | Lapsed due to failure to pay maintenance fee |
Effective date: 20010928 |
|
| STCH | Information on status: patent discontinuation |
Free format text: PATENT EXPIRED DUE TO NONPAYMENT OF MAINTENANCE FEES UNDER 37 CFR 1.362 |