US20080098311A1 - Method and System for Navigating in a Database of a Computer System - Google Patents
Method and System for Navigating in a Database of a Computer System Download PDFInfo
- Publication number
- US20080098311A1 US20080098311A1 US11/828,691 US82869107A US2008098311A1 US 20080098311 A1 US20080098311 A1 US 20080098311A1 US 82869107 A US82869107 A US 82869107A US 2008098311 A1 US2008098311 A1 US 2008098311A1
- Authority
- US
- United States
- Prior art keywords
- results
- granularity
- levels
- database
- groups
- Prior art date
- Legal status (The legal status is an assumption and is not a legal conclusion. Google has not performed a legal analysis and makes no representation as to the accuracy of the status listed.)
- Granted
Links
- 238000000034 method Methods 0.000 title claims abstract description 48
- 230000000750 progressive effect Effects 0.000 claims abstract description 14
- 238000004590 computer program Methods 0.000 claims abstract description 10
- 238000012986 modification Methods 0.000 claims description 4
- 230000004048 modification Effects 0.000 claims description 4
- 230000000007 visual effect Effects 0.000 claims description 2
- 230000003247 decreasing effect Effects 0.000 claims 1
- 235000019580 granularity Nutrition 0.000 description 94
- 238000011960 computer-aided design Methods 0.000 description 13
- 230000008569 process Effects 0.000 description 12
- 230000000644 propagated effect Effects 0.000 description 12
- 230000006870 function Effects 0.000 description 9
- 238000003860 storage Methods 0.000 description 7
- 230000000712 assembly Effects 0.000 description 5
- 238000000429 assembly Methods 0.000 description 5
- 238000004891 communication Methods 0.000 description 5
- 238000007726 management method Methods 0.000 description 5
- 238000004519 manufacturing process Methods 0.000 description 5
- 230000001960 triggered effect Effects 0.000 description 4
- 230000008901 benefit Effects 0.000 description 3
- 230000008859 change Effects 0.000 description 3
- 238000012545 processing Methods 0.000 description 3
- 230000003044 adaptive effect Effects 0.000 description 2
- 238000013523 data management Methods 0.000 description 2
- 230000007423 decrease Effects 0.000 description 2
- 238000013461 design Methods 0.000 description 2
- 230000000694 effects Effects 0.000 description 2
- 238000012546 transfer Methods 0.000 description 2
- 230000001052 transient effect Effects 0.000 description 2
- 230000007704 transition Effects 0.000 description 2
- 101000666896 Homo sapiens V-type immunoglobulin domain-containing suppressor of T-cell activation Proteins 0.000 description 1
- 102100038282 V-type immunoglobulin domain-containing suppressor of T-cell activation Human genes 0.000 description 1
- 238000013459 approach Methods 0.000 description 1
- 238000010586 diagram Methods 0.000 description 1
- 238000005516 engineering process Methods 0.000 description 1
- 230000000763 evoking effect Effects 0.000 description 1
- IJJVMEJXYNJXOJ-UHFFFAOYSA-N fluquinconazole Chemical compound C=1C=C(Cl)C=C(Cl)C=1N1C(=O)C2=CC(F)=CC=C2N=C1N1C=NC=N1 IJJVMEJXYNJXOJ-UHFFFAOYSA-N 0.000 description 1
- 230000010354 integration Effects 0.000 description 1
- 230000002452 interceptive effect Effects 0.000 description 1
- 238000002372 labelling Methods 0.000 description 1
- 238000013507 mapping Methods 0.000 description 1
- 231100000957 no side effect Toxicity 0.000 description 1
- 238000002360 preparation method Methods 0.000 description 1
- 230000004044 response Effects 0.000 description 1
- 230000011218 segmentation Effects 0.000 description 1
- 238000012384 transportation and delivery Methods 0.000 description 1
Images


Classifications
-
- G—PHYSICS
- G06—COMPUTING; CALCULATING OR COUNTING
- G06F—ELECTRIC DIGITAL DATA PROCESSING
- G06F16/00—Information retrieval; Database structures therefor; File system structures therefor
- G06F16/50—Information retrieval; Database structures therefor; File system structures therefor of still image data
- G06F16/54—Browsing; Visualisation therefor
-
- G—PHYSICS
- G06—COMPUTING; CALCULATING OR COUNTING
- G06F—ELECTRIC DIGITAL DATA PROCESSING
- G06F3/00—Input arrangements for transferring data to be processed into a form capable of being handled by the computer; Output arrangements for transferring data from processing unit to output unit, e.g. interface arrangements
- G06F3/01—Input arrangements or combined input and output arrangements for interaction between user and computer
- G06F3/048—Interaction techniques based on graphical user interfaces [GUI]
- G06F3/0481—Interaction techniques based on graphical user interfaces [GUI] based on specific properties of the displayed interaction object or a metaphor-based environment, e.g. interaction with desktop elements like windows or icons, or assisted by a cursor's changing behaviour or appearance
-
- G—PHYSICS
- G02—OPTICS
- G02B—OPTICAL ELEMENTS, SYSTEMS OR APPARATUS
- G02B21/00—Microscopes
- G02B21/36—Microscopes arranged for photographic purposes or projection purposes or digital imaging or video purposes including associated control and data processing arrangements
- G02B21/365—Control or image processing arrangements for digital or video microscopes
- G02B21/367—Control or image processing arrangements for digital or video microscopes providing an output produced by processing a plurality of individual source images, e.g. image tiling, montage, composite images, depth sectioning, image comparison
-
- G—PHYSICS
- G06—COMPUTING; CALCULATING OR COUNTING
- G06Q—INFORMATION AND COMMUNICATION TECHNOLOGY [ICT] SPECIALLY ADAPTED FOR ADMINISTRATIVE, COMMERCIAL, FINANCIAL, MANAGERIAL OR SUPERVISORY PURPOSES; SYSTEMS OR METHODS SPECIALLY ADAPTED FOR ADMINISTRATIVE, COMMERCIAL, FINANCIAL, MANAGERIAL OR SUPERVISORY PURPOSES, NOT OTHERWISE PROVIDED FOR
- G06Q10/00—Administration; Management
- G06Q10/08—Logistics, e.g. warehousing, loading or distribution; Inventory or stock management
- G06Q10/087—Inventory or stock management, e.g. order filling, procurement or balancing against orders
- G06Q10/0875—Itemisation or classification of parts, supplies or services, e.g. bill of materials
-
- G—PHYSICS
- G06—COMPUTING; CALCULATING OR COUNTING
- G06Q—INFORMATION AND COMMUNICATION TECHNOLOGY [ICT] SPECIALLY ADAPTED FOR ADMINISTRATIVE, COMMERCIAL, FINANCIAL, MANAGERIAL OR SUPERVISORY PURPOSES; SYSTEMS OR METHODS SPECIALLY ADAPTED FOR ADMINISTRATIVE, COMMERCIAL, FINANCIAL, MANAGERIAL OR SUPERVISORY PURPOSES, NOT OTHERWISE PROVIDED FOR
- G06Q30/00—Commerce
- G06Q30/06—Buying, selling or leasing transactions
- G06Q30/0601—Electronic shopping [e-shopping]
- G06Q30/0641—Shopping interfaces
- G06Q30/0643—Graphical representation of items or shoppers
-
- G—PHYSICS
- G06—COMPUTING; CALCULATING OR COUNTING
- G06T—IMAGE DATA PROCESSING OR GENERATION, IN GENERAL
- G06T11/00—2D [Two Dimensional] image generation
- G06T11/20—Drawing from basic elements, e.g. lines or circles
- G06T11/206—Drawing of charts or graphs
-
- G—PHYSICS
- G09—EDUCATION; CRYPTOGRAPHY; DISPLAY; ADVERTISING; SEALS
- G09G—ARRANGEMENTS OR CIRCUITS FOR CONTROL OF INDICATING DEVICES USING STATIC MEANS TO PRESENT VARIABLE INFORMATION
- G09G2370/00—Aspects of data communication
- G09G2370/02—Networking aspects
- G09G2370/027—Arrangements and methods specific for the display of internet documents
Definitions
- the invention relates to the field of computer programs and systems, and more specifically to product life cycle management solutions, which comprise databases of data representative of modeled objects.
- CAD computer-aided design
- NURBS non-uniform rational B-splines
- CAD systems include graphic tools for representing the modeled objects to the designers; these tools are dedicated to the display of complex objects the typical size of a file representing an object in a CAD system being in the range of a Mega-byte for a part, and an assembly may comprise thousands of parts.
- a CAD system manages models of objects, which are stored in electronic files.
- PLM product life cycle management solutions
- DASSAULT SYSTEMES under the trademarks CATIA, ENOVIA and DELMIA
- these solutions provide a Engineering Hub, which organizes product engineering knowledge
- a Manufacturing Hub which manages manufacturing engineering knowledge
- an Enterprise Hub which enables enterprise integrations and connections into both the Engineering and Manufacturing Hubs.
- PLM solutions comprise a relational database of products.
- the database comprises a set of textual data and relations between the data.
- Data typically include technical data related to the products said data being ordered in a hierarchy of data and are indexed to be searchable.
- the data are representative of the products, which are often modeled objects.
- PLM solutions One of the problems in such PLM solutions is that the users of the system may wish to display results of querying, for instance concerning objects (e.g. products or product parts) stored on a database, and possibly have a 3D graphic representation of said results. Then, the user typically needs to navigate amongst the displayed results.
- objects e.g. products or product parts
- the ALTA VISTA Company proposed an Internet search site, with a request box where the user may input keywords for retrieving information.
- GOOGLE Inc proposed a searching tool for searching html files or text documents (in the PDF, MICROSOFT Word or RTF formats) available through the Internet.
- the results are returned to the user as a list of sorted web pages, see e.g. U.S. Pat. No. 6,285,999, with a given number of result pages that a user can subsequently explore.
- Each result is displayed as a URL, together with an abstract of the document accessible through the URL.
- the abstract is an extract of sentences or part of sentences of the document. If a web page is comprised of frames, the result returned to the user may be the URL of the frame, together with an abstract of the frame. Each frame is therefore searched and handled individually by the engine.
- a web search engine such as GOOGLE and MSN search provides a way to access information content from a global index. In particular, they do provide access to information entries that are accessible from a remote computer, for example through the HTTP, FTP or NNTP protocols.
- the results returned from a query are sorted and accessible in several sections or pages. Exploration of the results is therefore limited to a page-by-page or section-by-section process. Within a given page or section, a summary of the results may be available. However, the user has no clue about results contained within other sections or pages. The user can therefore not see how a particular result correlates to remaining results. Exploration of the results may therefore appears too strict for the user.
- said solution should allow a user to easily navigate in a database of a product lifecycle management system, storing notably complex modeled objects.
- the invention therefore provides a method for navigating in a database of a computer system, the computer system comprising a graphical user interface, the method comprises steps of: returning results from a query in a database; and displaying in the graphical user interface the results returned using several levels of progressive granularity, each of the results being associated with one of the levels, according to the query.
- the method according to the invention may comprise one or more of the following features:
- the invention further proposes a computer program implementing the method according to the invention.
- the invention is also directed to a computer system implementing the method of the invention, the system, e.g. a product lifecycle management system, comprising said database and said graphical user interface.
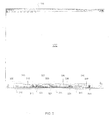
- FIGS. 1 and 2 show variants of views wherein results are displayed using several levels of granularity, according to alternative embodiments of the invention
- FIG. 3 is an exemplified display of a PLM graphical user interface showing a toolbar for querying a database, according to an embodiment of the invention
- FIG. 4 shows a view in the PLM graphical user interface of FIG. 3 , wherein results are displayed using several levels of granularity;
- FIG. 5 shows the same results as in FIG. 4 , as redisplayed after a change in the granularity of the results;
- FIG. 6 shows the same results as in FIG. 4 , as redisplayed after another change in the granularity of the results;
- FIG. 7 shows the same results as in FIG. 6 , as redisplayed after receiving focus on a particular result
- FIG. 8 shows the same results as in FIG. 6 , wherein a functionality of a graphical tool is activated in view of a further navigation step;
- FIG. 9 shows a view of new results as obtained after said new navigation step
- FIG. 10 shows the same results as in FIG. 9 , as redisplayed after a particular group of results has been focused on;
- FIG. 11 is an example computer network deploying embodiments of the present invention.
- FIG. 12 is an example computer node in the network of FIG. 11 implementing embodiments of the present invention.
- the invention proposes a method for navigating in a database of a computer system, wherein all results returned from a database query are displayed using several levels of granularity.
- the granularity is preferably progressive, which makes it possible to better comprehend how results correlate.
- Results which are currently prominently displayed on the screen are associated with the finest granularity. Such results may be, for example, centered in the display screen or placed at the front.
- the focus (or display focus) is the targeted area in the screen display depending of the current viewpoint. Results far from the focus are given coarse granularity, and possibly dynamically grouped. Accordingly, the results can be represented using a “perspective” constructed from the current user's focus, improving markedly the navigation.
- the number of levels of granularity is user-selectable, which still improves the intelligibility of the results.
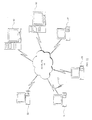
- FIGS. 1 and 2 are views of results displayed using several levels of progressive granularity, according to alternative embodiments of the invention.
- Querying a database for instance upon user request, returns results 110 a - g .
- the results returned are sorted, ordered or ranked, e.g. according to their relevance with respect to the user request.
- Sorting is any process of arranging items in some sequence and/or in different sets, and accordingly, it may have two close, yet distinct meanings:
- the returned results may be associated with attributes or ordered according to a sequence reflecting either ordering or category membership.
- the results are sorted according to a default sorting rule, for example by name.
- Tags A-Z in the representations are associated with the results in FIG. 1 or 2 , which can denote successive pages of results. For example, all returned results whose name (or reference, designation, header, etc.) begins with letter “a” can be accessed under page A.
- each page A-Z may contain a predetermined number of results, ranked according to the sorting rule.
- results are displayed in a graphical user interface (or GUI) 100 (details of the GUI will be emphasized later, in reference to FIG. 3 ).
- GUI graphical user interface
- the results concern CAD objects, e.g. parts of an engine.
- the exact nature of the parts displayed in FIG. 1 or 2 is, however, not important for the understanding of the invention.
- the results 110 a - g returned are displayed using several levels, e.g. four, of progressive granularity.
- the concept of granularity is today well established in the field of computer science, though not accurately defined.
- “Granularity” is intended to mean the level of detail at which information is viewed or described. For example, the more (or the finer) granular an access tool, the smaller the chunks of information it leads to.
- the result of a demographic study may be sorted according to continents, countries, regions, towns, etc. (the fineness of granularity increases when passing from continents to towns).
- an index linking to specific paragraphs is more granular (or has finer granularity) than a table of contents or site map linking to specific pages.
- the granularity is sometimes viewed as the extent to which a larger entity is subdivided e.g., a yard broken into inches has finer granularity than a yard broken into feet.
- Each of the sorted results 110 a - g displayed are associated with one of said levels of granularity. Making use of different granularities amounts to introduce a notion of groups amongst the results. Yet, a one-to-one mapping between levels of granularity and groups is not mandatory, as will be discussed later. Accordingly, the results displayed are both sorted and (somehow) grouped. Owing to the progressive granularity used, the user can therefore better see how a particular result correlates with remaining results or groups of results. This point shall be exemplified below.
- results 110 d are associated with the level of finest granularity.
- results associated with the finest granularity are e.g. the most relevant results, as displayed just after the query.
- the display focus is on these objects just after displaying the query results (that is, being the current focus).
- the results 110 d associated with the finest granularity are displayed as individual 3D graphical representations of modeled objects stored on the PLM database. Individual 3D graphical representations allow for immediate understanding of the nature of the objects, compared e.g., with object references or names.
- individual representations may preferably be supplemented by individual object references/names, such as ‘K013-1152013” (as in FIG. 1 ).
- name prefixes only are displayed in relation to groups of coarser granularity.
- 3D miniature representations may be used, which are distributed on a 2D seamless layout, as in the example of FIG. 1 , or on a disk in perspective (or turntable), as in FIG. 2 .
- Seamless representations somehow “derigidify” the navigation and further makes it remain consistent throughout, as will appear below.
- a unitary 3D graphical representation is preferably used for results associated with coarser granularity.
- Said unitary representation should preferably be representative of a group of results and thus intuitive to the user.
- the unitary representation may for example have a sphere or bubble shape ( 110 a - c , 110 e - g ).
- the fineness of the granularity may vary along an underlying ordered sequence.
- the granularity may decrease along the sequence, starting from the focus, where the granularity is the finest.
- the same (finest) granularity may be applied to a given number of results similar in nature to the selected result (e.g. the focus), for example, to part or all the results accessible via the same page as the current focus, e.g. page A.
- a given number of results (if not all) in that page may be given the same granularity.
- said unitary 3D graphical representation may comprise previews of results in the group, see e.g. bubbles 100 b, c, e, f .
- Name (or reference, etc.) prefixes may also be displayed in bubbles, see e.g. “(K)” or “(K013)” in bubbles 110 e or 110 e , in order to make the granularity progressive.
- Name prefixes can be viewed as a kind of “textual” previews, whose granularity is coarse compared with the entire name.
- progressive granularity the user can have a guess of what is hidden in the corresponding groups. Accordingly, progressive granularity makes it possible to better understand how the focused results 110 d correlate to remaining results 110 a -C, 110 e - g .
- the user can easily understand the link between the last result 110 d displayed with fine granularity (see the reference K013-1152024) and results grouped in bubble 110 e . Namely, the link is the prefix “K013” in this example.
- the graphical previews establish another type of link. The user can for instance immediately see correlation between results 110 d and e.g. 110 c or 110 e : mechanical parts of an engine are involved.
- said previews may dynamically react to a user pointer approaching the bubbles.
- the bubbles may initially display no previews.
- previews may progressively appear in the bubbles, making the GUI more interactive.
- previews can for instance be made “adaptive”. For example, a selection of the previews can be contemplated, which selection can adapt to the content. For example, only one over ten results or only the first result, or still the first result of each page (see e.g. pages L-N in bubble 110 f ) may be previewed. Similarly, if textual content were contemplated, keywords or summary could be provided. Thus, the previews might be called adaptive previews in this case.
- FIG. 1 or 2 does in fact not reflect the state of display just after the query, but rather reflects a state of display just after a user has focused on a particular result. Indeed, when the results 110 a - g are returned from the query, the association of said results with the various levels of granularity is made according to the query. For example, the n most relevant results 110 d receives finest granularity, while less relevant results receive coarser granularity.
- the view of FIG. 1 or 2 corresponds to views as displayed once the user has focused on a particular section (here section K013 of page K) or selected a particular result, for example result 110 d in said section.
- section K013 or the result 110 ds (‘s’ for more than one individual representation 110 d of an object) is the current focus.
- the finest granularity is associated with the current focus.
- the same granularity was applied to a given number of results in said section.
- the invention proposes a method in which both sorting and grouping the results is possible, but no rigid frontiers are imposed between sorting and grouping when navigating among the returned results.
- a too large number of levels may be confusing in use.
- using only two levels may result in abrupt transitions. Therefore, three or four levels seem more convenient.
- the number of levels may be interactively modified by the user, so as to add a dimension of navigation; this will be discussed in reference to the next figures.
- “Far away” groups e.g. 110 a and 110 g may appear smaller than “closer” ones ( 110 c and 110 e ) and previews may be made available only on “closer” groups. Note that the concept of far/close depends on (is relative to) the current focus, but initial sorting is preserved.
- a slider 130 may be provided (in a 2D layout) as part of the widgets of the GUI, enabling scrolling of the results. Accordingly, when scrolling the results, individual representations 110 d of objects sequentially appears at one end (near one of the closest groups, precedes) and disappear at the other end (near the other of the closest groups, succeeds), except when reaching the end of the result (according to the sorting rule), where a side effect may lead to unblock the last group, e.g. the group 110 g . Note that a dynamic resegmentation of the groups occurs when scrolling the results.
- the process of the invention is implemented in a computer network comprising user computers and one or more product data management (PDM) system.
- the user computers are in communication with the PDM system.
- the PDM system may, for example, be located at a backbone of the network.
- the PDM system allows for the management of numerous documents, relations, and data, possibly hierarchically interrelated.
- Such a PDM system is equipped with a product lifecycle database having data related to modeled products, assemblies, and product parts, which are likely to be searched and possibly subsequently edited by a designer. A plurality of users may thus work in a collaborative way, on different parts, products or assemblies.
- the GUI 100 may be a typical PLM-like interface, having standard menu bars 120 , as usual in the art.
- the GUI 100 is run on a computer on a network, having a display and memory.
- GUIs similar to that identified by reference numeral 100 illustrated in FIG. 3 may be run on other computers of the network. These computers may further benefit from similar local applications and a common environment.
- the GUI 100 is adapted for allowing access to the product lifecycle database, either on a user's request or as a background task.
- Designers may hence query the PLM database directly using said GUI 100 .
- the search may for instance be triggered via the toolbar 300 .
- search results are displayed, as no query has yet been triggered.
- the toolbar 300 may comprise one or more toolbar areas.
- the toolbar 300 comprises four such toolbar areas 310 , 320 , 330 , 340 .
- Each area of the toolbar is associated with one or more functions or tasks, which are likely to be selected by a user. Such functions are directly or indirectly initiated via selection of the associated area.
- Each of the four toolbar areas of FIG. 3 shows preferably a button 315 , 325 , 335 , 345 , suitable for user-selection of a function to be performed.
- the buttons may be indicative of the function, e.g. “Ready for selection”.
- each of the buttons 315 , 325 , 335 , 345 of the toolbar areas 310 , 320 , 330 , 340 may be supplemented by pull-down menu buttons (respectively denoted by reference numbers 316 , 326 , 336 , 346 ) for displaying more functions or possible arguments thereof.
- a first toolbar area 310 may generally be associated with search operations.
- a second area 320 may concern selection operations and a third area 330 be directed to operations of collaboration in a collaborative workgroup, for instance like chat/communication with other designers.
- Said collaborative workgroup may, for example, be composed of people sharing a collaborative workspace such as co-designers and project supervisors.
- a fourth toolbar area 340 may be associated with modifications delivery functions for updating the database and inform the collaborative workgroup.
- the third toolbar area 330 dedicated to collaborative work, may help the designer to quickly contact other designer and thereby solve conflicts inherent to collaborative work in network.
- a user may select the input field 315 , 325 , 335 , 345 for instance thanks to the user's mouse, may directly enter or select a desired argument (for example the keyword “Mobile” in the input field 315 of the “search” area 310 ).
- a desired argument for example the keyword “Mobile” in the input field 315 of the “search” area 310 .
- the user may click an associated icon button 311 , 321 , 331 , 341 in order to trigger the execution of the function (here a search function is triggered by clicking icon 311 ).
- Such icon buttons 311 , 321 , 331 , 341 have advantages in terms of ergonomics. Such buttons may further be tagged with intuitive icons.
- the fields of the toolbar may be configured so as to display “positive” clearer messages, so as to optimize user guidance.
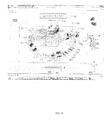
- a possible result of the query “Mobile” is represented in FIG. 4 , showing results returned in response to the query.
- the results 110 a and 110 d are displayed using different levels of granularity.
- the user gets the results on a disk or turntable, wherein a bubble 110 a acts as a “data bag”. Again, a default sorting rule is applied.
- the results are sorted by name.
- the database contains notably two classes of products related to the keyword “Mobile”, that is: mobile phones (denoted by both the generic reference 110 d and references 219 - 223 ) and a modeled miniature car ( 110 d and 210 ).
- the algorithm provides that results pertaining to page A are displayed using the finest granularity.
- the objects 110 d thus form a default group of most relevant results returned, whose name begins with letter “a”.
- the generic name of the mobile phone may be e.g. “Advance mobile phone”, the name of the car be “Amusement mobile”, hence the results returned.
- Other results are displayed using coarser granularity.
- the algorithm may be designed to ensure that a default number, e.g. 14 of relevant parts/objects are displayed using the finest granularity and that remaining objects 110 a are grouped according to coarser granularity. Here only one such group 110 a is represented. However, the default number of groups of remaining objects may be user-modifiable, as previously evoked.
- a default number e.g. 14 of relevant parts/objects are displayed using the finest granularity and that remaining objects 110 a are grouped according to coarser granularity.
- the default number of groups of remaining objects may be user-modifiable, as previously evoked.
- parts 211 - 218 e.g. the chassis frame 211
- results 110 a benefit from a coarser granularity, that is, are grouped and represented as a bubble 110 a , possibly showing previews of said remaining objects, as in FIG. 1 or 2 .
- the bubble 110 a shows aggregated previews of mobile phones 219 - 223 and the miniature car 210 .
- An indication of an approximate number of such remaining objects may additionally be provided (not shown).
- a first widget 150 may be provided which indicates the current group (here corresponding to page A) being viewed with the finest granularity. Note that a group does not necessarily correspond to a page; in particular, groups of results having coarser granularity may in fact aggregate several pages.
- the user can explore the results pages by page by clicking symbols “>” or “ ⁇ ” in the widget 150 . He/she may also go directly to a next page of the results using the selectable range display which depends on the sorting rule (here A, B, C, D, E-J, K-Q, R-Z).
- the selectable range display which depends on the sorting rule (here A, B, C, D, E-J, K-Q, R-Z).
- the selectable range display which depends on the sorting rule (here A, B, C, D, E-J, K-Q, R-Z).
- another widget 160 or “zoom” slider may be provided which acts as a zoom, notably for varying the number of displayed levels of granularity.
- the cursor 161 has three possible locations: right, middle, left. When the cursor 161 of the widget 160 is on the right, only one group 110 a with coarse granularity is displayed. The number of exploded results (with finest granularity) is therefore optimal.
- a last graphical tool 400 can be provided for adding possibilities of navigation. This will be explained in reference to FIGS. 8-9 .
- the user has modified the granularity of the results.
- zooming out (left position) has reduced the number of levels to one level of (coarse) granularity only.
- the results grouped by the name criterion.
- the algorithm has created new groups 510 a - c , 510 e - f , in order to optimize the segmentation. Accordingly, the groups have been redefined compared with the situation of FIG. 4 . To achieve this, various philosophies might be adopted.
- the algorithm may systematically try to create a given number of homogeneous groups, depending on the position of the cursor 161 of the slider 160 (for example:
- using the zoom slider 160 to modify the granularity of the results may also result in automatically redefining (e.g. resegmenting) groups of results.
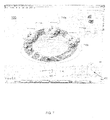
- the user has again modified the granularity of the results.
- the total number of levels of granularity remains unchanged compared with the situation in FIG. 4 .
- the number of groups 610 a - c having a coarse granularity has increased.
- the overall granularity including all the groups has changed.
- the zoom slider 160 allows the user to change the number of levels of granularity and the definition of groups within a same level.
- the groups are therefore, not anymore rigid sets, with rigid frontiers.
- the invention may provide, in an embodiment, optimizing the number of groups and their content according to both sorting rules and required number of levels of granularity.
- the user may decide to focus on an object contained in one of the groups, e.g. 610 a (corresponding to pages J-Q). In this respect, he/she might double-click said group, resulting in the display shown in FIG. 7 .
- the turntable has “rotated” compared with FIG. 6 .
- a given number of objects of page J now forms the group 710 d having the finest granularity.
- Said objects are thus displayed as unitary objects, having a respective 3D graphical representation.
- Said objects are further now the closest to the viewpoint (modification of the focus) and other groups 710 a - c have been dynamically redefined (with respect to FIG. 6 ), and redistributed on the turntable.
- the position of the cursor of widget 160 remains unchanged compared with FIG. 6 .
- the current focus is the closest from the viewpoint, whereas “farther” results are recast at the background on the turntable.
- Groups 710 a - c in FIG. 7 are different than those in FIG. 6 because they contain a different number of objects, and different objects.
- the turntable can be actuated in a similar fashion as the 2D layout of FIG. 1 .
- the user may turn the turntable thanks to its pointer, which makes it possible to scroll results.
- individual representations of objects (finer granularity) sequentially appear at the front of the turntable, as extracted from one of the closest groups, and disappear in the other of the closest groups.
- no side effect occurs, owing to the turntable design.
- a dynamic resegmentation of the groups occurs when scrolling the results.
- the method of navigation allows for defining a subset of objects stored in a database (e.g. the subset formed by objects 710 a - d or, equivalently, 610 a - d in FIG. 6 , returned from the query) and at least two groups within the subset.
- a first group ( 610 a , 610 b or 610 c ) aggregates, for example, the least relevant results and will be associated with a coarse granularity.
- the second group e.g. 610 d
- the method provides for displaying in the GUI the first and second groups with respective granularities.
- At least one unitary graphical representation may correspond to the first group (e.g. a bubble) while individual graphical representations of each of the objects corresponding to the second group will be displayed.
- the method further allows for dynamically redefining said at least one group (e.g. 610 a ) by varying therein a number of objects upon receiving instructions of a user for navigating among the displayed objects in the groups. Different levels of granularity are thus involved, making it possible for a user to focus on given results (e.g. 710 d ) while still viewing the remaining results (e.g. 710 a - c ). The progression in the navigation is thereby improved.
- new groups might be formed, facilitating the comprehension of the relations between the objects.
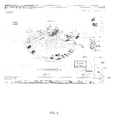
- FIG. 8 shows the same view as in FIG. 6 , wherein a functionality of a graphical tool 400 has been activated, for allowing navigation according to criteria.
- said tool may, in an embodiment, trigger a process for displaying the results of e.g. FIG. 6 , which results are redistributed (possibly reordered or categorized) according to a new criterion. Said process is hereafter referred to as a redistribution process.
- the graphical tool 400 may comprise user-interactive areas 410 (North quadrant), 420 (West), 430 (South), 440 (East), 450 (centre), which may for instance be activated by a simple mouse click.
- the areas of the graphical tool 400 are preferably tagged with markers for easier identification and arranged so as to make the graphical tool 400 intuitive and ergonomic.
- the graphical tool 400 has the general shape of a compass (areas 410 , 420 , 430 , 440 arranged in quadrants), so that it will be hereafter denoted either by “compass” or “graphical tool” to mean the same thing. Though such a shape is preferred with respect to its handiness, various other shapes could be provided.
- the compass 400 of the system is intended to be a user-friendly and intuitive tool.
- the user-selectable areas 410 - 450 may be dedicated to various types of functions.
- quadrant 430 may be activated, which results in displaying a sub-menu 431 .
- the sub-menu 431 offers the user to choose among navigation by Name or Type. Choosing the “Type” criterion will result in the view of FIG. 9 .
- FIG. 9 shows a view of new results as obtained after a new navigation step based on the chosen criterion, that is, redisplayed on the turntable 910 according to types of objects.
- it has been identified five types of files (which files relate to the previous objects).
- five groups 910 a, b, c, d, e, f have been formed, reflecting said five types of files.
- Said types of files are videos 910 a , Jpeg images 910 b , Text files 910 f CAD objects/parts 910 e and CAD drawings 910 c , as indicated in tags displayed in the vicinity of the represented groups.
- the cursor of widget 160 has in this example automatically been set to the left position, that is, only one level of granularity (coarse) has been maintained. Such an option might be the default one when a large number of files is involved.
- the database comprises modeled objects and relations between said modeled objects.
- Said modeled objects are associated to a set of values of attributes, whose values are stored on the database or computable based on relations involving said modeled objects.
- Said redistribution process may first comprise displaying to the user a view of the results (according to the method of the invention, see e.g. FIG. 6 ). Then, the redistribution process may comprises receiving a selection by a user of an attribute type, which can typically be achieved via the graphical tool 400 , as will be explained. Next, said redistribution process comprises steps of:
- Said attribute types may for instance correspond to criteria (for example, object names or types). It is therefore possible to navigate among the results according to criteria instead of pages.
- a user may wish to expand results pertaining to a particular group of results, e.g., group 910 c .
- group 910 c the user may double-click the corresponding bubble 910 e , resulting in the view of FIG. 10 , in an embodiment of the invention.
- FIG. 10 shows the same results as in FIG. 9 , wherein a particular group (the group 910 e of CAD objects/parts in FIG. 9 ) of results has received focus of a user.
- the user gets all the requested objects on a second-order turntable 920 (the turntable 910 being the parent or first-order turntable).
- the user gets the same objects 110 a , 110 d , 210 - 223 as displayed in FIG. 4 .
- this expansion may occur only when a single level of (coarse) granularity or when groups (e.g., groups 910 a, b, c, d , e, f in FIG. 9 ) only are present in the first turntable 910 .
- groups e.g., groups 910 a, b, c, d , e, f in FIG. 9 .
- the displayed objects (including bubbles) 910 a, b, c, d , e, f, 110 a , 110 d , 210 - 223 are distributed according to a respective weight at a given level in the turn-table hierarchy (the first-order 910 , the second-order 920 , etc.), and the weight of a displayed object depends on the number of descendants of said object in the hierarchy which are displayed in the GUI 100 . Thanks to the principle of the weight dependence, such a solution allows the user to better comprehend its progression through the organized data as well as the relations between objects and this, in an easy and intuitive way.
- FIG. 11 illustrates a computer network or similar digital processing environment in which embodiments of the present invention may be deployed.
- Client computer(s)/devices 50 e.g., the user computer described in reference to FIG. 3
- server computer(s) 60 e.g., the product data management (PDM) system described in reference to FIG. 3
- PDM product data management
- Client computer(s)/devices 50 can also be linked through communications network 70 to other computing devices, including other client devices/processes 50 and server computer(s) 60 .
- Communications network 70 can be part of a remote access network, a global network (e.g., the Internet), a worldwide collection of computers, Local area or Wide area networks, and gateways that currently use respective protocols (TCP/IP, Bluetooth, etc.) to communicate with one another.
- a global network e.g., the Internet
- IP Internet Protocol
- Bluetooth Bluetooth
- Other electronic device/computer network architectures are suitable.
- FIG. 12 is a block diagram of the internal structure of a computer (e.g., client processor/device 50 or server computers 60 ) of FIG. 11 in which various embodiments of the present invention may be implemented.
- Each computer 50 , 60 contains system bus 79 , where a bus is a set of hardware lines used for data transfer among the components of a computer or processing system.
- Bus 79 is essentially a shared conduit that connects different elements of a computer system (e.g., processor, disk storage, memory, input/output ports, network ports, etc.) that enables the transfer of information between the elements.
- I/O device interface 82 for connecting various input and output devices (e.g., keyboard, mouse, displays, printers, speakers, etc.) to the computer 50 , 60 .
- Network interface 86 allows the computer to connect to various other devices attached to a network (e.g., network 70 of FIG. 11 ).
- Memory 90 provides volatile storage for computer software instructions 92 and data 94 used to implement an embodiment of the present invention.
- Disk storage 95 provides non-volatile storage for computer software instructions 92 and data 94 used to implement an embodiment of the present invention.
- Central processor unit 84 is also attached to system bus 79 and provides for the execution of computer instructions.
- the processor routines 92 and data 94 are a computer program product (generally referenced 92 ), including a computer readable medium (e.g., a removable storage medium such as one or more DVD-ROM's, CD-ROM's, diskettes, tapes, etc.) that provides at least a portion of the software instructions for the invention system.
- Computer program product 92 can be installed by any suitable software installation procedure, as is well known in the art.
- at least a portion of the software instructions may also be downloaded over a cable, communication and/or wireless connection.
- the invention programs are a computer program propagated signal product 107 embodied on a propagated signal on a propagation medium (e.g., a radio wave, an infrared wave, a laser wave, a sound wave, or an electrical wave propagated over a global network such as the Internet, or other network(s)).
- a propagation medium e.g., a radio wave, an infrared wave, a laser wave, a sound wave, or an electrical wave propagated over a global network such as the Internet, or other network(s).
- Such carrier medium or signals provide at least a portion of the software instructions for the present invention routines/program 92 .
- the propagated signal is an analog carrier wave or digital signal carried on the propagated medium.
- the propagated signal may be a digitized signal propagated over a global network (e.g., the Internet), a telecommunications network, or other network.
- the propagated signal is a signal that is transmitted over the propagation medium over a period of time, such as the instructions for a software application sent in packets over a network over a period of milliseconds, seconds, minutes, or longer.
- the computer readable medium of computer program product 92 is a propagation medium that the computer system 50 may receive and read, such as by receiving the propagation medium and identifying a propagated signal embodied in the propagation medium, as described above for computer program propagated signal product.
- carrier medium or transient carrier encompasses the foregoing transient signals, propagated signals, propagated medium, storage medium and the like.
- FIGS. 11 and 12 are for purposes of illustration and not limitation of the present invention.
Abstract
Description
- This application claims priority under 35 U.S.C. 119 or 365 to European Patent Application No. EP 06015755.9, filed Jul. 28, 2006.
- The entire teachings of the above application are incorporated herein by reference.
- The invention relates to the field of computer programs and systems, and more specifically to product life cycle management solutions, which comprise databases of data representative of modeled objects.
- A number of systems and programs are offered on the market for the design of parts or assemblies of parts, such as the one provided by DASSAULT SYSTEMES under the trademark CATIA. These so-called computer-aided design (CAD) systems allow a user to construct and manipulate complex three dimensional (3D) models of objects or assemblies of objects. CAD systems thus provide a representation of modeled objects using edges or lines, in certain cases with faces. Lines or edges may be represented in various manners, e.g. non-uniform rational B-splines (NURBS). These CAD systems manage parts or assemblies of parts as modeled objects, which are essentially specifications of geometry. Specifically, CAD files contain specifications, from which geometry is generated, from geometry a representation is generated. Specifications, geometry and representation may be stored in a single CAD file or multiple ones. CAD systems include graphic tools for representing the modeled objects to the designers; these tools are dedicated to the display of complex objects the typical size of a file representing an object in a CAD system being in the range of a Mega-byte for a part, and an assembly may comprise thousands of parts. A CAD system manages models of objects, which are stored in electronic files.
- There also exists product life cycle management solutions (PLM), such as the one provided by DASSAULT SYSTEMES under the trademarks CATIA, ENOVIA and DELMIA; these solutions provide a Engineering Hub, which organizes product engineering knowledge, a Manufacturing Hub, which manages manufacturing engineering knowledge, and an Enterprise Hub which enables enterprise integrations and connections into both the Engineering and Manufacturing Hubs. All together the systems deliver an open object model linking products, processes, resources to enable dynamic, knowledge-based product creation and decision support that drives optimized product definition, manufacturing preparation, production and service. Such PLM solutions comprise a relational database of products. The database comprises a set of textual data and relations between the data. Data typically include technical data related to the products said data being ordered in a hierarchy of data and are indexed to be searchable. The data are representative of the products, which are often modeled objects.
- One of the problems in such PLM solutions is that the users of the system may wish to display results of querying, for instance concerning objects (e.g. products or product parts) stored on a database, and possibly have a 3D graphic representation of said results. Then, the user typically needs to navigate amongst the displayed results.
- In a neighboring technical field, several celebrated search engines have been developed for retrieving information on the Internet. For instance, the ALTA VISTA Company proposed an Internet search site, with a request box where the user may input keywords for retrieving information. More recently, GOOGLE Inc, proposed a searching tool for searching html files or text documents (in the PDF, MICROSOFT Word or RTF formats) available through the Internet. The results are returned to the user as a list of sorted web pages, see e.g. U.S. Pat. No. 6,285,999, with a given number of result pages that a user can subsequently explore. Each result is displayed as a URL, together with an abstract of the document accessible through the URL. The abstract is an extract of sentences or part of sentences of the document. If a web page is comprised of frames, the result returned to the user may be the URL of the frame, together with an abstract of the frame. Each frame is therefore searched and handled individually by the engine.
- More generally, a web search engine, such as GOOGLE and MSN search provides a way to access information content from a global index. In particular, they do provide access to information entries that are accessible from a remote computer, for example through the HTTP, FTP or NNTP protocols.
- Other searching tools exist for searching and retrieving information on the Internet. In particular, aside from search engines are also known web directories, which are directories on the WWW that specialize in linking to other web sites and categorizing those links. Web directories often allow site owners to submit their site for inclusion. For example, YAHOO! is a computer services company which operates an Internet portal, a web directory and a host of other services including the e-mail services. Web directories often make use of search engine technologies. As regards more particularly the web directory, there is again provided a request box. Results of a search input to the request box are displayed in several sections. The first section displays the category matches, together with the path to the matches in the category tree, while the second section displays site matches. The third section displays web pages. GOOGLE Inc. also provides an Internet site for search among sites and categories. The results of a search contain an indication of the classification of sites and categories. Selecting the category search provides the user with a list of categories that may relate to the search; the contents of each category may later be accessed.
- Still other solutions rely on multi-criteria-based queries in databases for retrieving information.
- In the above cases, the results returned from a query are sorted and accessible in several sections or pages. Exploration of the results is therefore limited to a page-by-page or section-by-section process. Within a given page or section, a summary of the results may be available. However, the user has no clue about results contained within other sections or pages. The user can therefore not see how a particular result correlates to remaining results. Exploration of the results may therefore appears too strict for the user.
- Thus, according to the limitations of the existing solutions shortly discussed above, there is a need for an improved solution of navigation among results returned from a query. Preferably, said solution should allow a user to easily navigate in a database of a product lifecycle management system, storing notably complex modeled objects.
- In one embodiment, the invention therefore provides a method for navigating in a database of a computer system, the computer system comprising a graphical user interface, the method comprises steps of: returning results from a query in a database; and displaying in the graphical user interface the results returned using several levels of progressive granularity, each of the results being associated with one of the levels, according to the query.
- In other embodiments, the method according to the invention may comprise one or more of the following features:
-
- the method further comprises steps of: receiving user selection of at least one of the results returned; and redisplaying the results using said several levels of granularity, wherein the selected result is associated with a level having the finest granularity;
- the method further comprises steps of: receiving a user request for modifying the number of levels of granularity; and redisplaying the results according to the modified number of levels;
- at the step of receiving the user request for modifying the number of levels of granularity, said number can be selected amongst 1 and 2;
- the graphical user interface comprises a widget or interface component adapted for triggering a modification of the number of levels;
- the results returned are sorted in an ordered sequence; and at the step of redisplaying the results, the fineness of the granularity in the levels decreases from the selected result along the ordered sequence;
- at the step of displaying, at least two groups of results are defined based on the ordered sequence and displayed, wherein one of said two groups is associated with a level having the finest granularity;
- the method further comprises steps of: receiving user selection of one of said two groups; and redefining said at least two groups into at least two new groups, wherein: the first group of said at least two new groups comprises at least part of the results in the selected group; and the second group of said at least two new groups comprises the remaining results;
- the method further comprises steps of: displaying said at least two new groups using said several levels of granularity, wherein: said first group is associated with a level having the finest granularity; and said second group is associated with one or more levels having coarser granularity, compared with the first group;
- the method further comprises, prior to the step of returning the results, a step of: receiving a user request for the query;
- at the steps of displaying, the results associated with the level of finest granularity are displayed as respective 3D graphical representations related to objects stored on the database;
- at least one unitary 3D graphical representation is used for results associated with a level whose granularity is not the finest granularity;
- said unitary 3D graphical representation has a bubble shape;
- said unitary 3D graphical representation comprises previews of results in the group;
- said previews dynamically react to a user pointer approaching said unitary 3D graphical representation; and
- at the step of displaying, said results are displayed on a visual cue.
- The invention further proposes a computer program implementing the method according to the invention. The invention is also directed to a computer system implementing the method of the invention, the system, e.g. a product lifecycle management system, comprising said database and said graphical user interface.
- The foregoing will be apparent from the following more particular description of non-limiting example embodiments of the invention, as illustrated in the accompanying drawings in which like reference characters refer to the same parts throughout the different views. The drawings are not necessarily to scale, emphasis instead being placed upon illustrating embodiments of the present invention.
-
FIGS. 1 and 2 show variants of views wherein results are displayed using several levels of granularity, according to alternative embodiments of the invention; -
FIG. 3 is an exemplified display of a PLM graphical user interface showing a toolbar for querying a database, according to an embodiment of the invention; -
FIG. 4 shows a view in the PLM graphical user interface ofFIG. 3 , wherein results are displayed using several levels of granularity; -
FIG. 5 shows the same results as inFIG. 4 , as redisplayed after a change in the granularity of the results; -
FIG. 6 shows the same results as inFIG. 4 , as redisplayed after another change in the granularity of the results; -
FIG. 7 shows the same results as inFIG. 6 , as redisplayed after receiving focus on a particular result; -
FIG. 8 shows the same results as inFIG. 6 , wherein a functionality of a graphical tool is activated in view of a further navigation step; -
FIG. 9 shows a view of new results as obtained after said new navigation step; -
FIG. 10 shows the same results as inFIG. 9 , as redisplayed after a particular group of results has been focused on; -
FIG. 11 is an example computer network deploying embodiments of the present invention; and -
FIG. 12 is an example computer node in the network ofFIG. 11 implementing embodiments of the present invention. - A description of example embodiments of the invention follows.
- The invention proposes a method for navigating in a database of a computer system, wherein all results returned from a database query are displayed using several levels of granularity. The granularity is preferably progressive, which makes it possible to better comprehend how results correlate. Results which are currently prominently displayed on the screen (also called the focus) are associated with the finest granularity. Such results may be, for example, centered in the display screen or placed at the front. The focus (or display focus) is the targeted area in the screen display depending of the current viewpoint. Results far from the focus are given coarse granularity, and possibly dynamically grouped. Accordingly, the results can be represented using a “perspective” constructed from the current user's focus, improving markedly the navigation. In an embodiment, the number of levels of granularity is user-selectable, which still improves the intelligibility of the results.
- Basic principles underlying the invention will now be discussed in reference to
FIGS. 1 and 2 .FIGS. 1 and 2 are views of results displayed using several levels of progressive granularity, according to alternative embodiments of the invention. - Querying a database, for instance upon user request, returns results 110 a-g. As usual in the field of database queries, the results returned are sorted, ordered or ranked, e.g. according to their relevance with respect to the user request.
- Sorting is any process of arranging items in some sequence and/or in different sets, and accordingly, it may have two close, yet distinct meanings:
-
- ordering, arranging items of the same kind, class, nature, etc. in some ordered sequence, and
- categorizing: grouping and labeling items with similar properties together (by sorts).
- Notwithstanding these definitions, the returned results may be associated with attributes or ordered according to a sequence reflecting either ordering or category membership.
- In the example of
FIG. 1 or 2, the results are sorted according to a default sorting rule, for example by name. Tags A-Z in the representations are associated with the results inFIG. 1 or 2, which can denote successive pages of results. For example, all returned results whose name (or reference, designation, header, etc.) begins with letter “a” can be accessed under page A. In a variant, each page A-Z may contain a predetermined number of results, ranked according to the sorting rule. - Said results are displayed in a graphical user interface (or GUI) 100 (details of the GUI will be emphasized later, in reference to
FIG. 3 ). Here the results concern CAD objects, e.g. parts of an engine. The exact nature of the parts displayed inFIG. 1 or 2 is, however, not important for the understanding of the invention. - Importantly, the results 110 a-g returned are displayed using several levels, e.g. four, of progressive granularity. The concept of granularity is today well established in the field of computer science, though not accurately defined. In the present specification, “Granularity” is intended to mean the level of detail at which information is viewed or described. For example, the more (or the finer) granular an access tool, the smaller the chunks of information it leads to. As another example, the result of a demographic study may be sorted according to continents, countries, regions, towns, etc. (the fineness of granularity increases when passing from continents to towns). Still another example, an index linking to specific paragraphs is more granular (or has finer granularity) than a table of contents or site map linking to specific pages. In a similar spirit, the granularity is sometimes viewed as the extent to which a larger entity is subdivided e.g., a yard broken into inches has finer granularity than a yard broken into feet.
- Each of the sorted results 110 a-g displayed are associated with one of said levels of granularity. Making use of different granularities amounts to introduce a notion of groups amongst the results. Yet, a one-to-one mapping between levels of granularity and groups is not mandatory, as will be discussed later. Accordingly, the results displayed are both sorted and (somehow) grouped. Owing to the progressive granularity used, the user can therefore better see how a particular result correlates with remaining results or groups of results. This point shall be exemplified below.
- For example, some of the
results 110 d are associated with the level of finest granularity. Typically, results associated with the finest granularity are e.g. the most relevant results, as displayed just after the query. The display focus is on these objects just after displaying the query results (that is, being the current focus). Basically, in a PLM context, theresults 110 d associated with the finest granularity are displayed as individual 3D graphical representations of modeled objects stored on the PLM database. Individual 3D graphical representations allow for immediate understanding of the nature of the objects, compared e.g., with object references or names. - Yet, the individual representations may preferably be supplemented by individual object references/names, such as ‘K013-1152013” (as in
FIG. 1 ). In a variant, name prefixes only are displayed in relation to groups of coarser granularity. - Preferably, 3D miniature representations may be used, which are distributed on a 2D seamless layout, as in the example of
FIG. 1 , or on a disk in perspective (or turntable), as inFIG. 2 . Seamless representations somehow “derigidify” the navigation and further makes it remain consistent throughout, as will appear below. - In contrast with individual 3D graphical representations, a unitary 3D graphical representation is preferably used for results associated with coarser granularity. Said unitary representation should preferably be representative of a group of results and thus intuitive to the user. To this aim, the unitary representation may for example have a sphere or bubble shape (110 a-c, 110 e-g).
- The various groups of results need not give the same level of details to the user. Accordingly, as can be seen in
FIG. 1 or 2, the fineness of the granularity may vary along an underlying ordered sequence. In particular, the granularity may decrease along the sequence, starting from the focus, where the granularity is the finest. Also, the same (finest) granularity may be applied to a given number of results similar in nature to the selected result (e.g. the focus), for example, to part or all the results accessible via the same page as the current focus, e.g. page A. Furthermore, when selecting a page (the focus is thus the page selected) a given number of results (if not all) in that page may be given the same granularity. - Regarding “far” results (110 a-c, 110 e-g), because groups of results corresponding to bubbles relate to objects which are not either the most relevant or the current focus, a coarser granularity can be applied. Accordingly, the level of detail in the bubbles is less than that available from individual representations, that is, from the finest granularity.
- Making use of progressive granularity allows for preventing abrupt transition between individual representations and group representations. In this respect, said unitary 3D graphical representation may comprise previews of results in the group, see e.g. bubbles 100 b, c, e, f. Name (or reference, etc.) prefixes may also be displayed in bubbles, see e.g. “(K)” or “(K013)” in
bubbles - Thanks to progressive granularity, the user can have a guess of what is hidden in the corresponding groups. Accordingly, progressive granularity makes it possible to better understand how the
focused results 110 d correlate to remaining results 110 a-C, 110 e-g. For example, inFIG. 1 , the user can easily understand the link between thelast result 110 d displayed with fine granularity (see the reference K013-1152024) and results grouped inbubble 110 e. Namely, the link is the prefix “K013” in this example. Furthermore, the graphical previews establish another type of link. The user can for instance immediately see correlation betweenresults 110 d and e.g. 110 c or 110 e: mechanical parts of an engine are involved. - In a variant, said previews may dynamically react to a user pointer approaching the bubbles. For example, the bubbles may initially display no previews. When the user approaches a pointer, previews may progressively appear in the bubbles, making the GUI more interactive.
- When a group of results corresponding to the bubbles contain too many results, previews can for instance be made “adaptive”. For example, a selection of the previews can be contemplated, which selection can adapt to the content. For example, only one over ten results or only the first result, or still the first result of each page (see e.g. pages L-N in
bubble 110 f) may be previewed. Similarly, if textual content were contemplated, keywords or summary could be provided. Thus, the previews might be called adaptive previews in this case. - The views of
FIG. 1 or 2 does in fact not reflect the state of display just after the query, but rather reflects a state of display just after a user has focused on a particular result. Indeed, when the results 110 a-g are returned from the query, the association of said results with the various levels of granularity is made according to the query. For example, the n mostrelevant results 110 d receives finest granularity, while less relevant results receive coarser granularity. - Rather, the view of
FIG. 1 or 2 corresponds to views as displayed once the user has focused on a particular section (here section K013 of page K) or selected a particular result, forexample result 110 d in said section. Thus, section K013 or the result 110 ds (‘s’ for more than oneindividual representation 110 d of an object) is the current focus. The finest granularity is associated with the current focus. In addition, the same granularity was applied to a given number of results in said section. - Preferably, when redisplaying results are shown in
FIGS. 1 and 2 , the continuity of the sorting rule (here by pages, denoted by A-Z) is preserved, such that the redisplayed results are still sorted from page A to page Z. This amounts to saying that an underlying ordered sequence of results is preserved. Therefore, the invention proposes a method in which both sorting and grouping the results is possible, but no rigid frontiers are imposed between sorting and grouping when navigating among the returned results. - One may contemplate having e.g., four different levels of granularity, as in
FIG. 1 or 2. One may else use only three levels (e.g. by regroupingbubbles - Advantageously, the number of levels may be interactively modified by the user, so as to add a dimension of navigation; this will be discussed in reference to the next figures.
- Interestingly also, a perspective effect could be researched as to the relevance of the results with respect to the current focus. In this respect, “Far away” groups e.g. 110 a and 110 g may appear smaller than “closer” ones (110 c and 110 e) and previews may be made available only on “closer” groups. Note that the concept of far/close depends on (is relative to) the current focus, but initial sorting is preserved.
- More specifically, in reference to
FIG. 1 , aslider 130 may be provided (in a 2D layout) as part of the widgets of the GUI, enabling scrolling of the results. Accordingly, when scrolling the results,individual representations 110 d of objects sequentially appears at one end (near one of the closest groups, precedes) and disappear at the other end (near the other of the closest groups, succeeds), except when reaching the end of the result (according to the sorting rule), where a side effect may lead to unblock the last group, e.g. thegroup 110 g. Note that a dynamic resegmentation of the groups occurs when scrolling the results. - In the following, embodiments of the invention will be described which relate more particularly to a PLM context.
- As an example embodiment, the process of the invention is implemented in a computer network comprising user computers and one or more product data management (PDM) system. The user computers are in communication with the PDM system. The PDM system may, for example, be located at a backbone of the network. The PDM system allows for the management of numerous documents, relations, and data, possibly hierarchically interrelated. Such a PDM system is equipped with a product lifecycle database having data related to modeled products, assemblies, and product parts, which are likely to be searched and possibly subsequently edited by a designer. A plurality of users may thus work in a collaborative way, on different parts, products or assemblies.
- In
FIG. 3 , theGUI 100 may be a typical PLM-like interface, havingstandard menu bars 120, as usual in the art. TheGUI 100 is run on a computer on a network, having a display and memory. For instance, GUIs similar to that identified byreference numeral 100 illustrated inFIG. 3 may be run on other computers of the network. These computers may further benefit from similar local applications and a common environment. - The
GUI 100 is adapted for allowing access to the product lifecycle database, either on a user's request or as a background task. Designers may hence query the PLM database directly using saidGUI 100. The search may for instance be triggered via thetoolbar 300. Here, search results are displayed, as no query has yet been triggered. - More in details, the
toolbar 300 may comprise one or more toolbar areas. In the embodiment ofFIG. 3 , thetoolbar 300 comprises foursuch toolbar areas - Each of the four toolbar areas of
FIG. 3 shows preferably abutton buttons toolbar areas reference numbers - In the embodiment of
FIG. 3 , afirst toolbar area 310 may generally be associated with search operations. Asecond area 320 may concern selection operations and athird area 330 be directed to operations of collaboration in a collaborative workgroup, for instance like chat/communication with other designers. Said collaborative workgroup may, for example, be composed of people sharing a collaborative workspace such as co-designers and project supervisors. Afourth toolbar area 340 may be associated with modifications delivery functions for updating the database and inform the collaborative workgroup. - The above structure allow for an efficient access to routine PLM tasks. In particular, the
third toolbar area 330, dedicated to collaborative work, may help the designer to quickly contact other designer and thereby solve conflicts inherent to collaborative work in network. - In operation, a user may select the
input field input field 315 of the “search” area 310). Once the argument has been selected, the user may click an associatedicon button Such icon buttons - A possible result of the query “Mobile” is represented in
FIG. 4 , showing results returned in response to the query. As inFIG. 1 or 2, theresults bubble 110 a acts as a “data bag”. Again, a default sorting rule is applied. Here the results are sorted by name. - In this non-limiting example, it is assumed that the database contains notably two classes of products related to the keyword “Mobile”, that is: mobile phones (denoted by both the
generic reference 110 d and references 219-223) and a modeled miniature car (110 d and 210). - By default, the algorithm provides that results pertaining to page A are displayed using the finest granularity. The
objects 110 d thus form a default group of most relevant results returned, whose name begins with letter “a”. The generic name of the mobile phone may be e.g. “Advance mobile phone”, the name of the car be “Amusement mobile”, hence the results returned. Other results are displayed using coarser granularity. - The algorithm may be designed to ensure that a default number, e.g. 14 of relevant parts/objects are displayed using the finest granularity and that remaining
objects 110 a are grouped according to coarser granularity. Here only onesuch group 110 a is represented. However, the default number of groups of remaining objects may be user-modifiable, as previously evoked. - Regarding the mobile phones 219-223, various color versions are displayed. Concerning the miniature car, parts 211-218 (e.g. the chassis frame 211) are also returned and displayed, as being logically related to the input keyword “Mobile”.
-
Other results 110 a benefit from a coarser granularity, that is, are grouped and represented as abubble 110 a, possibly showing previews of said remaining objects, as inFIG. 1 or 2. In the example ofFIG. 4 , thebubble 110 a shows aggregated previews of mobile phones 219-223 and theminiature car 210. An indication of an approximate number of such remaining objects may additionally be provided (not shown). - Next, a
first widget 150 may be provided which indicates the current group (here corresponding to page A) being viewed with the finest granularity. Note that a group does not necessarily correspond to a page; in particular, groups of results having coarser granularity may in fact aggregate several pages. - In use, the user can explore the results pages by page by clicking symbols “>” or “<” in the
widget 150. He/she may also go directly to a next page of the results using the selectable range display which depends on the sorting rule (here A, B, C, D, E-J, K-Q, R-Z). When going to another page, e.g. page B, said page would be expanded to fine granularity while a group would be formed to aggregate pages A, C-Z and possibly some of the results in page B which cannot be displayed on the turntable. - In addition, another
widget 160 or “zoom” slider (interface component generally) may be provided which acts as a zoom, notably for varying the number of displayed levels of granularity. In this example, thecursor 161 has three possible locations: right, middle, left. When thecursor 161 of thewidget 160 is on the right, only onegroup 110 a with coarse granularity is displayed. The number of exploded results (with finest granularity) is therefore optimal. - A last
graphical tool 400 can be provided for adding possibilities of navigation. This will be explained in reference toFIGS. 8-9 . - In reference to
FIG. 5 : using the “zoom”slider 160, the user has modified the granularity of the results. Here, zooming out (left position) has reduced the number of levels to one level of (coarse) granularity only. The results grouped by the name criterion. Meanwhile, the algorithm has created new groups 510 a-c, 510 e-f, in order to optimize the segmentation. Accordingly, the groups have been redefined compared with the situation ofFIG. 4 . To achieve this, various philosophies might be adopted. - For example, the algorithm may systematically try to create a given number of homogeneous groups, depending on the position of the
cursor 161 of the slider 160 (for example: -
- five groups 510 a-c, 510 e-f, when the
cursor 161 is in zoom-out/left position (having coarse granularity only); - four groups when the
cursor 161 is at the middle (including one group having the finest granularity, the other groups receiving coarse granularity, see groups 610 a-d inFIG. 6 ); and - two groups when the
cursor 161 is in zoom-in or right position (including the finest granularity group, the other group being of coarse granularity, see 110 a and 110 d inFIG. 4 ).
- five groups 510 a-c, 510 e-f, when the
- Accordingly, using the
zoom slider 160 to modify the granularity of the results may also result in automatically redefining (e.g. resegmenting) groups of results. - In reference to
FIG. 6 , using thezoom slider 160, the user has again modified the granularity of the results. Here the total number of levels of granularity remains unchanged compared with the situation inFIG. 4 . However, the number of groups 610 a-c having a coarse granularity has increased. Hence the overall granularity including all the groups has changed. - Therefore, the
zoom slider 160 allows the user to change the number of levels of granularity and the definition of groups within a same level. The groups are therefore, not anymore rigid sets, with rigid frontiers. In contrast, the invention may provide, in an embodiment, optimizing the number of groups and their content according to both sorting rules and required number of levels of granularity. - Next, the user may decide to focus on an object contained in one of the groups, e.g. 610 a (corresponding to pages J-Q). In this respect, he/she might double-click said group, resulting in the display shown in
FIG. 7 . - In reference to
FIG. 7 , the turntable has “rotated” compared withFIG. 6 . A given number of objects of page J now forms thegroup 710 d having the finest granularity. Said objects are thus displayed as unitary objects, having a respective 3D graphical representation. Said objects are further now the closest to the viewpoint (modification of the focus) and other groups 710 a-c have been dynamically redefined (with respect toFIG. 6 ), and redistributed on the turntable. Here the position of the cursor ofwidget 160 remains unchanged compared withFIG. 6 . Note the current focus is the closest from the viewpoint, whereas “farther” results are recast at the background on the turntable. Groups 710 a-c inFIG. 7 are different than those inFIG. 6 because they contain a different number of objects, and different objects. - In an embodiment, the turntable can be actuated in a similar fashion as the 2D layout of
FIG. 1 . Here, instead of using a slider (e.g. the slider 130) as inFIG. 1 , the user may turn the turntable thanks to its pointer, which makes it possible to scroll results. As in the case ofFIG. 1 , individual representations of objects (finer granularity) sequentially appear at the front of the turntable, as extracted from one of the closest groups, and disappear in the other of the closest groups. In contrast withFIG. 1 , no side effect occurs, owing to the turntable design. Again, a dynamic resegmentation of the groups occurs when scrolling the results. - Thus, as a summary, the method of navigation according to the invention allows for defining a subset of objects stored in a database (e.g. the subset formed by objects 710 a-d or, equivalently, 610 a-d in
FIG. 6 , returned from the query) and at least two groups within the subset. A first group (610 a, 610 b or 610 c) aggregates, for example, the least relevant results and will be associated with a coarse granularity. The second group (e.g. 610 d) contains objects to be associated with the finest granularity. Next, the method provides for displaying in the GUI the first and second groups with respective granularities. As described above, at least one unitary graphical representation may correspond to the first group (e.g. a bubble) while individual graphical representations of each of the objects corresponding to the second group will be displayed. Then, the method further allows for dynamically redefining said at least one group (e.g. 610 a) by varying therein a number of objects upon receiving instructions of a user for navigating among the displayed objects in the groups. Different levels of granularity are thus involved, making it possible for a user to focus on given results (e.g. 710 d) while still viewing the remaining results (e.g. 710 a-c). The progression in the navigation is thereby improved. In addition, when the user changes the required granularity, new groups might be formed, facilitating the comprehension of the relations between the objects. -
FIG. 8 shows the same view as inFIG. 6 , wherein a functionality of agraphical tool 400 has been activated, for allowing navigation according to criteria. In other words, said tool may, in an embodiment, trigger a process for displaying the results of e.g.FIG. 6 , which results are redistributed (possibly reordered or categorized) according to a new criterion. Said process is hereafter referred to as a redistribution process. - As shown in
FIG. 8 , thegraphical tool 400 may comprise user-interactive areas 410 (North quadrant), 420 (West), 430 (South), 440 (East), 450 (centre), which may for instance be activated by a simple mouse click. The areas of thegraphical tool 400 are preferably tagged with markers for easier identification and arranged so as to make thegraphical tool 400 intuitive and ergonomic. In the example ofFIG. 8 , thegraphical tool 400 has the general shape of a compass (areas compass 400 of the system is intended to be a user-friendly and intuitive tool. - The user-selectable areas 410-450 may be dedicated to various types of functions. In this
respect quadrant 430 may be activated, which results in displaying asub-menu 431. The sub-menu 431 offers the user to choose among navigation by Name or Type. Choosing the “Type” criterion will result in the view ofFIG. 9 . -
FIG. 9 shows a view of new results as obtained after a new navigation step based on the chosen criterion, that is, redisplayed on theturntable 910 according to types of objects. In the present example, it has been identified five types of files (which files relate to the previous objects). Accordingly, fivegroups 910 a, b, c, d, e, f have been formed, reflecting said five types of files. Said types of files arevideos 910 a,Jpeg images 910 b, Text files 910 f CAD objects/parts 910 e andCAD drawings 910 c, as indicated in tags displayed in the vicinity of the represented groups. - The cursor of
widget 160 has in this example automatically been set to the left position, that is, only one level of granularity (coarse) has been maintained. Such an option might be the default one when a large number of files is involved. - The underlying principle of the redistribution by types is explained now.
- Recall that the database comprises modeled objects and relations between said modeled objects. Said modeled objects are associated to a set of values of attributes, whose values are stored on the database or computable based on relations involving said modeled objects.
- Said redistribution process may first comprise displaying to the user a view of the results (according to the method of the invention, see e.g.
FIG. 6 ). Then, the redistribution process may comprises receiving a selection by a user of an attribute type, which can typically be achieved via thegraphical tool 400, as will be explained. Next, said redistribution process comprises steps of: -
- querying the database for the objects of the previously displayed view;
- providing one or more values of the selected attribute type, associated to the objects of the previous view; and
- redisplaying said objects in the view according to the new provided values of the attribute.
- Said attribute types may for instance correspond to criteria (for example, object names or types). It is therefore possible to navigate among the results according to criteria instead of pages.
- Note that instead of a graphical tool, such as the
graphic tool 400, the same redistribution process could be triggered using any icon or menu command or other user command. - Next, a user may wish to expand results pertaining to a particular group of results, e.g.,
group 910 c. To this aim, the user may double-click thecorresponding bubble 910 e, resulting in the view ofFIG. 10 , in an embodiment of the invention. -
FIG. 10 shows the same results as inFIG. 9 , wherein a particular group (thegroup 910 e of CAD objects/parts inFIG. 9 ) of results has received focus of a user. The user gets all the requested objects on a second-order turntable 920 (theturntable 910 being the parent or first-order turntable). As a result, the user gets thesame objects FIG. 4 . - In a variant, this expansion may occur only when a single level of (coarse) granularity or when groups (e.g.,
groups 910 a, b, c, d, e, f inFIG. 9 ) only are present in thefirst turntable 910. - In another variant, the displayed objects (including bubbles) 910 a, b, c, d, e, f, 110 a, 110 d, 210-223 are distributed according to a respective weight at a given level in the turn-table hierarchy (the first-
order 910, the second-order 920, etc.), and the weight of a displayed object depends on the number of descendants of said object in the hierarchy which are displayed in theGUI 100. Thanks to the principle of the weight dependence, such a solution allows the user to better comprehend its progression through the organized data as well as the relations between objects and this, in an easy and intuitive way. -
FIG. 11 illustrates a computer network or similar digital processing environment in which embodiments of the present invention may be deployed. - Client computer(s)/devices 50 (e.g., the user computer described in reference to
FIG. 3 ) and server computer(s) 60 (e.g., the product data management (PDM) system described in reference toFIG. 3 ) provide processing, storage (e.g., the product lifecycle database described in reference toFIG. 3 ), and input/output devices executing application programs and the like. Client computer(s)/devices 50 can also be linked throughcommunications network 70 to other computing devices, including other client devices/processes 50 and server computer(s) 60. -
Communications network 70 can be part of a remote access network, a global network (e.g., the Internet), a worldwide collection of computers, Local area or Wide area networks, and gateways that currently use respective protocols (TCP/IP, Bluetooth, etc.) to communicate with one another. Other electronic device/computer network architectures are suitable. -
FIG. 12 is a block diagram of the internal structure of a computer (e.g., client processor/device 50 or server computers 60) ofFIG. 11 in which various embodiments of the present invention may be implemented. Eachcomputer O device interface 82 for connecting various input and output devices (e.g., keyboard, mouse, displays, printers, speakers, etc.) to thecomputer Network interface 86 allows the computer to connect to various other devices attached to a network (e.g.,network 70 ofFIG. 11 ).Memory 90 provides volatile storage forcomputer software instructions 92 anddata 94 used to implement an embodiment of the present invention.Disk storage 95 provides non-volatile storage forcomputer software instructions 92 anddata 94 used to implement an embodiment of the present invention.Central processor unit 84 is also attached to system bus 79 and provides for the execution of computer instructions. - In one embodiment, the
processor routines 92 anddata 94 are a computer program product (generally referenced 92), including a computer readable medium (e.g., a removable storage medium such as one or more DVD-ROM's, CD-ROM's, diskettes, tapes, etc.) that provides at least a portion of the software instructions for the invention system.Computer program product 92 can be installed by any suitable software installation procedure, as is well known in the art. In another embodiment, at least a portion of the software instructions may also be downloaded over a cable, communication and/or wireless connection. In other embodiments, the invention programs are a computer program propagatedsignal product 107 embodied on a propagated signal on a propagation medium (e.g., a radio wave, an infrared wave, a laser wave, a sound wave, or an electrical wave propagated over a global network such as the Internet, or other network(s)). Such carrier medium or signals provide at least a portion of the software instructions for the present invention routines/program 92. - In alternate embodiments, the propagated signal is an analog carrier wave or digital signal carried on the propagated medium. For example, the propagated signal may be a digitized signal propagated over a global network (e.g., the Internet), a telecommunications network, or other network. In one embodiment, the propagated signal is a signal that is transmitted over the propagation medium over a period of time, such as the instructions for a software application sent in packets over a network over a period of milliseconds, seconds, minutes, or longer. In another embodiment, the computer readable medium of
computer program product 92 is a propagation medium that thecomputer system 50 may receive and read, such as by receiving the propagation medium and identifying a propagated signal embodied in the propagation medium, as described above for computer program propagated signal product. - Generally speaking, the term “carrier medium” or transient carrier encompasses the foregoing transient signals, propagated signals, propagated medium, storage medium and the like.
- Further, the present invention may be implemented in a variety of computer architectures. The computer of
FIGS. 11 and 12 are for purposes of illustration and not limitation of the present invention. - While this invention has been particularly shown and described with references to example embodiments thereof it will be understood by those skilled in the art that various changes in form and details may be made therein without departing from the scope of the invention encompassed by the appended claims.
Claims (22)
Applications Claiming Priority (3)
| Application Number | Priority Date | Filing Date | Title |
|---|---|---|---|
| EP06015755.9A EP1883020B1 (en) | 2006-07-28 | 2006-07-28 | Method and system for navigating in a database of a computer system |
| EP06015755 | 2006-07-28 | ||
| EPEP06015755.9 | 2006-07-28 |
Publications (2)
| Publication Number | Publication Date |
|---|---|
| US20080098311A1 true US20080098311A1 (en) | 2008-04-24 |
| US9411828B2 US9411828B2 (en) | 2016-08-09 |
Family
ID=37123897
Family Applications (1)
| Application Number | Title | Priority Date | Filing Date |
|---|---|---|---|
| US11/828,691 Active 2031-08-31 US9411828B2 (en) | 2006-07-28 | 2007-07-26 | Method and system for navigating in a database of a computer system |
Country Status (6)
| Country | Link |
|---|---|
| US (1) | US9411828B2 (en) |
| EP (1) | EP1883020B1 (en) |
| JP (1) | JP5210561B2 (en) |
| KR (1) | KR101402444B1 (en) |
| CN (1) | CN101114301B (en) |
| CA (1) | CA2595139C (en) |
Cited By (29)
| Publication number | Priority date | Publication date | Assignee | Title |
|---|---|---|---|---|
| US20060268100A1 (en) * | 2005-05-27 | 2006-11-30 | Minna Karukka | Mobile communications terminal and method therefore |
| US20080208819A1 (en) * | 2007-02-28 | 2008-08-28 | Microsoft Corporation | Gui based web search |
| US20100115457A1 (en) * | 2008-11-06 | 2010-05-06 | Jens Bombolowsky | Graphical user interface for displaying objects |
| US20100251139A1 (en) * | 2009-03-27 | 2010-09-30 | Michael Steffen Vance | Generating group based information displays via template information |
| US20100248701A1 (en) * | 2009-03-27 | 2010-09-30 | Michael Steffen Vance | Group based information displays |
| US20100250615A1 (en) * | 2007-05-01 | 2010-09-30 | Reghetti Joseph P | Systems and methods for differentiating and associating multiple drawings in a cad environment |
| US20100248755A1 (en) * | 2009-03-27 | 2010-09-30 | Michael Steffen Vance | Managing communications utilizing communication categories |
| US20100245262A1 (en) * | 2009-03-27 | 2010-09-30 | Michael Steffen Vance | Managing contact groups from subset of user contacts |
| US20100299635A1 (en) * | 2009-05-21 | 2010-11-25 | Lg Electronics Inc. | Method for executing menu in mobile terminal and mobile terminal using the same |
| US20110137892A1 (en) * | 2009-06-10 | 2011-06-09 | Dassault Systemes | Process, Program and Apparatus for Displaying an Assembly of Objects of a PLM Database |
| US20110179090A1 (en) * | 2010-01-21 | 2011-07-21 | Siemens Product Lifecycle Management Software Inc. | Product Lifecycle Management Using a Sparsely Populated Table |
| US8370769B2 (en) | 2005-06-10 | 2013-02-05 | T-Mobile Usa, Inc. | Variable path management of user contacts |
| WO2013033120A1 (en) * | 2011-08-29 | 2013-03-07 | Cockcroft Oliver N | Tablet web visual browsing |
| US8595649B2 (en) | 2005-06-10 | 2013-11-26 | T-Mobile Usa, Inc. | Preferred contact group centric interface |
| WO2014019077A1 (en) * | 2012-08-02 | 2014-02-06 | Tastefilter Inc. | Taste-based navigation at multiple levels of granularity |
| US20140068457A1 (en) * | 2008-12-31 | 2014-03-06 | Robert Taaffe Lindsay | Displaying demographic information of members discussing topics in a forum |
| US20150026159A1 (en) * | 2012-03-05 | 2015-01-22 | Evresearch Ltd | Digital Resource Set Integration Methods, Interfaces and Outputs |
| US20150242339A1 (en) * | 2014-02-21 | 2015-08-27 | International Business Machines Corporation | Management of writes in a tiered storage system |
| US9195966B2 (en) | 2009-03-27 | 2015-11-24 | T-Mobile Usa, Inc. | Managing contact groups from subset of user contacts |
| US9369542B2 (en) | 2009-03-27 | 2016-06-14 | T-Mobile Usa, Inc. | Network-based processing of data requests for contact information |
| US9521013B2 (en) | 2008-12-31 | 2016-12-13 | Facebook, Inc. | Tracking significant topics of discourse in forums |
| US20170041405A1 (en) * | 2014-01-27 | 2017-02-09 | Gigakorea Co., Ltd. | Method of providing number url service |
| US10177990B2 (en) | 2005-06-10 | 2019-01-08 | T-Mobile Usa, Inc. | Managing subset of user contacts |
| US10178519B2 (en) | 2005-06-10 | 2019-01-08 | T-Mobile Usa, Inc. | Variable path management of user contacts |
| US10733642B2 (en) | 2006-06-07 | 2020-08-04 | T-Mobile Usa, Inc. | Service management system that enables subscriber-driven changes to service plans |
| US10754524B2 (en) * | 2017-11-27 | 2020-08-25 | International Business Machines Corporation | Resizing of images with respect to a single point of convergence or divergence during zooming operations in a user interface |
| US10949906B2 (en) * | 2018-04-23 | 2021-03-16 | Ebay Inc. | Visual diagram searching |
| EP4213056A1 (en) * | 2022-01-14 | 2023-07-19 | Trimble Solutions Corporation | Adding details to a model in computer aided modeling |
| US11934852B1 (en) | 2022-11-30 | 2024-03-19 | Trimble Solutions Corporation | Providing help content proactively |
Families Citing this family (12)
| Publication number | Priority date | Publication date | Assignee | Title |
|---|---|---|---|---|
| EP1881458B1 (en) | 2006-07-21 | 2011-06-08 | Dassault Systèmes | Computer-implemented process for creating a parametric surface |
| EP1883020B1 (en) | 2006-07-28 | 2013-05-22 | Dassault Systèmes | Method and system for navigating in a database of a computer system |
| JP5215105B2 (en) * | 2008-09-30 | 2013-06-19 | オリンパスメディカルシステムズ株式会社 | Image display device, image display method, and image display program |
| AU2009322441B2 (en) | 2008-12-02 | 2016-07-28 | Ab Initio Technology Llc | Visualizing relationships between data elements |
| KR101675785B1 (en) | 2010-11-15 | 2016-11-14 | 삼성전자주식회사 | Method and apparatus for image searching using feature point |
| EP2660782B1 (en) | 2012-05-02 | 2019-04-10 | Dassault Systèmes | Designing a 3D modeled object |
| US9116603B2 (en) * | 2012-12-26 | 2015-08-25 | Ab Initio Technology Llc | Managing interactions with data having membership in multiple groupings |
| EP3038060B1 (en) | 2014-12-23 | 2021-09-15 | Dassault Systèmes | 3D modeled object defined by a grid of control points |
| EP3051446A1 (en) | 2015-02-02 | 2016-08-03 | Dassault Systèmes | Engraving a 2D image on a subdivision surface |
| JP6059313B2 (en) * | 2015-09-15 | 2017-01-11 | 京セラ株式会社 | Mobile device |
| US10346356B2 (en) * | 2016-01-22 | 2019-07-09 | Robert Bosch Gmbh | Methods and systems for searching computer-aided design data |
| JP7170638B2 (en) | 2016-12-01 | 2022-11-14 | アビニシオ テクノロジー エルエルシー | Generating, Accessing, and Displaying Lineage Metadata |
Citations (47)
| Publication number | Priority date | Publication date | Assignee | Title |
|---|---|---|---|---|
| US5682489A (en) * | 1991-06-04 | 1997-10-28 | Digital Equipment Corporation, Inc. | Method and device for monitoring, manipulating, and viewing system information |
| US5771280A (en) * | 1996-05-07 | 1998-06-23 | Mci Communication Corporation | Method of and apparatus for providing arbitrarily defined hierarchy maps depicting relative geographical information |
| US5835091A (en) * | 1996-08-21 | 1998-11-10 | International Business Machines Corporation | Manipulating and displaying a plurality of views in a graphical user interface |
| US5844795A (en) * | 1995-11-01 | 1998-12-01 | Allen Bradley Company, Llc | Diagnostic aid for industrial controller using multi-tasking architecture |
| US5874961A (en) * | 1997-03-19 | 1999-02-23 | International Business Machines Corporation | Scroll bar amplification apparatus and method |
| CA2247030A1 (en) * | 1998-09-11 | 2000-03-11 | Visual Insights, Inc. | Method and system for the interactive visualization and examination of data |
| US6345272B1 (en) * | 1999-07-27 | 2002-02-05 | Oracle Corporation | Rewriting queries to access materialized views that group along an ordered dimension |
| US20020063737A1 (en) * | 2000-11-30 | 2002-05-30 | Ephraim Feig | Zoom-capable scrollbar |
| US6400366B1 (en) * | 1998-09-14 | 2002-06-04 | Visual Insights, Inc. | Method and system for the interactive visualization and examination of data |
| US20020069137A1 (en) * | 2000-07-28 | 2002-06-06 | Yuzo Hiroshige | Method for recycle management of product |
| US20020152222A1 (en) * | 2000-11-15 | 2002-10-17 | Holbrook David M. | Apparatus and method for organizing and-or presenting data |
| US6480843B2 (en) * | 1998-11-03 | 2002-11-12 | Nec Usa, Inc. | Supporting web-query expansion efficiently using multi-granularity indexing and query processing |
| US6480836B1 (en) * | 1998-03-27 | 2002-11-12 | International Business Machines Corporation | System and method for determining and generating candidate views for a database |
| US20020184111A1 (en) * | 2001-02-07 | 2002-12-05 | Exalt Solutions, Inc. | Intelligent multimedia e-catalog |
| US20030088663A1 (en) * | 1996-07-18 | 2003-05-08 | Reuven Battat | Method and apparatus for predictively and graphically administering a network system in a time dimension |
| US6567812B1 (en) * | 2000-09-27 | 2003-05-20 | Siemens Aktiengesellschaft | Management of query result complexity using weighted criteria for hierarchical data structuring |
| US6571249B1 (en) * | 2000-09-27 | 2003-05-27 | Siemens Aktiengesellschaft | Management of query result complexity in hierarchical query result data structure using balanced space cubes |
| US6636853B1 (en) * | 1999-08-30 | 2003-10-21 | Morphism, Llc | Method and apparatus for representing and navigating search results |
| US6661437B1 (en) * | 1997-04-14 | 2003-12-09 | Thomson Licensing S.A. | Hierarchical menu graphical user interface |
| US20040083206A1 (en) * | 2002-10-25 | 2004-04-29 | Yuh-Cherng Wu | Navigation tool for exploring a knowledge base |
| US20040090472A1 (en) * | 2002-10-21 | 2004-05-13 | Risch John S. | Multidimensional structured data visualization method and apparatus, text visualization method and apparatus, method and apparatus for visualizing and graphically navigating the world wide web, method and apparatus for visualizing hierarchies |
| US20040103090A1 (en) * | 2000-09-19 | 2004-05-27 | Christian Dogl | Document search and analyzing method and apparatus |
| US20040150668A1 (en) * | 2003-01-31 | 2004-08-05 | Xerox Corporation | Secondary touch contextual sub-menu navigation for touch screen interface |
| US20040168107A1 (en) * | 2003-02-25 | 2004-08-26 | Sheet Dynamics, Ltd. | Graphical feedback of disparities in target designs in graphical development environment |
| US20040243662A1 (en) * | 2000-05-05 | 2004-12-02 | I-Tech Corporation | Indexing system for protocol analyzers |
| US20050018707A1 (en) * | 2002-10-31 | 2005-01-27 | Ciena Corporation | Method, system and storage medium for providing a cross connect user interface |
| US20050076309A1 (en) * | 2003-10-03 | 2005-04-07 | Kevin Goldsmith | Hierarchical in-place menus |
| US20050076312A1 (en) * | 2003-10-03 | 2005-04-07 | Gardner Douglas L. | Hierarchical, multilevel, expand and collapse navigation aid for hierarchical structures |
| US20050086611A1 (en) * | 2003-04-21 | 2005-04-21 | Masaaki Takabe | Display method and display device |
| US20050222901A1 (en) * | 2004-03-31 | 2005-10-06 | Sumit Agarwal | Determining ad targeting information and/or ad creative information using past search queries |
| US20060095858A1 (en) * | 2004-10-29 | 2006-05-04 | Hewlett-Packard Development Company, L.P. | Hierarchical dataset dashboard view |
| US20060167864A1 (en) * | 1999-12-08 | 2006-07-27 | Bailey David R | Search engine system for locating web pages with product offerings |
| US20060195431A1 (en) * | 2005-02-16 | 2006-08-31 | Richard Holzgrafe | Document aspect system and method |
| US20060224996A1 (en) * | 2005-04-01 | 2006-10-05 | Zeno Rummler | Methods and systems for simplified point-and-click data entry |
| US20060265315A1 (en) * | 1999-04-09 | 2006-11-23 | Trading Technologies International, Inc. | User interface for semi-fungible trading |
| US7191411B2 (en) * | 2002-06-06 | 2007-03-13 | Moehrle Armin E | Active path menu navigation system |
| US20070157090A1 (en) * | 2005-12-29 | 2007-07-05 | Tobias Haug | Timescale selection window for temporal selection in computer applications |
| US20070192695A1 (en) * | 2006-02-16 | 2007-08-16 | Grotjohn David K | Enhanced visualization and selection of multi-layered elements in a containment hierarchy |
| US20070214169A1 (en) * | 2001-10-15 | 2007-09-13 | Mathieu Audet | Multi-dimensional locating system and method |
| US7310652B1 (en) * | 2005-08-08 | 2007-12-18 | At&T Corp. | Method and apparatus for managing hierarchical collections of data |
| US7426696B1 (en) * | 2005-07-15 | 2008-09-16 | Minerva Networks, Inc. | Method and system for image windowing |
| US7486274B2 (en) * | 2005-08-18 | 2009-02-03 | Mitsubishi Electric Research Laboratories, Inc. | Method for stabilizing and precisely locating pointers generated by handheld direct pointing devices |
| US7716586B2 (en) * | 2006-02-17 | 2010-05-11 | International Business Machines Corporation | Apparatus, system, and method for progressively disclosing information in support of information technology system visualization and management |
| US7735018B2 (en) * | 2005-09-13 | 2010-06-08 | Spacetime3D, Inc. | System and method for providing three-dimensional graphical user interface |
| US7802203B2 (en) * | 2005-12-23 | 2010-09-21 | Sap Ag | Method for providing selectable alternate menu views |
| US8127229B2 (en) * | 2004-08-31 | 2012-02-28 | Access Co., Ltd. | Controlling focus, and movement of the focus, between focus items in a multi-frame document |
| US8640050B2 (en) * | 2005-05-19 | 2014-01-28 | Thomson Licensing | Method of selecting items and functions by displaying a specific icon, and device implementing the method |
Family Cites Families (41)
| Publication number | Priority date | Publication date | Assignee | Title |
|---|---|---|---|---|
| JPH0652472B2 (en) * | 1984-07-23 | 1994-07-06 | インターナショナル・ビジネス・マシーンズ・コーポレーション | Image processing method |
| US5265014A (en) * | 1990-04-10 | 1993-11-23 | Hewlett-Packard Company | Multi-modal user interface |
| US5305435A (en) * | 1990-07-17 | 1994-04-19 | Hewlett-Packard Company | Computer windows management system and method for simulating off-screen document storage and retrieval |
| US5440348A (en) * | 1993-04-16 | 1995-08-08 | Avid Technology, Inc. | Method and user interface for creating, specifying and adjusting motion picture transitions |
| US5565888A (en) * | 1995-02-17 | 1996-10-15 | International Business Machines Corporation | Method and apparatus for improving visibility and selectability of icons |
| US5790819A (en) * | 1995-07-14 | 1998-08-04 | International Business Machines Corporation | Mechanism for fine-grained and coarse-grained control of zooming in a display of a one-dimensional data set |
| US6121969A (en) * | 1997-07-29 | 2000-09-19 | The Regents Of The University Of California | Visual navigation in perceptual databases |
| US6351765B1 (en) * | 1998-03-09 | 2002-02-26 | Media 100, Inc. | Nonlinear video editing system |
| US6141699A (en) * | 1998-05-11 | 2000-10-31 | International Business Machines Corporation | Interactive display system for sequential retrieval and display of a plurality of interrelated data sets |
| JP2000105772A (en) * | 1998-07-28 | 2000-04-11 | Sharp Corp | Information managing device |
| US6243093B1 (en) * | 1998-09-14 | 2001-06-05 | Microsoft Corporation | Methods, apparatus and data structures for providing a user interface, which exploits spatial memory in three-dimensions, to objects and which visually groups matching objects |
| JP4153108B2 (en) * | 1998-10-29 | 2008-09-17 | 富士フイルム株式会社 | Image processing method, image processing apparatus, and recording medium |
| US6879322B2 (en) * | 2000-05-30 | 2005-04-12 | Fujitsu Limited | Three-dimensional object display system, three-dimensional object display method and recording medium recording a three-dimensional object display program |
| US6535888B1 (en) * | 2000-07-19 | 2003-03-18 | Oxelis, Inc. | Method and system for providing a visual search directory |
| US20020078019A1 (en) * | 2000-10-02 | 2002-06-20 | Lawton Scott S. | Method and system for organizing search results into a single page showing two levels of detail |
| US20020078022A1 (en) * | 2000-10-02 | 2002-06-20 | Lawton Scott S. | Enhanced method and system for viewing any search result without returning to the result list |
| US6785676B2 (en) * | 2001-02-07 | 2004-08-31 | International Business Machines Corporation | Customer self service subsystem for response set ordering and annotation |
| US6701311B2 (en) * | 2001-02-07 | 2004-03-02 | International Business Machines Corporation | Customer self service system for resource search and selection |
| US20040030741A1 (en) * | 2001-04-02 | 2004-02-12 | Wolton Richard Ernest | Method and apparatus for search, visual navigation, analysis and retrieval of information from networks with remote notification and content delivery |
| JP2002312402A (en) * | 2001-04-11 | 2002-10-25 | Ricoh Co Ltd | Document browsing system |
| US7425963B2 (en) * | 2001-07-16 | 2008-09-16 | Hewlett-Packard Development Company, L.P. | Hierarchical image feature-based visualization |
| US7461077B1 (en) * | 2001-07-31 | 2008-12-02 | Nicholas Greenwood | Representation of data records |
| US7487462B2 (en) * | 2002-02-21 | 2009-02-03 | Xerox Corporation | Methods and systems for indicating invisible contents of workspace |
| US7080059B1 (en) * | 2002-05-13 | 2006-07-18 | Quasm Corporation | Search and presentation engine |
| JP2004038699A (en) * | 2002-07-05 | 2004-02-05 | Fuji Photo Film Co Ltd | Device for retrieving image database |
| US8230359B2 (en) * | 2003-02-25 | 2012-07-24 | Microsoft Corporation | System and method that facilitates computer desktop use via scaling of displayed objects with shifts to the periphery |
| US8775330B2 (en) * | 2003-06-23 | 2014-07-08 | International Business Machines Corporation | Establishing a data management fee structure based on fine grained data entities |
| US20050111746A1 (en) * | 2003-11-26 | 2005-05-26 | Kumar Bharath S. | Progressive medical image volume navigation |
| JP2005173938A (en) * | 2003-12-10 | 2005-06-30 | Pioneer Electronic Corp | Musical piece search device, method and program and information recording media |
| WO2005109886A2 (en) * | 2004-04-30 | 2005-11-17 | Vulcan Inc. | Controlling one or more media devices |
| WO2005109904A2 (en) * | 2004-04-30 | 2005-11-17 | Vulcan, Inc. | Maintaining a graphical user interface state that is based on a selected type of content |
| CA2566453C (en) * | 2004-05-12 | 2012-07-10 | Redsky Mobile Inc. | Navigation of an n-dimensional hierarchical structure using a 2-dimensional controller |
| EP1612697A1 (en) * | 2004-06-28 | 2006-01-04 | Dassault Systèmes | A graphical method for navigating in a database of modelled objects |
| US7711813B1 (en) * | 2004-06-29 | 2010-05-04 | Emc Corporation | Methods and apparatus for displaying storage resources |
| US20090204938A1 (en) * | 2004-09-15 | 2009-08-13 | Visual I/O | System and method for systematically arranging a set of display elements in assemblages to meaningfully represent data |
| US20060092770A1 (en) * | 2004-10-30 | 2006-05-04 | Demas Theodore J | Information displays and methods associated therewith |
| CA2531132C (en) * | 2004-12-20 | 2013-04-02 | Arnaud Nonclercq | Method and system for graphically navigating among stored objects |
| CN101160558A (en) * | 2004-12-21 | 2008-04-09 | 达特查特系统公司 | Multicultural and multimedia data collection and documentation computer system, apparatus and method |
| US7644373B2 (en) * | 2006-01-23 | 2010-01-05 | Microsoft Corporation | User interface for viewing clusters of images |
| EP1883020B1 (en) | 2006-07-28 | 2013-05-22 | Dassault Systèmes | Method and system for navigating in a database of a computer system |
| JP2008263248A (en) | 2008-08-07 | 2008-10-30 | Sumitomo Electric Ind Ltd | Mounting member of semiconductor light-emitting element, and method of manufacturing the same |
-
2006
- 2006-07-28 EP EP06015755.9A patent/EP1883020B1/en active Active
-
2007
- 2007-07-18 JP JP2007187569A patent/JP5210561B2/en active Active
- 2007-07-26 US US11/828,691 patent/US9411828B2/en active Active
- 2007-07-27 CA CA2595139A patent/CA2595139C/en active Active
- 2007-07-27 CN CN200710136746.5A patent/CN101114301B/en active Active
- 2007-07-27 KR KR1020070075983A patent/KR101402444B1/en active IP Right Grant
Patent Citations (53)
| Publication number | Priority date | Publication date | Assignee | Title |
|---|---|---|---|---|
| US5682489A (en) * | 1991-06-04 | 1997-10-28 | Digital Equipment Corporation, Inc. | Method and device for monitoring, manipulating, and viewing system information |
| US5844795A (en) * | 1995-11-01 | 1998-12-01 | Allen Bradley Company, Llc | Diagnostic aid for industrial controller using multi-tasking architecture |
| US5771280A (en) * | 1996-05-07 | 1998-06-23 | Mci Communication Corporation | Method of and apparatus for providing arbitrarily defined hierarchy maps depicting relative geographical information |
| US20030088663A1 (en) * | 1996-07-18 | 2003-05-08 | Reuven Battat | Method and apparatus for predictively and graphically administering a network system in a time dimension |
| US5835091A (en) * | 1996-08-21 | 1998-11-10 | International Business Machines Corporation | Manipulating and displaying a plurality of views in a graphical user interface |
| US5874961A (en) * | 1997-03-19 | 1999-02-23 | International Business Machines Corporation | Scroll bar amplification apparatus and method |
| US6661437B1 (en) * | 1997-04-14 | 2003-12-09 | Thomson Licensing S.A. | Hierarchical menu graphical user interface |
| US6480836B1 (en) * | 1998-03-27 | 2002-11-12 | International Business Machines Corporation | System and method for determining and generating candidate views for a database |
| US6594653B2 (en) * | 1998-03-27 | 2003-07-15 | International Business Machines Corporation | Server integrated system and methods for processing precomputed views |
| CA2247030A1 (en) * | 1998-09-11 | 2000-03-11 | Visual Insights, Inc. | Method and system for the interactive visualization and examination of data |
| US6400366B1 (en) * | 1998-09-14 | 2002-06-04 | Visual Insights, Inc. | Method and system for the interactive visualization and examination of data |
| US6480843B2 (en) * | 1998-11-03 | 2002-11-12 | Nec Usa, Inc. | Supporting web-query expansion efficiently using multi-granularity indexing and query processing |
| US20060265315A1 (en) * | 1999-04-09 | 2006-11-23 | Trading Technologies International, Inc. | User interface for semi-fungible trading |
| US6345272B1 (en) * | 1999-07-27 | 2002-02-05 | Oracle Corporation | Rewriting queries to access materialized views that group along an ordered dimension |
| US6636853B1 (en) * | 1999-08-30 | 2003-10-21 | Morphism, Llc | Method and apparatus for representing and navigating search results |
| US20060167864A1 (en) * | 1999-12-08 | 2006-07-27 | Bailey David R | Search engine system for locating web pages with product offerings |
| US20040243662A1 (en) * | 2000-05-05 | 2004-12-02 | I-Tech Corporation | Indexing system for protocol analyzers |
| US20020069137A1 (en) * | 2000-07-28 | 2002-06-06 | Yuzo Hiroshige | Method for recycle management of product |
| US20040103090A1 (en) * | 2000-09-19 | 2004-05-27 | Christian Dogl | Document search and analyzing method and apparatus |
| US6567812B1 (en) * | 2000-09-27 | 2003-05-20 | Siemens Aktiengesellschaft | Management of query result complexity using weighted criteria for hierarchical data structuring |
| US6571249B1 (en) * | 2000-09-27 | 2003-05-27 | Siemens Aktiengesellschaft | Management of query result complexity in hierarchical query result data structure using balanced space cubes |
| US20020152222A1 (en) * | 2000-11-15 | 2002-10-17 | Holbrook David M. | Apparatus and method for organizing and-or presenting data |
| US20020063737A1 (en) * | 2000-11-30 | 2002-05-30 | Ephraim Feig | Zoom-capable scrollbar |
| US20020184111A1 (en) * | 2001-02-07 | 2002-12-05 | Exalt Solutions, Inc. | Intelligent multimedia e-catalog |
| US20070214169A1 (en) * | 2001-10-15 | 2007-09-13 | Mathieu Audet | Multi-dimensional locating system and method |
| US7191411B2 (en) * | 2002-06-06 | 2007-03-13 | Moehrle Armin E | Active path menu navigation system |
| US20080276201A1 (en) * | 2002-10-21 | 2008-11-06 | Risch John S | Multidimensional Structured Data Visualization Method and Apparatus, Text Visualization Method and Apparatus, Method and Apparatus for Visualizing and Graphically Navigating the World Wide Web, Method and Apparatus for Visualizing Hierarchies |
| US7373612B2 (en) * | 2002-10-21 | 2008-05-13 | Battelle Memorial Institute | Multidimensional structured data visualization method and apparatus, text visualization method and apparatus, method and apparatus for visualizing and graphically navigating the world wide web, method and apparatus for visualizing hierarchies |
| US20040090472A1 (en) * | 2002-10-21 | 2004-05-13 | Risch John S. | Multidimensional structured data visualization method and apparatus, text visualization method and apparatus, method and apparatus for visualizing and graphically navigating the world wide web, method and apparatus for visualizing hierarchies |
| US20040083206A1 (en) * | 2002-10-25 | 2004-04-29 | Yuh-Cherng Wu | Navigation tool for exploring a knowledge base |
| US20050018707A1 (en) * | 2002-10-31 | 2005-01-27 | Ciena Corporation | Method, system and storage medium for providing a cross connect user interface |
| US20040150668A1 (en) * | 2003-01-31 | 2004-08-05 | Xerox Corporation | Secondary touch contextual sub-menu navigation for touch screen interface |
| US20040168107A1 (en) * | 2003-02-25 | 2004-08-26 | Sheet Dynamics, Ltd. | Graphical feedback of disparities in target designs in graphical development environment |
| US20050086611A1 (en) * | 2003-04-21 | 2005-04-21 | Masaaki Takabe | Display method and display device |
| US20050076312A1 (en) * | 2003-10-03 | 2005-04-07 | Gardner Douglas L. | Hierarchical, multilevel, expand and collapse navigation aid for hierarchical structures |
| US20050076309A1 (en) * | 2003-10-03 | 2005-04-07 | Kevin Goldsmith | Hierarchical in-place menus |
| US7418670B2 (en) * | 2003-10-03 | 2008-08-26 | Microsoft Corporation | Hierarchical in-place menus |
| US20050222901A1 (en) * | 2004-03-31 | 2005-10-06 | Sumit Agarwal | Determining ad targeting information and/or ad creative information using past search queries |
| US8127229B2 (en) * | 2004-08-31 | 2012-02-28 | Access Co., Ltd. | Controlling focus, and movement of the focus, between focus items in a multi-frame document |
| US7827499B2 (en) * | 2004-10-29 | 2010-11-02 | Hewlett-Packard Development Company, L.P. | Hierarchical dataset dashboard view |
| US20060095858A1 (en) * | 2004-10-29 | 2006-05-04 | Hewlett-Packard Development Company, L.P. | Hierarchical dataset dashboard view |
| US7840564B2 (en) * | 2005-02-16 | 2010-11-23 | Ebrary | System and method for automatic anthology creation using document aspects |
| US20060195431A1 (en) * | 2005-02-16 | 2006-08-31 | Richard Holzgrafe | Document aspect system and method |
| US20060224996A1 (en) * | 2005-04-01 | 2006-10-05 | Zeno Rummler | Methods and systems for simplified point-and-click data entry |
| US8640050B2 (en) * | 2005-05-19 | 2014-01-28 | Thomson Licensing | Method of selecting items and functions by displaying a specific icon, and device implementing the method |
| US7426696B1 (en) * | 2005-07-15 | 2008-09-16 | Minerva Networks, Inc. | Method and system for image windowing |
| US7310652B1 (en) * | 2005-08-08 | 2007-12-18 | At&T Corp. | Method and apparatus for managing hierarchical collections of data |
| US7486274B2 (en) * | 2005-08-18 | 2009-02-03 | Mitsubishi Electric Research Laboratories, Inc. | Method for stabilizing and precisely locating pointers generated by handheld direct pointing devices |
| US7735018B2 (en) * | 2005-09-13 | 2010-06-08 | Spacetime3D, Inc. | System and method for providing three-dimensional graphical user interface |
| US7802203B2 (en) * | 2005-12-23 | 2010-09-21 | Sap Ag | Method for providing selectable alternate menu views |
| US20070157090A1 (en) * | 2005-12-29 | 2007-07-05 | Tobias Haug | Timescale selection window for temporal selection in computer applications |
| US20070192695A1 (en) * | 2006-02-16 | 2007-08-16 | Grotjohn David K | Enhanced visualization and selection of multi-layered elements in a containment hierarchy |
| US7716586B2 (en) * | 2006-02-17 | 2010-05-11 | International Business Machines Corporation | Apparatus, system, and method for progressively disclosing information in support of information technology system visualization and management |
Non-Patent Citations (5)
| Title |
|---|
| bing search q=3%20dimensional%20product%20query& 4-14-2016 * |
| bing search q=3%20dimensional%20product%20search 4-14-2016 * |
| bing search q=3%20dimensional%20query%20fine%20c 4-14-2016 * |
| bing search q=3%20dimensional%20search%20fine%20 4-14-2016 * |
| bing search q=3d+product+search&src=IE-SearchBox 4-14-2016 * |
Cited By (69)
| Publication number | Priority date | Publication date | Assignee | Title |
|---|---|---|---|---|
| US7797641B2 (en) * | 2005-05-27 | 2010-09-14 | Nokia Corporation | Mobile communications terminal and method therefore |
| US20060268100A1 (en) * | 2005-05-27 | 2006-11-30 | Minna Karukka | Mobile communications terminal and method therefore |
| US10191623B2 (en) | 2005-06-10 | 2019-01-29 | T-Mobile Usa, Inc. | Variable path management of user contacts |
| US8826160B2 (en) | 2005-06-10 | 2014-09-02 | T-Mobile Usa, Inc. | Preferred contact group centric interface |
| US10178519B2 (en) | 2005-06-10 | 2019-01-08 | T-Mobile Usa, Inc. | Variable path management of user contacts |
| US8893041B2 (en) | 2005-06-10 | 2014-11-18 | T-Mobile Usa, Inc. | Preferred contact group centric interface |
| US11564068B2 (en) | 2005-06-10 | 2023-01-24 | Amazon Technologies, Inc. | Variable path management of user contacts |
| US10969932B2 (en) | 2005-06-10 | 2021-04-06 | T-Moblle USA, Inc. | Preferred contact group centric interface |
| US8775956B2 (en) | 2005-06-10 | 2014-07-08 | T-Mobile Usa, Inc. | Preferred contact group centric interface |
| US9304659B2 (en) | 2005-06-10 | 2016-04-05 | T-Mobile Usa, Inc. | Preferred contact group centric interface |
| US8370769B2 (en) | 2005-06-10 | 2013-02-05 | T-Mobile Usa, Inc. | Variable path management of user contacts |
| US8954891B2 (en) | 2005-06-10 | 2015-02-10 | T-Mobile Usa, Inc. | Preferred contact group centric interface |
| US8595649B2 (en) | 2005-06-10 | 2013-11-26 | T-Mobile Usa, Inc. | Preferred contact group centric interface |
| US10177990B2 (en) | 2005-06-10 | 2019-01-08 | T-Mobile Usa, Inc. | Managing subset of user contacts |
| US10459601B2 (en) | 2005-06-10 | 2019-10-29 | T-Moblie Usa, Inc. | Preferred contact group centric interface |
| US10733642B2 (en) | 2006-06-07 | 2020-08-04 | T-Mobile Usa, Inc. | Service management system that enables subscriber-driven changes to service plans |
| US8949215B2 (en) * | 2007-02-28 | 2015-02-03 | Microsoft Corporation | GUI based web search |
| US20080208819A1 (en) * | 2007-02-28 | 2008-08-28 | Microsoft Corporation | Gui based web search |
| US20100250615A1 (en) * | 2007-05-01 | 2010-09-30 | Reghetti Joseph P | Systems and methods for differentiating and associating multiple drawings in a cad environment |
| US8554520B2 (en) * | 2007-05-01 | 2013-10-08 | Auto Prep, Llc | Systems and methods for differentiating and associating multiple drawings in a CAD environment |
| US8612875B2 (en) | 2008-11-06 | 2013-12-17 | Sap Ag | Graphical user interface for displaying objects |
| US20100115457A1 (en) * | 2008-11-06 | 2010-05-06 | Jens Bombolowsky | Graphical user interface for displaying objects |
| US7752565B2 (en) * | 2008-11-06 | 2010-07-06 | Sap Ag | Graphical user interface for displaying objects |
| US20100235790A1 (en) * | 2008-11-06 | 2010-09-16 | Jens Bombolowsky | Graphical user interface for displaying objects |
| US10275413B2 (en) | 2008-12-31 | 2019-04-30 | Facebook, Inc. | Tracking significant topics of discourse in forums |
| US20140068457A1 (en) * | 2008-12-31 | 2014-03-06 | Robert Taaffe Lindsay | Displaying demographic information of members discussing topics in a forum |
| US9826005B2 (en) * | 2008-12-31 | 2017-11-21 | Facebook, Inc. | Displaying demographic information of members discussing topics in a forum |
| US9521013B2 (en) | 2008-12-31 | 2016-12-13 | Facebook, Inc. | Tracking significant topics of discourse in forums |
| US8577350B2 (en) | 2009-03-27 | 2013-11-05 | T-Mobile Usa, Inc. | Managing communications utilizing communication categories |
| US9369542B2 (en) | 2009-03-27 | 2016-06-14 | T-Mobile Usa, Inc. | Network-based processing of data requests for contact information |
| US20100251139A1 (en) * | 2009-03-27 | 2010-09-30 | Michael Steffen Vance | Generating group based information displays via template information |
| US10510008B2 (en) | 2009-03-27 | 2019-12-17 | T-Mobile Usa, Inc. | Group based information displays |
| US9160828B2 (en) | 2009-03-27 | 2015-10-13 | T-Mobile Usa, Inc. | Managing communications utilizing communication categories |
| US10771605B2 (en) | 2009-03-27 | 2020-09-08 | T-Mobile Usa, Inc. | Managing contact groups from subset of user contacts |
| US9195966B2 (en) | 2009-03-27 | 2015-11-24 | T-Mobile Usa, Inc. | Managing contact groups from subset of user contacts |
| US9210247B2 (en) * | 2009-03-27 | 2015-12-08 | T-Mobile Usa, Inc. | Managing contact groups from subset of user contacts |
| US20160088139A1 (en) * | 2009-03-27 | 2016-03-24 | T-Mobile Usa, Inc. | Managing contact groups from subset of user contacts |
| US20100248701A1 (en) * | 2009-03-27 | 2010-09-30 | Michael Steffen Vance | Group based information displays |
| US9355382B2 (en) | 2009-03-27 | 2016-05-31 | T-Mobile Usa, Inc. | Group based information displays |
| US10972597B2 (en) * | 2009-03-27 | 2021-04-06 | T-Mobile Usa, Inc. | Managing executable component groups from subset of user executable components |
| US20100245262A1 (en) * | 2009-03-27 | 2010-09-30 | Michael Steffen Vance | Managing contact groups from subset of user contacts |
| US20100248755A1 (en) * | 2009-03-27 | 2010-09-30 | Michael Steffen Vance | Managing communications utilizing communication categories |
| US11222045B2 (en) | 2009-03-27 | 2022-01-11 | T-Mobile Usa, Inc. | Network-based processing of data requests for contact information |
| US11010678B2 (en) | 2009-03-27 | 2021-05-18 | T-Mobile Usa, Inc. | Group based information displays |
| US8893025B2 (en) | 2009-03-27 | 2014-11-18 | T-Mobile Usa, Inc. | Generating group based information displays via template information |
| US9886487B2 (en) | 2009-03-27 | 2018-02-06 | T-Mobile Usa, Inc. | Managing contact groups from subset of user contacts |
| US10021231B2 (en) * | 2009-03-27 | 2018-07-10 | T-Mobile Usa, Inc. | Managing contact groups from subset of user contacts |
| US8843854B2 (en) * | 2009-05-21 | 2014-09-23 | Lg Electronics Inc. | Method for executing menu in mobile terminal and mobile terminal using the same |
| US20100299635A1 (en) * | 2009-05-21 | 2010-11-25 | Lg Electronics Inc. | Method for executing menu in mobile terminal and mobile terminal using the same |
| US9158865B2 (en) * | 2009-06-10 | 2015-10-13 | Dassault Systemes | Process, program and apparatus for displaying an assembly of objects of a PLM database |
| US20110137892A1 (en) * | 2009-06-10 | 2011-06-09 | Dassault Systemes | Process, Program and Apparatus for Displaying an Assembly of Objects of a PLM Database |
| US20110179090A1 (en) * | 2010-01-21 | 2011-07-21 | Siemens Product Lifecycle Management Software Inc. | Product Lifecycle Management Using a Sparsely Populated Table |
| WO2013033120A1 (en) * | 2011-08-29 | 2013-03-07 | Cockcroft Oliver N | Tablet web visual browsing |
| US9459767B2 (en) | 2011-08-29 | 2016-10-04 | Ebay Inc. | Tablet web visual browsing |
| AU2012302093B2 (en) * | 2011-08-29 | 2015-10-08 | Ebay Inc. | Tablet web visual browsing |
| US20150026159A1 (en) * | 2012-03-05 | 2015-01-22 | Evresearch Ltd | Digital Resource Set Integration Methods, Interfaces and Outputs |
| WO2014019077A1 (en) * | 2012-08-02 | 2014-02-06 | Tastefilter Inc. | Taste-based navigation at multiple levels of granularity |
| US10091308B2 (en) * | 2014-01-27 | 2018-10-02 | Gigakorea Co., Ltd. | Method of providing number URL service |
| US20170041405A1 (en) * | 2014-01-27 | 2017-02-09 | Gigakorea Co., Ltd. | Method of providing number url service |
| US10649673B2 (en) | 2014-02-21 | 2020-05-12 | International Business Machines Corporation | Queuing read requests based on write requests |
| US10346061B2 (en) | 2014-02-21 | 2019-07-09 | International Business Machines Corporation | Data access to a storage tier on a client in a multi-tiered storage system |
| US9535856B2 (en) * | 2014-02-21 | 2017-01-03 | International Business Machines Corporation | Data access to a storage tier on a client in a multi-tiered storage system |
| US20150242339A1 (en) * | 2014-02-21 | 2015-08-27 | International Business Machines Corporation | Management of writes in a tiered storage system |
| US10754523B2 (en) * | 2017-11-27 | 2020-08-25 | International Business Machines Corporation | Resizing of images with respect to a single point of convergence or divergence during zooming operations in a user interface |
| US10754524B2 (en) * | 2017-11-27 | 2020-08-25 | International Business Machines Corporation | Resizing of images with respect to a single point of convergence or divergence during zooming operations in a user interface |
| US10949906B2 (en) * | 2018-04-23 | 2021-03-16 | Ebay Inc. | Visual diagram searching |
| US11682059B2 (en) | 2018-04-23 | 2023-06-20 | Ebay Inc. | Method, computer readable storage devices, and computer device for mapping visual diagram portions to parts listing information |
| EP4213056A1 (en) * | 2022-01-14 | 2023-07-19 | Trimble Solutions Corporation | Adding details to a model in computer aided modeling |
| US11934852B1 (en) | 2022-11-30 | 2024-03-19 | Trimble Solutions Corporation | Providing help content proactively |
Also Published As
| Publication number | Publication date |
|---|---|
| KR101402444B1 (en) | 2014-06-03 |
| JP2008059563A (en) | 2008-03-13 |
| JP5210561B2 (en) | 2013-06-12 |
| CN101114301A (en) | 2008-01-30 |
| US9411828B2 (en) | 2016-08-09 |
| EP1883020A1 (en) | 2008-01-30 |
| CA2595139C (en) | 2015-10-27 |
| CN101114301B (en) | 2015-07-15 |
| EP1883020B1 (en) | 2013-05-22 |
| KR20080011130A (en) | 2008-01-31 |
| CA2595139A1 (en) | 2008-01-28 |
Similar Documents
| Publication | Publication Date | Title |
|---|---|---|
| US9411828B2 (en) | Method and system for navigating in a database of a computer system | |
| US7475072B1 (en) | Context-based search visualization and context management using neural networks | |
| US7721192B2 (en) | User interface for a resource search tool | |
| US5842203A (en) | Method and system for performing non-boolean search queries in a graphical user interface | |
| US9805124B2 (en) | Automatic generation of a collection of content | |
| JP4945708B2 (en) | Computer input control to specify ranges by explicit exclusion | |
| US7428705B2 (en) | Web map tool | |
| JP3309066B2 (en) | Computer system, method and program for constructing statement | |
| KR101950529B1 (en) | Methods for electronic document searching and graphically representing electronic document searches | |
| JP4378292B2 (en) | File system shell | |
| US8732621B2 (en) | Method and apparatus for information visualized expression, and visualized human computer interactive expression interface thereof | |
| US20020075312A1 (en) | Displaying graphical information and user selected properties on a computer interface | |
| JP2006053926A (en) | System and method of displaying content on compact screen computing device | |
| US7774345B2 (en) | Lightweight list collection | |
| KR20110099225A (en) | Previewing search results for suggested refinement terms and vertical searches | |
| KR20070058517A (en) | File system shell | |
| CA2736493A1 (en) | Displaying menu for accessing hierarchial content data including caching multiple menu states | |
| US7565374B2 (en) | Database visualization and searching | |
| JP2004302981A (en) | Electronic data management system | |
| KR101176317B1 (en) | Searched information arrangement method with correlation between search query and searched information | |
| US20030156139A1 (en) | Apparatus, system and method for design support | |
| JP2006048521A (en) | Document retrieval device, its control method, and control program | |
| JP2002251417A (en) | Information processing device, design support system, program, design support information display method, and storage medium | |
| Karadayi | VAS (Visual Analysis System): An information visualization engine to interpret World Wide Web structure |
Legal Events
| Date | Code | Title | Description |
|---|---|---|---|
| AS | Assignment |
Owner name: DASSAULT SYSTEMES, FRANCE Free format text: ASSIGNMENT OF ASSIGNORS INTEREST;ASSIGNORS:DELARUE, GUILLAUME;MINH VU, DUY;GICQUEL, GUENOLE;REEL/FRAME:020410/0033;SIGNING DATES FROM 20071213 TO 20080107 Owner name: DASSAULT SYSTEMES, FRANCE Free format text: ASSIGNMENT OF ASSIGNORS INTEREST;ASSIGNORS:DELARUE, GUILLAUME;MINH VU, DUY;GICQUEL, GUENOLE;SIGNING DATES FROM 20071213 TO 20080107;REEL/FRAME:020410/0033 |
|
| FEPP | Fee payment procedure |
Free format text: PAYOR NUMBER ASSIGNED (ORIGINAL EVENT CODE: ASPN); ENTITY STATUS OF PATENT OWNER: LARGE ENTITY |
|
| STCF | Information on status: patent grant |
Free format text: PATENTED CASE |
|
| CC | Certificate of correction | ||
| MAFP | Maintenance fee payment |
Free format text: PAYMENT OF MAINTENANCE FEE, 4TH YEAR, LARGE ENTITY (ORIGINAL EVENT CODE: M1551); ENTITY STATUS OF PATENT OWNER: LARGE ENTITY Year of fee payment: 4 |
|
| MAFP | Maintenance fee payment |
Free format text: PAYMENT OF MAINTENANCE FEE, 8TH YEAR, LARGE ENTITY (ORIGINAL EVENT CODE: M1552); ENTITY STATUS OF PATENT OWNER: LARGE ENTITY Year of fee payment: 8 |