EP1677458A1 - Methods for determining the adjacency of access points in a wireless network - Google Patents
Methods for determining the adjacency of access points in a wireless network Download PDFInfo
- Publication number
- EP1677458A1 EP1677458A1 EP05257701A EP05257701A EP1677458A1 EP 1677458 A1 EP1677458 A1 EP 1677458A1 EP 05257701 A EP05257701 A EP 05257701A EP 05257701 A EP05257701 A EP 05257701A EP 1677458 A1 EP1677458 A1 EP 1677458A1
- Authority
- EP
- European Patent Office
- Prior art keywords
- signal quality
- aps
- wlan
- indicators
- mobile device
- Prior art date
- Legal status (The legal status is an assumption and is not a legal conclusion. Google has not performed a legal analysis and makes no representation as to the accuracy of the status listed.)
- Ceased
Links
- 238000000034 method Methods 0.000 title claims description 14
- 230000005540 biological transmission Effects 0.000 claims description 45
- 238000012935 Averaging Methods 0.000 claims 2
Images

Classifications
-
- H—ELECTRICITY
- H04—ELECTRIC COMMUNICATION TECHNIQUE
- H04W—WIRELESS COMMUNICATION NETWORKS
- H04W16/00—Network planning, e.g. coverage or traffic planning tools; Network deployment, e.g. resource partitioning or cells structures
- H04W16/18—Network planning tools
-
- H—ELECTRICITY
- H04—ELECTRIC COMMUNICATION TECHNIQUE
- H04W—WIRELESS COMMUNICATION NETWORKS
- H04W16/00—Network planning, e.g. coverage or traffic planning tools; Network deployment, e.g. resource partitioning or cells structures
-
- H—ELECTRICITY
- H04—ELECTRIC COMMUNICATION TECHNIQUE
- H04W—WIRELESS COMMUNICATION NETWORKS
- H04W84/00—Network topologies
- H04W84/02—Hierarchically pre-organised networks, e.g. paging networks, cellular networks, WLAN [Wireless Local Area Network] or WLL [Wireless Local Loop]
- H04W84/10—Small scale networks; Flat hierarchical networks
- H04W84/12—WLAN [Wireless Local Area Networks]
-
- H—ELECTRICITY
- H04—ELECTRIC COMMUNICATION TECHNIQUE
- H04W—WIRELESS COMMUNICATION NETWORKS
- H04W88/00—Devices specially adapted for wireless communication networks, e.g. terminals, base stations or access point devices
- H04W88/08—Access point devices
Definitions
- a wireless local area network is typically made up of a number of "access points" (APs). Each access point is responsible for transmitting information to a plurality of mobile devices (e.g., wireless laptop computer, etc.) that are within the transmission range of the AP.
- the area within which a mobile device can effectively receive a wireless transmission from an AP is called the coverage area of an AP.
- a mobile device may be able to receive a transmission from one or more APs.
- a mobile device may be able to receive a transmission from more than one AP, the signal strength of each transmission may not be the same.
- a transmission a mobile device receives from one AP may have a high signal-to-noise ratio (SNR) while the transmission the mobile device receives from another AP may have a low SNR.
- SNR signal-to-noise ratio
- a mobile device will decide which AP or APs to communicate with. Knowledge of the coverage areas of APs aids in this decision-making process. It is, therefore, desirable to be able to determine the extent to which coverage areas of APs overlap or share common coverage points.
- the present inventors have recognized that the coverage areas of APs and the distances between APs may be determined by identifying those APs which are adjacent to one another.
- common, transmission coverage points for APs may be determined by a controller, or the like, which is operable to receive one or more signal quality indicators from a mobile device, where each indicator is associated with a wireless transmission between an access point in a WLAN and a mobile device.
- the controller may be operable to estimate an edge weight value associated with each pair of adjacent access points in the WLAN. The so-estimated edge weight values provide a relative indication of the common, transmission coverage points of each pair of adjacent access points in the WLAN.
- maximum distances between APs in a WLAN may be determined by using signal quality indicators which represent received power levels measured between a mobile device and a pair of access points. These signal quality indicators are subsequently used to estimate edge weight values, where each edge weight value provides a relative indication of the maximum distance between any pair of adjacent access points.
- APAGs include an indication of those access points which are adjacent to one another, where such adjacency is derived from received signal quality indicators.
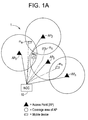
- a wireless network 1 such as a WLAN, which comprises one or more APs, labeled AP 1 ,AP 2 ,AP 3 ,...AP n (where n indicates the last AP in the wireless network).
- Each of the access points, AP 1 ,AP 2 ,AP 3 ,...AP n has an associated coverage area indicated as a 1 ,a 2 ,a 3 ,...a n .
- the coverage area of each access point represents the area within which a wireless transmission from an access point AP 1 ,AP 2 ,AP 3 ,...AP n can effectively be received by a mobile device m a , m b , m c , m d .
- each of these mobile devices m a , m b , m c , m d is located within one or more of the coverage areas a 1 through a 4 of one or more of the mobile devices AP 1 ,AP 2 ,AP 3 ,...AP n .
- the inventors have discovered methods and devices for determining common, transmission coverage points for each of the access points AP 1 ,AP 2 ,AP 3 ,...AP n in the network 1.
- common transmission coverage points may indicate that two or more access points have only a single point, or a wide area, in common. In the former case, this may mean that there may be only a single location where a mobile device may be able to receive a transmission from two APs. This situation is illustrated by WLAN 11 and points p 13 through p n3 in FIG. 1B.
- FIGs. 1A and 1B Also shown in FIGs. 1A and 1B is a network controller, sometimes referred to as a network operations center (NOC) 10. As indicated, each of the APs is connected (either wirelessly or wired) to the NOC 10. It should also be understood that each of the mobile devices m a -m d is also capable of communicating with the controller 10.
- NOC network operations center
- the controller 10 is operable to determine common, transmission coverage points for each of the access points AP 1 through AP n of network 1.
- the discussion which follows will first focus on application of the present invention to a single mobile device m a and two access points, AP 1 and AP 2 , it being understood that the present invention is equally applicable to a plurality of mobile devices and access points.
- the controller 10 is operable to receive one or more signal quality indicators from at least one mobile device, such as mobile device m a .
- Each indicator is associated with a wireless transmission between an access point, such as AP 1 or AP 2 , and a mobile device m a .
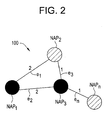
- the controller 10 Upon receiving the indicators, the controller 10 is further operable to determine the common, transmission coverage points (e.g., coverage area) of access points AP 1 and AP 2 . In one embodiment of the present invention, the controller 10 is operable to use the received indicators to generate an APAG, such as the one shown in FIG. 2.
- the controller 10 is operable to use the received indicators to generate an APAG, such as the one shown in FIG. 2.
- APAG 100 includes nodal access points (NAP) labeled NAP 1 through NAP n .
- NAP nodal access points
- each of the nodal access points represents one of the APs, AP 1 through AP n shown in FIG. 1A.
- an APAG is comprised of a number of nodal access points that are connected by so-called "edges" (e 1 through e n ).
- the controller 10 is further operable to form the edges e 1 through e n shown in FIG. 2 using the received signal quality indicators.
- mobile device m a may receive separate transmissions from access point AP 1 and access point AP 2 .
- Mobile device m a is operable to measure the SNR for each of these transmissions.
- mobile device m a is further operable to transmit a signal quality indicator which indicates the relative SNR of a transmission. For example, it may transmit a high signal quality indicator indicating the transmission received from AP 1 is very strong and a low signal quality indicator indicating that the transmission received from AP 2 is very weak.
- the signal quality indicators would both be relatively high.
- the controller 10 Upon receiving the signal quality indicators, the controller 10 is operable to compare the received signal quality indicators to a stored, signal quality indicator threshold. When each of the received signal quality indicators exceeds this stored threshold, then the controller 10 is operable to form an edge e 1 between an AP 1 and an AP 2 in APAG 100. Similarly, the controller 10 may be operable to form other edges e 2 through e n between other access points AP 2 through AP n as shown in FIG. 1A provided transmissions received by a mobile device m a through m n from two or more access points, AP 1 through AP n exceed a signal quality indicator threshold.
- the present invention further provides for assigning weights (e.g., values) to each of the edges e 1 through e n .
- weights e.g., values
- edge e 1 has been assigned a weight of "2" in FIG. 2.
- This weight is a relative indication of the common, transmission coverage points of access points AP 1 and AP 2 .
- the controller 10 upon receiving signal quality indicators the controller 10 is operable to assign a potential, transmission bit rate to each received indicator.
- each of the signal quality indicators is, for example, an indication of the SNR of a transmission between a mobile device m a through m n and one of the access points AP 1 through AP n
- the assignment of a transmission bit rate to each received indicator can be viewed as the assignment of a bit rate to a specific SNR.
- Table 1 below provides an example of an assignment scheme which may be used by controller 10. TABLE 1 SNR (DB) 1-4 4-8 8-13 13+ Bit Rate 1 2 5.5 11
- the controller 10 may select a pair of assigned bit rates, where the bit rates are associated with a pair of access pointes, such as AP 1 and AP 2 .
- the controller 10 may then be operable to compare these bit rates to a weight chart, such as the one shown in Table 2 below. The value of both bit rates determines the weight. For example, the higher the bit rates, the greater the weight.
- Each weight in Table 2 represents an edge weight value.
- the controller 10 may be further operable to receive a plurality of signal quality indicators from a plurality of mobile devices, m a through m n , where each indicator is associated with a wireless transmission between one access point AP 1 through AP n and one of the mobile devices. Thereafter, the controller 10 may be further operable to identify a set of signal quality indicators from the plurality of received indicators, such that each indicator in the identified set has a value that is among a top 5% of all signal quality indicator values.
- the present invention makes use of the probability that the strongest signals (e.g., greater SNRs) correspond to the highest signal quality indicators.
- the strongest signals are also related to the truest signals (i.e., signals that are more indicative of the true overlapping coverage area).
- the controller 10 may be further operable to average the values contained in the identified set to estimate a plurality of edge weight values that can be assigned to edges between access points within an adjacency graph. It is these estimated edge weight values that provide a relative indication of the common, transmission coverage points of overlapping APs within WLAN 1.
- the estimated edge weight values not only provide a relative indication of the common, transmission coverage or overlapping points of APs, but they also provide an indication of coverage holes. That is, if it is determined that there is a section of a WLAN where there is little, if any, overlapping of coverage areas, then this information may be important for a network operator. In some cases, the network operator may choose to install an additional access point or otherwise reconfigure the location of existing access points to provide additional coverage in locations which are presently receiving little or no coverage.
- the access points can be said to be "adjacent".
- adjacency may also be used for other purposes. For example, adjacency can be used to determine the relative indication of a maximum distance between two access points as described in more detail below.
- mobile device m a can measure a received power level from access point AP 1 and a received power level from access point AP 2 .
- the power levels received by mobile device m a will be less than the power levels originally transmitted by access points AP 1 or AP 2 .
- the mobile device m a may be operable to forward the measured, received power levels to the controller 10. More specifically, the received power levels may be converted to a signal quality indicator and the signal quality indicators may be forwarded on to the controller 10.
- the controller 10 may be further operable to estimate an edge weight value associated with access point AP 1 and access point AP 2 based on the received indicators.
- the so-estimated edge weight value may represent a relative indication of a maximum distance between AP 1 and AP 2 .
- the controller 10 may be operable to identify a set of signal quality indicators from the plurality of received signal quality indicators, such that each indicator in the set has a value that is among the top 5% of all of the received signal quality indicators. Thereafter, the controller 10 may be further operable to average the values of the identified set of indicators to estimate a plurality of edge weight values.
- the controller 10 may be operable to generate an adjacency graph (not shown) wherein each access point, such as access points AP 1 and AP 2 , may be connected by an edge and assigned an edge weight using the estimated, edge weight values.
- each of the estimated and assigned edge weight values represents a maximum distance between access points in WLAN 1. More particularly, if the signal quality indicators associated with AP 1 and AP 2 fall within this set, then an edge would be created between access points AP 1 and AP 2 and this edge would be assigned a value which represents a maximum distance between AP 1 and AP 2 .
- the adjacency graph may be used to provide relative indications of maximum distances between all of the access points in WLAN 1.
- the APAGs used to determine the maximum distances between access points may also be used to generate maps which represent the actual physical location of APs. That is, because the present invention provides for the relative indication of maximum distances between access points, these distances may be used to generate a physical map of a WLAN.
- the controller 10 is operable to carry out a number of functions. These functions may be carried out within the controller using a combination of programmable hardware, software, firmware, or some combination of the three.
- the controller 10 may comprise one or more memory sections for storing one or more programs for carrying out the features and functions of the present invention.
- the methods and devices provided by the present invention may be applied to determine the adjacency of access points in a WLAN.
- the discussion above has focused on the use of an adjacency graph to provide a relative indication of the common coverage areas or maximum distances between two or more access points.
- adjacency may be utilized to perform other functions as well, such as access point load balancing and mobile device-to-access point associations as disclosed, for example, in co-pending U.S. Patent Application Nos. 11/026,904 and 11/057,769, the disclosures of which are incorporated herein as if set forth in full herein, using signal quality indicators and adjacency graphs.
Abstract
Description
- A wireless local area network (WLAN) is typically made up of a number of "access points" (APs). Each access point is responsible for transmitting information to a plurality of mobile devices (e.g., wireless laptop computer, etc.) that are within the transmission range of the AP. The area within which a mobile device can effectively receive a wireless transmission from an AP is called the coverage area of an AP.
- Many times, the coverage areas of one or more APs overlap. When this occurs, a mobile device may be able to receive a transmission from one or more APs. Though a mobile device may be able to receive a transmission from more than one AP, the signal strength of each transmission may not be the same. More particularly, a transmission a mobile device receives from one AP may have a high signal-to-noise ratio (SNR) while the transmission the mobile device receives from another AP may have a low SNR. Of course, there may be occasions when the SNRs are the same, indicating that the mobile device can receive a transmission from either AP at the same signal strength.
- Depending on the received SNR, as well as other factors, a mobile device will decide which AP or APs to communicate with. Knowledge of the coverage areas of APs aids in this decision-making process. It is, therefore, desirable to be able to determine the extent to which coverage areas of APs overlap or share common coverage points.
- Along with coverage areas, it is also desirable to determine how far apart one AP is from another in order to, for example, identify holes in the overall coverage area of a WLAN.
- The present inventors have recognized that the coverage areas of APs and the distances between APs may be determined by identifying those APs which are adjacent to one another.
- In accordance with one aspect of the present invention, common, transmission coverage points (e.g., overlapping coverage areas) for APs may be determined by a controller, or the like, which is operable to receive one or more signal quality indicators from a mobile device, where each indicator is associated with a wireless transmission between an access point in a WLAN and a mobile device. After receiving the signal quality indicators, the controller may be operable to estimate an edge weight value associated with each pair of adjacent access points in the WLAN. The so-estimated edge weight values provide a relative indication of the common, transmission coverage points of each pair of adjacent access points in the WLAN.
- In accordance with another aspect _of the present invention, maximum distances between APs in a WLAN may be determined by using signal quality indicators which represent received power levels measured between a mobile device and a pair of access points. These signal quality indicators are subsequently used to estimate edge weight values, where each edge weight value provides a relative indication of the maximum distance between any pair of adjacent access points.
- Both aspects of the present invention, namely the determination of common, transmission coverage points and the determination of maximum distances between access points, may also rely on an access point adjacency graph (APAG). APAGs include an indication of those access points which are adjacent to one another, where such adjacency is derived from received signal quality indicators.
-
- FIG. 1A depicts a simplified, wireless, local area network (WLAN) according to an embodiment of the present invention.
- FIG. 1B depicts another WLAN according to another embodiment of the present invention.
- FIG. 2 depicts a simplified, access point adjacency graph (APAG) derived from the WLAN in FIG. 1A according to one embodiment of the present invention.
- Referring now to FIG. 1A, there is depicted a
wireless network 1, such as a WLAN, which comprises one or more APs, labeled AP1,AP2,AP3,...APn (where n indicates the last AP in the wireless network). Each of the access points, AP1,AP2,AP3,...AP n has an associated coverage area indicated as a1,a2,a3,...a n . The coverage area of each access point represents the area within which a wireless transmission from an access point AP1,AP2,AP3,...AP n can effectively be received by a mobile device ma, mb, mc, md. - As indicated in FIG. 1A, at some point in time, each of these mobile devices ma, mb, mc, md is located within one or more of the coverage areas a1 through a4 of one or more of the mobile devices AP1,AP2,AP3,...AP n .
- In accordance with the present invention, the inventors have discovered methods and devices for determining common, transmission coverage points for each of the access points AP1,AP2,AP3,...AP n in the
network 1. - It should be noted that the terminology "common transmission coverage points" may indicate that two or more access points have only a single point, or a wide area, in common. In the former case, this may mean that there may be only a single location where a mobile device may be able to receive a transmission from two APs. This situation is illustrated by
WLAN 11 and points p13 through pn3 in FIG. 1B. - Also shown in FIGs. 1A and 1B is a network controller, sometimes referred to as a network operations center (NOC) 10. As indicated, each of the APs is connected (either wirelessly or wired) to the
NOC 10. It should also be understood that each of the mobile devices ma-md is also capable of communicating with thecontroller 10. - In one embodiment of the present invention, the
controller 10 is operable to determine common, transmission coverage points for each of the access points AP1 through AP n ofnetwork 1. To simplify the explanation of the present invention, the discussion which follows will first focus on application of the present invention to a single mobile device ma and two access points, AP1 and AP2, it being understood that the present invention is equally applicable to a plurality of mobile devices and access points. - In one embodiment of the present invention, the
controller 10 is operable to receive one or more signal quality indicators from at least one mobile device, such as mobile device ma. Each indicator is associated with a wireless transmission between an access point, such as AP1 or AP2, and a mobile device ma. - Upon receiving the indicators, the
controller 10 is further operable to determine the common, transmission coverage points (e.g., coverage area) of access points AP1 and AP2. In one embodiment of the present invention, thecontroller 10 is operable to use the received indicators to generate an APAG, such as the one shown in FIG. 2. - As shown,
APAG 100 includes nodal access points (NAP) labeled NAP1 through NAPn. It should be understood that each of the nodal access points represents one of the APs, AP1 through APn shown in FIG. 1A. Thus, an APAG is comprised of a number of nodal access points that are connected by so-called "edges" (e1 through en). In one embodiment of the present invention, thecontroller 10 is further operable to form the edges e1 through en shown in FIG. 2 using the received signal quality indicators. - For example, mobile device ma may receive separate transmissions from access point AP1 and access point AP2. Mobile device ma is operable to measure the SNR for each of these transmissions. Thereafter, mobile device ma is further operable to transmit a signal quality indicator which indicates the relative SNR of a transmission. For example, it may transmit a high signal quality indicator indicating the transmission received from AP1 is very strong and a low signal quality indicator indicating that the transmission received from AP2 is very weak. However, when the transmissions received from AP1 and AP2 are both relatively strong (e.g., when both transmissions exceed some threshold) then the signal quality indicators would both be relatively high.
- Upon receiving the signal quality indicators, the
controller 10 is operable to compare the received signal quality indicators to a stored, signal quality indicator threshold. When each of the received signal quality indicators exceeds this stored threshold, then thecontroller 10 is operable to form an edge e1 between an AP1 and an AP2 inAPAG 100. Similarly, thecontroller 10 may be operable to form other edges e2 through en between other access points AP2 through AP n as shown in FIG. 1A provided transmissions received by a mobile device ma through m n from two or more access points, AP1 through APn exceed a signal quality indicator threshold. - After the edges e1 through en have been added, the present invention further provides for assigning weights (e.g., values) to each of the edges e1 through en. For example, edge e1 has been assigned a weight of "2" in FIG. 2. This weight is a relative indication of the common, transmission coverage points of access points AP1 and AP2. For example, the greater the value the greater the overlap between AP1 and AP2 coverage areas.
- The assignment of these weights may be carried out as follows.
- In yet a further embodiment of the present invention, upon receiving signal quality indicators the
controller 10 is operable to assign a potential, transmission bit rate to each received indicator. - In a further embodiment of the present invention, because each of the signal quality indicators is, for example, an indication of the SNR of a transmission between a mobile device ma through mn and one of the access points AP1 through AP n the assignment of a transmission bit rate to each received indicator can be viewed as the assignment of a bit rate to a specific SNR. Table 1 below provides an example of an assignment scheme which may be used by
controller 10.TABLE 1 SNR (DB) 1-4 4-8 8-13 13+ Bit Rate 1 2 5.5 11 - Continuing, provided the controller has determined that an edge exists between two APs as discussed previously above, and after the
controller 10 has assigned a bit rate to each of the measured SNRs (i.e., associated signal quality indicators), thecontroller 10 may select a pair of assigned bit rates, where the bit rates are associated with a pair of access pointes, such as AP1 and AP2. Thecontroller 10 may then be operable to compare these bit rates to a weight chart, such as the one shown in Table 2 below. The value of both bit rates determines the weight. For example, the higher the bit rates, the greater the weight. Each weight in Table 2 represents an edge weight value.
- Up until now the discussion above has focused on a single mobile device, ma. However, the present invention is applicable to a plurality of mobile devices ma through mn.
- Accordingly, in accordance with an additional embodiment of the present invention, the
controller 10 may be further operable to receive a plurality of signal quality indicators from a plurality of mobile devices, ma through mn, where each indicator is associated with a wireless transmission between one access point AP1 through APn and one of the mobile devices. Thereafter, thecontroller 10 may be further operable to identify a set of signal quality indicators from the plurality of received indicators, such that each indicator in the identified set has a value that is among a top 5% of all signal quality indicator values. - By so identifying such a set, the present invention makes use of the probability that the strongest signals (e.g., greater SNRs) correspond to the highest signal quality indicators. In addition, in all probability the strongest signals are also related to the truest signals (i.e., signals that are more indicative of the true overlapping coverage area).
- After identifying the set of signal quality indicators, the
controller 10 may be further operable to average the values contained in the identified set to estimate a plurality of edge weight values that can be assigned to edges between access points within an adjacency graph. It is these estimated edge weight values that provide a relative indication of the common, transmission coverage points of overlapping APs withinWLAN 1. - It should be understood that the estimated edge weight values not only provide a relative indication of the common, transmission coverage or overlapping points of APs, but they also provide an indication of coverage holes. That is, if it is determined that there is a section of a WLAN where there is little, if any, overlapping of coverage areas, then this information may be important for a network operator. In some cases, the network operator may choose to install an additional access point or otherwise reconfigure the location of existing access points to provide additional coverage in locations which are presently receiving little or no coverage.
- In general, it can be said that when signal quality indicators associated with two access points exceed a threshold, the access points can be said to be "adjacent". Up until now the discussion above has used the adjacency of access points to determine common, transmission coverage points (e.g., overlapping coverage areas) of two or more access points. The present inventors realized, however, that adjacency may also be used for other purposes. For example, adjacency can be used to determine the relative indication of a maximum distance between two access points as described in more detail below.
- Referring back to FIG. 1A, again beginning our discussion focusing on a single mobile device, ma, one skilled in the art will realize that mobile device ma can measure a received power level from access point AP1 and a received power level from access point AP2. Ordinarily, the power levels received by mobile device ma will be less than the power levels originally transmitted by access points AP1 or AP2. Upon measuring the received power levels associated with a wireless transmission between each of the access points AP1 and AP2, the mobile device ma may be operable to forward the measured, received power levels to the
controller 10. More specifically, the received power levels may be converted to a signal quality indicator and the signal quality indicators may be forwarded on to thecontroller 10. - Upon receiving one or more of the signal quality indicators from the mobile device ma, the
controller 10 may be further operable to estimate an edge weight value associated with access point AP1 and access point AP2 based on the received indicators. The so-estimated edge weight value may represent a relative indication of a maximum distance between AP1 and AP2. - In more detail, similar to the discussion above, upon receiving the signal quality indicators, the
controller 10 may be operable to identify a set of signal quality indicators from the plurality of received signal quality indicators, such that each indicator in the set has a value that is among the top 5% of all of the received signal quality indicators. Thereafter, thecontroller 10 may be further operable to average the values of the identified set of indicators to estimate a plurality of edge weight values. - The
controller 10 may be operable to generate an adjacency graph (not shown) wherein each access point, such as access points AP1 and AP2, may be connected by an edge and assigned an edge weight using the estimated, edge weight values. - In a further embodiment of the present invention, each of the estimated and assigned edge weight values represents a maximum distance between access points in
WLAN 1. More particularly, if the signal quality indicators associated with AP1 and AP2 fall within this set, then an edge would be created between access points AP1 and AP2 and this edge would be assigned a value which represents a maximum distance between AP1 and AP2. - In this way, the adjacency graph may be used to provide relative indications of maximum distances between all of the access points in
WLAN 1. - In yet a further embodiment of the present invention, the APAGs used to determine the maximum distances between access points may also be used to generate maps which represent the actual physical location of APs. That is, because the present invention provides for the relative indication of maximum distances between access points, these distances may be used to generate a physical map of a WLAN.
- As noted above, the
controller 10 is operable to carry out a number of functions. These functions may be carried out within the controller using a combination of programmable hardware, software, firmware, or some combination of the three. In the case of software or firmware, thecontroller 10 may comprise one or more memory sections for storing one or more programs for carrying out the features and functions of the present invention. - In general, the methods and devices provided by the present invention may be applied to determine the adjacency of access points in a WLAN. The discussion above has focused on the use of an adjacency graph to provide a relative indication of the common coverage areas or maximum distances between two or more access points. It should be understood that adjacency may be utilized to perform other functions as well, such as access point load balancing and mobile device-to-access point associations as disclosed, for example, in co-pending U.S. Patent Application Nos. 11/026,904 and 11/057,769, the disclosures of which are incorporated herein as if set forth in full herein, using signal quality indicators and adjacency graphs.
- Yet other relationships between access points may be realized by studying the adjacency, or lack thereof, of access points in a WLAN in accordance with the principles of the present invention. It should be understood that the discussion above only provides a few examples of the present invention, the true scope of which is covered by the claims which follow.
Claims (10)
- A method for determining common, transmission coverage points for access points (APs) in a wireless, local area network (WLAN) comprising the steps of:receiving one or more signal quality indicators from at least one mobile device, each indicator associated with a wireless transmission between an access point (AP) in the WLAN and the mobile device; andestimating an edge weight value associated with two adjacent APs in the WLAN based on the received indicators,wherein the edge weight value is a relative indication of common, transmission coverage points of the two adjacent APs.
- The method as in claim 1 further comprising the step of generating an adjacency graph representing transmission coverage points of the two APs.
- The method as in claim 2 wherein the step of generating an adjacency graph comprises the step of forming an edge between the two APs when signal quality indicators associated with the APs exceed a threshold.
- The method as in claim 3 further comprising the steps of:assigning a transmission bit rate to each received indicator of each AP connected by the formed edge; andestimating the edge weight value based on the pair of assigned bit rates.
- The method as in claim 1 wherein each signal quality indicator is an indication of a signal-to-noise ratio of a wireless transmission between the mobile device and an AP.
- The method as in claim 1 further comprising the steps of:receiving a plurality of signal quality indicators from a plurality of mobile devices, each indicator associated with a wireless transmission between one AP in the WLAN and one of the mobile devices;identifying a set of signal quality indicators from the plurality of received indicators, wherein each indicator in the set has a value that is among a top 5% of all signal quality indicator values; andaveraging the values of the identified set of indicators to estimate a plurality of edge weight values.
- A method for determining distances between access points (APs) in a wireless, local area network (WLAN) comprising the steps of:receiving one or more signal quality indicators from at least one mobile device, each indicator associated with a wireless transmission between an AP in the WLAN and the mobile device; andestimating an edge weight value associated with two adjacent APs in the WLAN based on the received indicators,wherein the edge weight value is a relative indication of a maximum distance between the two adjacent APs.
- The method as in claim 7 wherein each signal quality indicator is an indication of a measured, received power level between the mobile device and an AP.
- The method as in claim 1 further comprising the steps of:receiving a plurality of signal quality indicators, each indicator associated with a wireless transmission between an AP in the WLAN and the mobile device;identifying a set of signal quality indicators from the plurality of received indicators, wherein each indicator in the set has a value that is among a top 5% of all signal quality indicator values; andaveraging the values of the identified set of indicators to estimate a plurality of edge weight values.
- The method as in claim 7 further comprising the step of generating an adjacency graph representing maximum distances between APs in the WLAN.
Applications Claiming Priority (1)
| Application Number | Priority Date | Filing Date | Title |
|---|---|---|---|
| US11/026,905 US7430189B2 (en) | 2004-12-31 | 2004-12-31 | Methods and devices for determining the adjacency of access points in a wireless network |
Publications (1)
| Publication Number | Publication Date |
|---|---|
| EP1677458A1 true EP1677458A1 (en) | 2006-07-05 |
Family
ID=35953834
Family Applications (1)
| Application Number | Title | Priority Date | Filing Date |
|---|---|---|---|
| EP05257701A Ceased EP1677458A1 (en) | 2004-12-31 | 2005-12-15 | Methods for determining the adjacency of access points in a wireless network |
Country Status (5)
| Country | Link |
|---|---|
| US (1) | US7430189B2 (en) |
| EP (1) | EP1677458A1 (en) |
| JP (1) | JP4921791B2 (en) |
| KR (1) | KR101201639B1 (en) |
| CN (1) | CN100594694C (en) |
Families Citing this family (21)
| Publication number | Priority date | Publication date | Assignee | Title |
|---|---|---|---|---|
| US8254347B2 (en) * | 2004-12-31 | 2012-08-28 | Alcatel Lucent | Methods and devices for associating a mobile device to access points within a WLAN |
| US20060182023A1 (en) * | 2005-02-15 | 2006-08-17 | Yigal Bejerano | Methods and devices for iteratively determining mobile device-to-access point associations to achieve load balancing |
| US7839814B2 (en) * | 2005-06-23 | 2010-11-23 | Motorola Mobility, Inc. | Method and system for adjusting inter-scan period of a mobile station |
| US8170546B2 (en) * | 2006-03-22 | 2012-05-01 | Broadcom Corporation | Client device characterization of other client device transmissions and reporting of signal qualities to access point(s) |
| US20070223419A1 (en) * | 2006-03-24 | 2007-09-27 | Samsung Electronics Co., Ltd. | Method and system for sharing spectrum in a wireless communications network |
| US8064413B2 (en) * | 2006-05-12 | 2011-11-22 | At&T Intellectual Property I, L.P. | Adaptive rate and reach optimization for wireless access networks |
| US8072952B2 (en) * | 2006-10-16 | 2011-12-06 | Juniper Networks, Inc. | Load balancing |
| EP2077050A4 (en) * | 2006-10-27 | 2012-10-24 | Ericsson Telefon Ab L M | Method and apparatus for estimating a position of an access point in a wireless communications network |
| US8107399B2 (en) * | 2007-06-08 | 2012-01-31 | Alcatel-Lucent Usa Inc. | Methods and devices for providing robust nomadic wireless mesh networks using directional antennas |
| US8570938B2 (en) * | 2008-08-29 | 2013-10-29 | Empire Technology, Development, LLC | Method and system for adaptive antenna array pairing |
| US8126486B2 (en) * | 2008-08-29 | 2012-02-28 | Empire Technology Development Llc | Adaptive antenna weighting system for wireless local area and personal area networks |
| US8577296B2 (en) * | 2008-08-29 | 2013-11-05 | Empire Technology Development, Llc | Weighting factor adjustment in adaptive antenna arrays |
| US8155058B2 (en) * | 2009-01-30 | 2012-04-10 | Aruba Networks, Inc. | Client balancing in wireless networks |
| US8310947B2 (en) * | 2009-06-24 | 2012-11-13 | Empire Technology Development Llc | Wireless network access using an adaptive antenna array |
| KR101252946B1 (en) * | 2011-03-03 | 2013-04-15 | 연세대학교 산학협력단 | Apparatus and method for constructing wireless lan ap map |
| CN102547758A (en) * | 2011-12-21 | 2012-07-04 | 上海工程技术大学 | Deployment method of Wireless Local Area Network (WLAN) access point |
| JP5989517B2 (en) * | 2012-11-20 | 2016-09-07 | 株式会社東芝 | Wireless communication apparatus, method and program |
| US9401874B2 (en) * | 2013-08-14 | 2016-07-26 | Qualcomm Incorporated | Minimizing coverage holes in a communication network |
| US10819585B2 (en) * | 2016-05-04 | 2020-10-27 | At&T Intellectual Property I, L.P. | Determining RACH root sequences as a function of access point configuration using graph coloring |
| US10546021B2 (en) * | 2017-01-30 | 2020-01-28 | Sap Se | Adjacency structures for executing graph algorithms in a relational database |
| WO2019094967A1 (en) * | 2017-11-13 | 2019-05-16 | Common Networks, Inc | Systems and methods for configuring radio communication devices |
Citations (3)
| Publication number | Priority date | Publication date | Assignee | Title |
|---|---|---|---|---|
| EP1063819A1 (en) * | 1999-06-23 | 2000-12-27 | Sony International (Europe) GmbH | Calibration procedure for wireless networks with direct mode traffic |
| EP1081972A2 (en) * | 1999-08-31 | 2001-03-07 | Lucent Technologies Inc. | System for determining wireless coverage using location information for a wireless unit |
| US6636737B1 (en) * | 2000-04-10 | 2003-10-21 | Carnegie Mellon University | Method for assigning channels for access points of a wireless network |
Family Cites Families (6)
| Publication number | Priority date | Publication date | Assignee | Title |
|---|---|---|---|---|
| US6711148B1 (en) * | 2000-04-10 | 2004-03-23 | Carnegie Mellon University | Method for configuring a wireless network |
| US7366144B2 (en) * | 2002-03-25 | 2008-04-29 | Agere Systems Inc. | Method of dynamically setting at least one threshold at an access point in a wireless local area network and the access point |
| US20050003827A1 (en) * | 2003-02-13 | 2005-01-06 | Whelan Robert J. | Channel, coding and power management for wireless local area networks |
| US7477610B2 (en) * | 2004-03-01 | 2009-01-13 | Alcatel-Lucent Usa Inc. | Methods and devices for coordinating the transmissions of access points in WLANs |
| US8254347B2 (en) * | 2004-12-31 | 2012-08-28 | Alcatel Lucent | Methods and devices for associating a mobile device to access points within a WLAN |
| US20060182023A1 (en) * | 2005-02-15 | 2006-08-17 | Yigal Bejerano | Methods and devices for iteratively determining mobile device-to-access point associations to achieve load balancing |
-
2004
- 2004-12-31 US US11/026,905 patent/US7430189B2/en active Active
-
2005
- 2005-12-15 EP EP05257701A patent/EP1677458A1/en not_active Ceased
- 2005-12-27 JP JP2005374146A patent/JP4921791B2/en not_active Expired - Fee Related
- 2005-12-29 CN CN200510135753A patent/CN100594694C/en not_active Expired - Fee Related
- 2005-12-29 KR KR1020050133090A patent/KR101201639B1/en not_active IP Right Cessation
Patent Citations (3)
| Publication number | Priority date | Publication date | Assignee | Title |
|---|---|---|---|---|
| EP1063819A1 (en) * | 1999-06-23 | 2000-12-27 | Sony International (Europe) GmbH | Calibration procedure for wireless networks with direct mode traffic |
| EP1081972A2 (en) * | 1999-08-31 | 2001-03-07 | Lucent Technologies Inc. | System for determining wireless coverage using location information for a wireless unit |
| US6636737B1 (en) * | 2000-04-10 | 2003-10-21 | Carnegie Mellon University | Method for assigning channels for access points of a wireless network |
Also Published As
| Publication number | Publication date |
|---|---|
| JP4921791B2 (en) | 2012-04-25 |
| KR20060079110A (en) | 2006-07-05 |
| CN100594694C (en) | 2010-03-17 |
| US20060146754A1 (en) | 2006-07-06 |
| JP2006191593A (en) | 2006-07-20 |
| KR101201639B1 (en) | 2012-11-14 |
| US7430189B2 (en) | 2008-09-30 |
| CN1798082A (en) | 2006-07-05 |
Similar Documents
| Publication | Publication Date | Title |
|---|---|---|
| EP1677458A1 (en) | Methods for determining the adjacency of access points in a wireless network | |
| JP4880351B2 (en) | Method for managing signal measurements in a wireless network, a station adapted to cooperate with a centralized measurement manager unit, a centralized measurement manager unit adapted to process measurements in a wireless network, and managing measurements in a wireless network system | |
| US7738876B1 (en) | Radio resource management for wireless local area networks | |
| US7136665B2 (en) | Mobile communications system and method for controlling transmission power | |
| US9052378B2 (en) | Estimation of position using WLAN access point radio propagation characteristics in a WLAN positioning system | |
| US8077079B2 (en) | Radiolocation using path loss data | |
| JP4609231B2 (en) | Wireless position detection method and system | |
| US7675892B2 (en) | Sub-access point, system, and method for adjusting power of transmission signal | |
| US7804786B2 (en) | Method and apparatus for determining path loss by combining geolocation with interference suppression | |
| JPH09187063A (en) | Method and device for radio communication system organization | |
| JP4934218B2 (en) | Automatic processing of neighboring cells | |
| US20190082365A1 (en) | Device and method for signal strength estimation in a wireless network with multiple access points | |
| JP2006109448A (en) | Apparatus and method for detecting interference between neighboring bss in wireless lan system | |
| US20120014362A1 (en) | Wireless communication device, wireless communication system, and method for selecting wireless communication route | |
| JP2005527160A (en) | Method and system for congestion control in a CDMA system | |
| US8223701B2 (en) | Communication apparatus, communication system, and method and program for judging reservation acceptance | |
| KR100552129B1 (en) | Method for determining a candidate cell active set | |
| KR100713529B1 (en) | Apparatus and method for positioning mobile station in mobile communication system | |
| JP6676453B2 (en) | Information processing device | |
| WO2018101495A1 (en) | Rssi-based positioning method using ibeacon | |
| KR102275265B1 (en) | Method and Apparatus for Cooperative Positioning | |
| KR20050016603A (en) | Load balancing in wireless communication network | |
| CN117354818A (en) | Indoor base station deployment method, device, electronic equipment and computer program product | |
| US20050102425A1 (en) | Method of handing over a terminal | |
| EP1315333A1 (en) | A method for handing over a terminal |
Legal Events
| Date | Code | Title | Description |
|---|---|---|---|
| PUAI | Public reference made under article 153(3) epc to a published international application that has entered the european phase |
Free format text: ORIGINAL CODE: 0009012 |
|
| 17P | Request for examination filed |
Effective date: 20060111 |
|
| AK | Designated contracting states |
Kind code of ref document: A1 Designated state(s): AT BE BG CH CY CZ DE DK EE ES FI FR GB GR HU IE IS IT LI LT LU LV MC NL PL PT RO SE SI SK TR |
|
| AX | Request for extension of the european patent |
Extension state: AL BA HR MK YU |
|
| AKX | Designation fees paid |
Designated state(s): DE FR GB |
|
| 17Q | First examination report despatched |
Effective date: 20060330 |
|
| RAP3 | Party data changed (applicant data changed or rights of an application transferred) |
Owner name: LUCENT TECHNOLOGIES INC. |
|
| RAP1 | Party data changed (applicant data changed or rights of an application transferred) |
Owner name: ALCATEL-LUCENT USA INC. |
|
| 111Z | Information provided on other rights and legal means of execution |
Free format text: DE FR GB Effective date: 20130410 |
|
| APBK | Appeal reference recorded |
Free format text: ORIGINAL CODE: EPIDOSNREFNE |
|
| APBN | Date of receipt of notice of appeal recorded |
Free format text: ORIGINAL CODE: EPIDOSNNOA2E |
|
| APBR | Date of receipt of statement of grounds of appeal recorded |
Free format text: ORIGINAL CODE: EPIDOSNNOA3E |
|
| APAF | Appeal reference modified |
Free format text: ORIGINAL CODE: EPIDOSCREFNE |
|
| D11X | Information provided on other rights and legal means of execution (deleted) | ||
| APBX | Invitation to file observations in appeal sent |
Free format text: ORIGINAL CODE: EPIDOSNOBA2E |
|
| APAQ | Information on invitation to file observation in appeal modified |
Free format text: ORIGINAL CODE: EPIDOSCOBA2E |
|
| APBZ | Receipt of observations in appeal recorded |
Free format text: ORIGINAL CODE: EPIDOSNOBA4E |
|
| APBT | Appeal procedure closed |
Free format text: ORIGINAL CODE: EPIDOSNNOA9E |
|
| STAA | Information on the status of an ep patent application or granted ep patent |
Free format text: STATUS: THE APPLICATION HAS BEEN REFUSED |
|
| 18R | Application refused |
Effective date: 20171020 |