EP0947828B1 - Method and apparatus for improved inspection measurements - Google Patents
Method and apparatus for improved inspection measurements Download PDFInfo
- Publication number
- EP0947828B1 EP0947828B1 EP99302557A EP99302557A EP0947828B1 EP 0947828 B1 EP0947828 B1 EP 0947828B1 EP 99302557 A EP99302557 A EP 99302557A EP 99302557 A EP99302557 A EP 99302557A EP 0947828 B1 EP0947828 B1 EP 0947828B1
- Authority
- EP
- European Patent Office
- Prior art keywords
- features
- intensity
- locations
- intensity profile
- centroid
- Prior art date
- Legal status (The legal status is an assumption and is not a legal conclusion. Google has not performed a legal analysis and makes no representation as to the accuracy of the status listed.)
- Expired - Lifetime
Links
Images


Classifications
-
- G—PHYSICS
- G03—PHOTOGRAPHY; CINEMATOGRAPHY; ANALOGOUS TECHNIQUES USING WAVES OTHER THAN OPTICAL WAVES; ELECTROGRAPHY; HOLOGRAPHY
- G03F—PHOTOMECHANICAL PRODUCTION OF TEXTURED OR PATTERNED SURFACES, e.g. FOR PRINTING, FOR PROCESSING OF SEMICONDUCTOR DEVICES; MATERIALS THEREFOR; ORIGINALS THEREFOR; APPARATUS SPECIALLY ADAPTED THEREFOR
- G03F7/00—Photomechanical, e.g. photolithographic, production of textured or patterned surfaces, e.g. printing surfaces; Materials therefor, e.g. comprising photoresists; Apparatus specially adapted therefor
- G03F7/70—Microphotolithographic exposure; Apparatus therefor
- G03F7/70483—Information management; Active and passive control; Testing; Wafer monitoring, e.g. pattern monitoring
- G03F7/70605—Workpiece metrology
- G03F7/70616—Monitoring the printed patterns
- G03F7/70633—Overlay, i.e. relative alignment between patterns printed by separate exposures in different layers, or in the same layer in multiple exposures or stitching
-
- G—PHYSICS
- G01—MEASURING; TESTING
- G01B—MEASURING LENGTH, THICKNESS OR SIMILAR LINEAR DIMENSIONS; MEASURING ANGLES; MEASURING AREAS; MEASURING IRREGULARITIES OF SURFACES OR CONTOURS
- G01B21/00—Measuring arrangements or details thereof, where the measuring technique is not covered by the other groups of this subclass, unspecified or not relevant
- G01B21/30—Measuring arrangements or details thereof, where the measuring technique is not covered by the other groups of this subclass, unspecified or not relevant for measuring roughness or irregularity of surfaces
Definitions
- This disclosure relates to inspection measurements and more particularly to a method and apparatus for making inspection measurements with reduced measurement error during integrated circuit fabrication.
- Overlay metrology is used for determining the quality of products, for example, integrated circuits.
- overlay metrology is used to determine the alignment of critical features which define, for example an integrated circuit device. A misalignment of these features can cause electrical opens or shorts thus destroying product functionality.
- IC integrated circuit
- overlay metrology must be done with high accuracy and precision. Typically, the overlay accuracy and precision is about 3% of minimum pattern or feature size. For example, a 150 nm feature requires an overlay accuracy of ⁇ 5 nm. A major contributor to measurement uncertainty is the dependency on the feature being measured. For increasingly small scale IC devices, accurate measurement of critical features relies heavily on instruments such as precision microscopes and computer algorithms. For an accurate measurement reading from a microscope, a robust and meaningful computer algorithm is necessary.
- IC devices are fabricated on a semiconductor substrate wafers.
- the wafers are usually round while the IC chips are rectangular in shape and positioned in a grid across the wafer.
- it is necessary to monitor and align the grid of one level to that of a subsequent level to ensure proper masking and material deposition. This is required to achieve proper chip functionality.
- FIG. 1 a top view of a standard overlay metrology structure 10 is shown.
- Structure 10 includes surface features such as trenches or plateaus 16 below the surface and elevated structures 12 above the surface.
- Each feature has edges 14 which may be used to measure dimensions between the features for inspection purposes.
- FIG. 1 shows a structure 12 as a bullet and a trench structure 16 as a target.
- FIG. 2 a cross-sectional view is provided in FIG. 2.
- FIG. 3 shows an example of an intensity profile across the bullets and targets in one direction (x or y) across structure 10 (FIGS. 1 and 2).
- the goal of the measurement in this example is to determine a distance between the centerlines of the bullet and target marks, and hence determine the resultant vector misregistration between the aligning levels (bullet to target).
- the intensity profile indicates edges 14 as a change in intensity.
- sloped curves 18, 20, 22 and 24 indicate edges 14 for structures 12 (bullet)
- sloped curves 26, 28, 30 and 32 indicate edges 14 for trench structures 16 (target).
- Edges are defined mathematically as the points of inflection or the maximum or minimum from a first derivative calculated from the structure intensity profile.
- a centre distance between edge pairs of the bullet, slope curves 18 and 24, is compared to a centre distance between edge pairs of the target, slope curves 26 and 32, to give a misregistration value in either x or y direction.
- the misregistration may be defined as C L bullet outer ⁇ C L target outer
- a slightly different misregistration value may result, such that: C L bullet_outer ⁇ C L target_outer ⁇ C L bullet_inner ⁇ C l target_inner
- the method described above has disadvantages if asymmetric signals are present. If a different edge pair is used to determine the centre lines a different location may result. This occurs due to the intensity profile signal's edge slope variation. The intensity profile is never perfectly symmetrical which means the slopes of the edges will be slightly different between the edges and sets of edge pairs. This error is known as centreline shift and has been observed to be of the order of 10nm ⁇ .
- European Patent Application EP0444450 A1 discloses an example of a known method involving the use of verification marks to try to align the surface of a wafer and a layer of photoresist.
- the invention defined in independent method claim 1 seeks to provide a method of reducing measuring uncertainty in inspection systems using intensity profiles.
- the invention also seeks to provide a method for reducing edge slope variations in intensity profiles to better define centre points and more accurately determine misregistrations for semiconductor wafers.
- the step of providing an intensity profile may further include the steps of providing an energy source for irradiating the surface feature and collecting intensity data by measuring the intensity of reflected radiation from the surface feature.
- the step of providing an intensity profile may further includes the steps of scanning the surface feature to determine intensity differences and collecting intensity data across the surface feature.
- the step of employing centroid locations and intensity profile areas of two or more surface features to assess a measurement quality may be included.
- the step of adjusting a focus to provide a better defined intensity profile thereby providing more reduced measurement error may be included.
- the step of computing the area may further include an iterative numerical integration algorithm.
- the step of providing an intensity profile may further include the steps of providing an energy source for irradiating the features and collecting intensity data by measuring the intensity of reflected radiation from the features.
- the step of providing an intensity profile may further includes the steps of scanning the surface feature to determine intensity differences and collecting intensity data across the surface feature.
- the step of employing centroid locations and intensity profile areas of two or more surface features to assess a measurement quality may be included.
- the method may further include the step of adjusting a focus to provide a better defined intensity profile thereby providing more reduced measurement error.
- the step of computing the area may further include an iterative numerical integration algorithm.
- the first and second reference locations may be center lines between each set of features.
- the first and second reference locations may be points between each set of features.
- the first set of features may be substantially symmetrical about a first center point, and the second set of features may substantially symmetrical about a second center point, and the method may further include the step of measuring the misregistration between the first and second center points.
- the intensity measurement device of the invention defined in claim 10 may include an energy source for irradiating the surface features and collecting intensity data by measuring the intensity of reflected radiation from the surface features.
- the computing means may include a processor.
- the surface features may be positioned on a semiconductor wafer.
- the measuring device may include an optical microscope.
- the intensity measurement device may include a photosensor.
- the measuring device may include a scanning electron microscope.
- the intensity measurement device may include an electron sensor.
- the measurement device may be an atomic force microscope.
- a method for reducing measurement uncertainty for reference locations between process steps comprising the steps of: providing an intensity profile for a first set of features of a first process step and for a second set of features of a second process step; computing areas for regions of the intensity profile enclosed by intensity data of the features and a threshold intensity on the intensity profile; determining a centroid location for the regions from or based on the areas calculated in the previous step; comparing centroid locations from the first set of features to determine a first reference location; comparing centroid locations from the second set of features to determine a second reference location; evaluating a difference between the first and second reference locations to determine a misregistration between the first and second set of features.
- the present invention relates to inspection measurements and more particularly, to a method and apparatus for making inspection measurements with reduced measurement error.
- a method for reducing measuring uncertainty for inspection systems using intensity profiles includes determining a centroid for a region of the intensity profile. Intensity data recorded by scanning across a wafer surface is recorded and plotted. The region below a threshold intensity is chosen and the area and the centroid for the region are calculated. The centroid for each region is then used to determine mark center lines. Based on the centroid approach the edge slope variations are averaged out and thereby reduced in effect.
- the coordinate system is defined by x, y and z directions which have been arbitrarily assigned and one skilled in the art understands that these designations may be substituted for one another. -
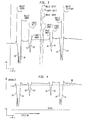
- FIG. 4 is an intensity profile of a scan across resist structures 12 and trench structures 16 of FIGS. 1 and 2.
- Edge slopes 60 through 67 show variations along each edge slope curve.
- Edge slope curves indicate a change in intensity due to surface features. The change in intensity is evaluated relative to a baseline or threshold intensity 68.
- regions 70 through 73 are delineated by edge slopes 60 through 67. Regions 70 through 73 are enclosed by extending threshold 68 over each region (dashed line). Since the intensity profile is plotted in x (or y) and z (Cartesian) coordinates, or may be converted thereto, a technique in accordance with the invention is used to calculate an area for regions 70 through 73. In one embodiment, an iterative numerical integration is used, for example, the Newton method, as is known in the art. In other methods, an area may be calculated by a Trapezoid Rule, also known in the art.
- the chosen datum is a reference point for the measured intensity, and is preferably about 0.
- the threshold is also chosen as a set value of the maximum intensity.
- the threshold in one embodiment, is chosen to be about 90 % of maximum intensity output from an energy source.
- Threshold values may be chosen to optimize performance of the invention.
- the threshold values may be chosen according to user specified settings to define the desired region to integrate over to produce optimal results for specific applications.
- the intensity profile is developed between the datum and the threshold which may be chosen in accordance with predetermined criteria.
- the areas for regions 70 through 73 are calculated above and are used to determine the value of a centroid for each region.
- the centroid for each region is calculated as follows.
- the centroid coordinates can be used to determine a centerline shift for each region for measurement diagnostics.
- Cartesian coordinates are shown other coordinate systems are contemplated.
- Centroids 80 through 83 may be used to represent the location of the features on the intensity profile. In this way the variations in edge slope data are minimized and a better reference location is provided.
- centroid locations 80 through 83 are compared to determine a first mark center line CL 1 based on the centroids of the target (centroid locations 81 and 82 in this example).
- a second mark center line CL 2 may be calculated based on the centroids of the bullet (centroid locations 81 and 82 in this example).
- CL 1 and CL 2 may be compared directly or combined with other reference points to determine misregistration between features or feature patterns.
- the first and second mark center lines, CL 1 and CL 2 may be produced along another symmetry line to intersect at a first mark center C 1
- the second mark center lines CL 2 may be produced to intersect at an outer mark center C 2
- the first and second mark centers, C 1 and C 2 are then compared to determine the amount of overlay misregistration (bullet relative to the target, i.e C 2 to C 1 ).
- a more accurate mark center location may be provided by using the centroid calculated for each region. In this way, the edge slope variations are avoided.
- the method of the present invention allows a single center determination to be carried out without being limited to a constant threshold with the ability to select a datum and threshold and calculate centerlines based on mark centroids. Centerline shift errors caused by conventional methods can be reduced to less than 1 nm.
- a measuring apparatus 100 includes a microscope 102, such as a scanning electron microscope, an optical microscope or an atomic force microscope having a stage 104 for positioning a structure 106 to be measured.
- An energy source 108 irradiates structure 106.
- a photosensitive device or electron sensitive device 109 collects reflected intensities and stores the data in a storage device 110. Alternately, deflections of a stylus (not shown) may be used to develop intensity profiles and deflection data stored in storage device 110.
- a processor 112 is used to perform calculations on the data in accordance with the present invention.
- a monitor 114 may also be included for real-time viewing of structure 106 during operation.
- the centroid of each region may be optimized by tool adjustments to the measuring apparatus. For example, signal comparison may be performed by scanning through focus. More symmetrical signals can be obtained for the intensity profile if, for example, a wafer is placed on stage 104 and moved outside of an isofocal plane as determined by the focus of the microscope 102. In this way, a better focus of surface features may be obtained. This is achieved if stage 104 can scan in the z direction. This method is iterative a first measurement is made. Then an adjustment is made to a focus control 116 (FIG. 9) to change the focus of microscope 102. A second measurement is made and the quality is assessed against the first measurement. If there is an improvement further iterations are performed to further refine the measurement.
- signal comparison may be performed by scanning through focus. More symmetrical signals can be obtained for the intensity profile if, for example, a wafer is placed on stage 104 and moved outside of an isofocal plane as determined by the focus of the microscope 102. In this way, a better focus of surface
- z' is the z component of the centroid and is indicated by H's in FIG. 6.
- H 1 and H 2 are determined for two bullets or in the alternative, two targets and are measured relative to the datum. The closer the values of H 1 and H 2 the better the quality of measurement due to the fact that symmetry is inferred from the areas of the regions and the values of H 1 and H 2 .
- a registration measurement is taken after the improved measurement has been obtained.
- the centroid may be adjusted to an optimal position by calculating an optimal centroid location. And adjusted according to the quality determination method described above, i.e.
Description
- This disclosure relates to inspection measurements and more particularly to a method and apparatus for making inspection measurements with reduced measurement error during integrated circuit fabrication.
- Overlay metrology is used for determining the quality of products, for example, integrated circuits. In particular overlay metrology is used to determine the alignment of critical features which define, for example an integrated circuit device. A misalignment of these features can cause electrical opens or shorts thus destroying product functionality. To ensure integrated circuit (IC) product quality, overlay metrology must be done with high accuracy and precision. Typically, the overlay accuracy and precision is about 3% of minimum pattern or feature size. For example, a 150 nm feature requires an overlay accuracy of ±5 nm. A major contributor to measurement uncertainty is the dependency on the feature being measured. For increasingly small scale IC devices, accurate measurement of critical features relies heavily on instruments such as precision microscopes and computer algorithms. For an accurate measurement reading from a microscope, a robust and meaningful computer algorithm is necessary.
- IC devices (chips) are fabricated on a semiconductor substrate wafers. The wafers are usually round while the IC chips are rectangular in shape and positioned in a grid across the wafer. During processing, it is necessary to monitor and align the grid of one level to that of a subsequent level to ensure proper masking and material deposition. This is required to achieve proper chip functionality.
- To monitor and maintain level to level alignment, features are built in to the chip pattern which are viewed with a microscope. These are called overlay measurement structures and are comprised of a bullet (on the aligning level) and a target (the level to be aligned to). Referring to FIG. 1, a top view of a standard
overlay metrology structure 10 is shown.Structure 10 includes surface features such as trenches orplateaus 16 below the surface andelevated structures 12 above the surface. Each feature hasedges 14 which may be used to measure dimensions between the features for inspection purposes. The illustrative example of FIG. 1 shows astructure 12 as a bullet and atrench structure 16 as a target. To further illustratestructure 10, a cross-sectional view is provided in FIG. 2. - To differentiate between
edges 14 and therefore mark centerlines, typically an optical microscope, scanning electron microscope or atomic force microscope is used where reflected light or electrons are recorded by a photosensor or electron sensitive device and an intensity profile of the structure is produced (or in the case of atomic microscopy stylus deflections are used to create the intensity profile). FIG. 3 shows an example of an intensity profile across the bullets and targets in one direction (x or y) across structure 10 (FIGS. 1 and 2). The goal of the measurement in this example is to determine a distance between the centerlines of the bullet and target marks, and hence determine the resultant vector misregistration between the aligning levels (bullet to target). - The intensity profile indicates
edges 14 as a change in intensity. For example, slopedcurves edges 14 for structures 12 (bullet), and slopedcurves edges 14 for trench structures 16 (target). Edges are defined mathematically as the points of inflection or the maximum or minimum from a first derivative calculated from the structure intensity profile. A centre distance between edge pairs of the bullet,slope curves slope curves 
If different edge pairs of the bullet and target are compared, for example,slope curves 
The method described above has disadvantages if asymmetric signals are present. If a different edge pair is used to determine the centre lines a different location may result. This occurs due to the intensity profile signal's edge slope variation. The intensity profile is never perfectly symmetrical which means the slopes of the edges will be slightly different between the edges and sets of edge pairs. This error is known as centreline shift and has been observed to be of the order of 10nm σ. - European Patent Application EP0444450 A1 discloses an example of a known method involving the use of verification marks to try to align the surface of a wafer and a layer of photoresist.
- The invention defined in
independent method claim 1, seeks to provide a method of reducing measuring uncertainty in inspection systems using intensity profiles. The invention also seeks to provide a method for reducing edge slope variations in intensity profiles to better define centre points and more accurately determine misregistrations for semiconductor wafers. - In a method for reducing measurement error, the step of providing an intensity profile may further include the steps of providing an energy source for irradiating the surface feature and collecting intensity data by measuring the intensity of reflected radiation from the surface feature. The step of providing an intensity profile may further includes the steps of scanning the surface feature to determine intensity differences and collecting intensity data across the surface feature. The step of employing centroid locations and intensity profile areas of two or more surface features to assess a measurement quality may be included. The step of adjusting a focus to provide a better defined intensity profile thereby providing more reduced measurement error may be included. The step of computing the area may further include an iterative numerical integration algorithm.
- In alternate methods for reducing measurement uncertainty for reference locations between process steps, the step of providing an intensity profile may further include the steps of providing an energy source for irradiating the features and collecting intensity data by measuring the intensity of reflected radiation from the features. The step of providing an intensity profile may further includes the steps of scanning the surface feature to determine intensity differences and collecting intensity data across the surface feature. The step of employing centroid locations and intensity profile areas of two or more surface features to assess a measurement quality may be included. The method may further include the step of adjusting a focus to provide a better defined intensity profile thereby providing more reduced measurement error. The step of computing the area may further include an iterative numerical integration algorithm. The first and second reference locations may be center lines between each set of features. The first and second reference locations may be points between each set of features. The first set of features may be substantially symmetrical about a first center point, and the second set of features may substantially symmetrical about a second center point, and the method may further include the step of measuring the misregistration between the first and second center points.
- The intensity measurement device of the invention defined in
claim 10 may include an energy source for irradiating the surface features and collecting intensity data by measuring the intensity of reflected radiation from the surface features. The computing means may include a processor. The surface features may be positioned on a semiconductor wafer. The measuring device may include an optical microscope. The intensity measurement device may include a photosensor. The measuring device may include a scanning electron microscope. The intensity measurement device may include an electron sensor. The measurement device may be an atomic force microscope. - According to one aspect of the present invention there is provided a method for reducing measurement uncertainty for reference locations between process steps, wherein it comprises the steps of: providing an intensity profile for a first set of features of a first process step and for a second set of features of a second process step; computing areas for regions of the intensity profile enclosed by intensity data of the features and a threshold intensity on the intensity profile; determining a centroid location for the regions from or based on the areas calculated in the previous step; comparing centroid locations from the first set of features to determine a first reference location; comparing centroid locations from the second set of features to determine a second reference location; evaluating a difference between the first and second reference locations to determine a misregistration between the first and second set of features.
- According to another aspect of the present invention there is provided an apparatus for reducing measurement error comprising: an intensity measurement device operable to measure intensity differences of surface features, and comprising a memory for storing intensity data as a function of position of the surface features to form an intensity profile; wherein it comprises: means operable to compute areas for regions of the intensity profile enclosed by intensity data of the features and a threshold intensity on the intensity profile; means operable to determine a centroid location for the regions from or based on said computed areas for regions of the intensity profile enclosed by intensity data of the features and a threshold intensity on the intensity profile; means operable to compare centroid locations from the first set of features to determine a first reference location; means operable to compare centroid locations from the second set of features to determine a second reference location; means operable to evaluate a difference between the first and second reference locations to determine a misregistration between the first and second set of features.
- For a better understanding of the present invention, and to show how it may be brought into effect, reference will now be made, by way of example, to the accompanying drawings, in which:
- FIG. 1 is a top view of a structure to be measured;
- FIG. 2 is a cross sectional view of the structure of FIG. 1;
- FIG. 3 is a plot of an intensity profile produced by detection of reflected light or electrons across the structure of FIG. 1;
- FIG. 4 is another plot of an intensity profile of trench structures as shown in FIG. 1 and FIG. 2;
- FIG. 5 is a plot of the intensity profile of FIG. 4 showing area calculation boundaries;
- FIG. 6 is a plot of the intensity profile of FIG. 4 showing centroid locations;
- FIG. 7 is a plot of the intensity profile of FIG. 4 showing a centreline determined using the centroid locations of FIG. 6;
- FIG. 8 is a top view of the structure shown in FIG. 1 having center lines and reference points in accordance with the present invention; and
- FIG. 9 is a block diagram of a measuring apparatus in accordance with the present invention.
- The present invention relates to inspection measurements and more particularly, to a method and apparatus for making inspection measurements with reduced measurement error. A method for reducing measuring uncertainty for inspection systems using intensity profiles includes determining a centroid for a region of the intensity profile. Intensity data recorded by scanning across a wafer surface is recorded and plotted. The region below a threshold intensity is chosen and the area and the centroid for the region are calculated. The centroid for each region is then used to determine mark center lines. Based on the centroid approach the edge slope variations are averaged out and thereby reduced in effect. In the following illustrative example of the present invention reference is made to the drawings based on a Cartesian coordinate system. The coordinate system is defined by x, y and z directions which have been arbitrarily assigned and one skilled in the art understands that these designations may be substituted for one another. -
- Referring now in specific detail to the drawings in which like reference numerals-identify similar or identical elements throughout the several views, FIG. 4 is an intensity profile of a scan across resist
structures 12 andtrench structures 16 of FIGS. 1 and 2. Edge slopes 60 through 67 show variations along each edge slope curve. Edge slope curves indicate a change in intensity due to surface features. The change in intensity is evaluated relative to a baseline orthreshold intensity 68. - Referring to FIG. 5,
regions 70 through 73 are delineated byedge slopes 60 through 67.Regions 70 through 73 are enclosed by extendingthreshold 68 over each region (dashed line). Since the intensity profile is plotted in x (or y) and z (Cartesian) coordinates, or may be converted thereto, a technique in accordance with the invention is used to calculate an area forregions 70 through 73. In one embodiment, an iterative numerical integration is used, for example, the Newton method, as is known in the art. In other methods, an area may be calculated by a Trapezoid Rule, also known in the art. In a general case, the area A may be calculated as follows:
where a and b are limits along a chosen datum and threshold on the profile as illustratively indicated forregion 70 in FIG. 5, and f(x) is a function that yields a value of the ordinate (z value in this case) on a boundary of the region of the intensity profile when an abscissa value (x or y value) is provided. The chosen datum is a reference point for the measured intensity, and is preferably about 0. The threshold is also chosen as a set value of the maximum intensity. The threshold, in one embodiment, is chosen to be about 90 % of maximum intensity output from an energy source. Other threshold values, depending on the application, are also useful. Threshold values may be chosen to optimize performance of the invention. For example, the threshold values may be chosen according to user specified settings to define the desired region to integrate over to produce optimal results for specific applications. The intensity profile is developed between the datum and the threshold which may be chosen in accordance with predetermined criteria. - Referring to FIG. 6, the areas for
regions 70 through 73 are calculated above and are used to determine the value of a centroid for each region. The centroid for each region is calculated as follows. In Cartesian coordinates, the x (or y) and z components of the centroid, denoted as x' (or y') and z' may be calculated according to the following equations:

where A is the area of the region R, x and z are the respective coordinates of each differential piece of area dA. The centroid coordinates can be used to determine a centerline shift for each region for measurement diagnostics. Although Cartesian coordinates are shown other coordinate systems are contemplated. The z component of the centroid, z= may also be calculated as above and used to determine the quality of measurement as described below. -
Centroids 80 through 83 may be used to represent the location of the features on the intensity profile. In this way the variations in edge slope data are minimized and a better reference location is provided. - Referring to FIG. 7,
centroid locations 80 through 83 are compared to determine a first mark center line CL1 based on the centroids of the target (centroid locations centroid locations - Referring to FIG. 8, the first and second mark center lines, CL1 and CL2, may be produced along another symmetry line to intersect at a first mark center C1, and the second mark center lines CL2 may be produced to intersect at an outer mark center C2. The first and second mark centers, C1 and C2, are then compared to determine the amount of overlay misregistration (bullet relative to the target, i.e C2 to C1). A more accurate mark center location may be provided by using the centroid calculated for each region. In this way, the edge slope variations are avoided. The method of the present invention allows a single center determination to be carried out without being limited to a constant threshold with the ability to select a datum and threshold and calculate centerlines based on mark centroids. Centerline shift errors caused by conventional methods can be reduced to less than 1 nm.
- Referring to FIG. 9, a measuring
apparatus 100 includes amicroscope 102, such as a scanning electron microscope, an optical microscope or an atomic force microscope having astage 104 for positioning astructure 106 to be measured. Anenergy source 108 irradiatesstructure 106. A photosensitive device or electronsensitive device 109 collects reflected intensities and stores the data in astorage device 110. Alternately, deflections of a stylus (not shown) may be used to develop intensity profiles and deflection data stored instorage device 110. Aprocessor 112 is used to perform calculations on the data in accordance with the present invention. Amonitor 114 may also be included for real-time viewing ofstructure 106 during operation. - The centroid of each region may be optimized by tool adjustments to the measuring apparatus. For example, signal comparison may be performed by scanning through focus. More symmetrical signals can be obtained for the intensity profile if, for example, a wafer is placed on
stage 104 and moved outside of an isofocal plane as determined by the focus of themicroscope 102. In this way, a better focus of surface features may be obtained. This is achieved ifstage 104 can scan in the z direction. This method is iterative a first measurement is made. Then an adjustment is made to a focus control 116 (FIG. 9) to change the focus ofmicroscope 102. A second measurement is made and the quality is assessed against the first measurement. If there is an improvement further iterations are performed to further refine the measurement. If there is no improvement further adjustments may be made to improve the quality of the measurement. One criteria for determining the quality of the measurement is to calculate z' as described above. z' is the z component of the centroid and is indicated by H's in FIG. 6. H1 and H2 are determined for two bullets or in the alternative, two targets and are measured relative to the datum. The closer the values of H1 and H2 the better the quality of measurement due to the fact that symmetry is inferred from the areas of the regions and the values of H1 and H2. A registration measurement is taken after the improved measurement has been obtained. In still other preferred methods, the centroid may be adjusted to an optimal position by calculating an optimal centroid location. And adjusted according to the quality determination method described above, i.e. the closer the values of H1 and H2 the better the quality of measurement. Having described illustrative embodiments for reducing measurement error for inspection measurements (which are intended to be illustrative and not limiting), it is noted that modifications and variations can be made by persons skilled in the art in the light of the above teachings. Having thus described the invention with the details, what is claimed and desired protected is set forth in the appended claims.
Claims (11)
- A method for reducing measurement uncertainty for reference locations between process steps, characterised in that it comprises the steps of:providing an intensity profile for a first set of features (16) of a first process step and for a second set of features (12) of a second process step;computing areas for regions (70, 71, 72, 73) of the intensity profile enclosed by intensity data of the features and a threshold intensity (68) on the intensity profile;determining a centroid location (80, 81, 82, 83) for the regions (70, 71, 72, 73) from or based on the areas calculated in the previous step;comparing centroid locations (81, 82) from the first set of features (16) to determine a first reference location (CL1);comparing centroid locations (80, 83) from the second set of features (12) to determine a second reference location (CL2) ;evaluating a difference between the first and second reference locations (CL1, CL2) to determine a misregistration between the first and second set of features.
- The method for reducing measurement uncertainty for reference locations between process steps as claimed in claim 1, wherein the step of providing an intensity profile further comprises the steps of:providing an energy source for irradiating the features; andcollecting intensity data by measuring the intensity of reflected radiation from the features.
- The method for reducing measurement uncertainty for reference locations between process steps as claimed in claims 1 or 2, wherein the first and second reference locations (CL1, CL2) are centre lines between each set of features.
- The method for reducing measurement uncertainty for reference locations between process steps as claimed in claims 1 or 2, wherein the first and second reference locations (CL1, CL2) are points between each set of features.
- The method for reducing measurement uncertainty for reference locations between process steps as claimed in any preceding claim, wherein the first set of features (16) are substantially symmetrical about a first centre point, and the second set of features (12) are substantially symmetrical about a second centre point, and further includes the step of measuring the misregistration between the first and second centre points.
- The method for reducing measurement uncertainty for reference locations between process steps as claimed in any preceding claim, wherein the step of providing an intensity profile further comprises the steps of:scanning the feature to determine intensity differences; andcollecting intensity data across features.
- The method for reducing measurement uncertainty for reference locations between process steps as claimed in any preceding claim, further comprising the step of adjusting a focus to provide a better defined intensity profile thereby providing a reduced measurement error.
- The method for reducing measurement uncertainty for reference locations between process steps as claimed in any preceding claim, wherein the step of computing areas further includes an iterative numerical integration algorithm.
- The method for reducing measurement uncertainty for reference locations between process steps as claimed in any preceding claim, further comprising the step of employing centroid locations (80, 81, 82, 83) and intensity profile areas of two of more features to assess a measurement quality.
- An apparatus for reducing measurement error comprising:an intensity measurement device operable to measure intensity differences of surface features, and comprising a memory for storing intensity data as a function of position of the surface features to form an intensity profile;characterised in that it comprises:means operable to compute areas for regions of the intensity profile enclosed by intensity data of the features and a threshold intensity on the intensity profile ;means operable to determine a centroid location (80, 81, 82, 83) for the regions (70, 71, 72, 73) from or based on said computed areas for regions of the intensity profile enclosed by intensity data of the features and a threshold intensity on the intensity profile;means operable to compare centroid locations (81, 82) from the first set of features (16) to determine a first reference location (CL1);means operable to compare centroid locations (80, B3) from the second set of features (12) to determine a second reference location (CL2);means operable to evaluate a difference between the first and second reference locations (CL1, CL2) to determine a misregistration between the first and second set of features.
- The apparatus claimed in claim 10, wherein the intensity measurement device includes an energy source operable to irradiate the surface features and collect intensity data by measuring the intensity of reflected radiation from the surface features.
Applications Claiming Priority (2)
| Application Number | Priority Date | Filing Date | Title |
|---|---|---|---|
| US5228298A | 1998-03-31 | 1998-03-31 | |
| US52282 | 1998-03-31 |
Publications (3)
| Publication Number | Publication Date |
|---|---|
| EP0947828A2 EP0947828A2 (en) | 1999-10-06 |
| EP0947828A3 EP0947828A3 (en) | 2001-10-31 |
| EP0947828B1 true EP0947828B1 (en) | 2006-10-25 |
Family
ID=21976580
Family Applications (1)
| Application Number | Title | Priority Date | Filing Date |
|---|---|---|---|
| EP99302557A Expired - Lifetime EP0947828B1 (en) | 1998-03-31 | 1999-03-31 | Method and apparatus for improved inspection measurements |
Country Status (6)
| Country | Link |
|---|---|
| EP (1) | EP0947828B1 (en) |
| JP (1) | JPH11325877A (en) |
| KR (1) | KR19990078430A (en) |
| CN (1) | CN1238461A (en) |
| DE (1) | DE69933726T2 (en) |
| TW (1) | TW414992B (en) |
Cited By (1)
| Publication number | Priority date | Publication date | Assignee | Title |
|---|---|---|---|---|
| USRE45245E1 (en) | 2000-08-30 | 2014-11-18 | Kla-Tencor Corporation | Apparatus and methods for determining overlay of structures having rotational or mirror symmetry |
Families Citing this family (16)
| Publication number | Priority date | Publication date | Assignee | Title |
|---|---|---|---|---|
| TW494519B (en) * | 2000-06-19 | 2002-07-11 | Infineon Technologies Corp | Method for determining overlay measurement uncertainty |
| US6727989B1 (en) * | 2000-06-20 | 2004-04-27 | Infineon Technologies Ag | Enhanced overlay measurement marks for overlay alignment and exposure tool condition control |
| EP1314198B1 (en) * | 2000-08-30 | 2017-03-08 | KLA-Tencor Corporation | Overlay marks, methods of overlay mark design and methods of overlay measurements |
| US7068833B1 (en) | 2000-08-30 | 2006-06-27 | Kla-Tencor Corporation | Overlay marks, methods of overlay mark design and methods of overlay measurements |
| US7804994B2 (en) | 2002-02-15 | 2010-09-28 | Kla-Tencor Technologies Corporation | Overlay metrology and control method |
| US7075639B2 (en) | 2003-04-25 | 2006-07-11 | Kla-Tencor Technologies Corporation | Method and mark for metrology of phase errors on phase shift masks |
| US7608468B1 (en) | 2003-07-02 | 2009-10-27 | Kla-Tencor Technologies, Corp. | Apparatus and methods for determining overlay and uses of same |
| US7346878B1 (en) | 2003-07-02 | 2008-03-18 | Kla-Tencor Technologies Corporation | Apparatus and methods for providing in-chip microtargets for metrology or inspection |
| US9927718B2 (en) | 2010-08-03 | 2018-03-27 | Kla-Tencor Corporation | Multi-layer overlay metrology target and complimentary overlay metrology measurement systems |
| US10890436B2 (en) | 2011-07-19 | 2021-01-12 | Kla Corporation | Overlay targets with orthogonal underlayer dummyfill |
| WO2013150585A1 (en) * | 2012-04-02 | 2013-10-10 | 三菱電機株式会社 | Edge detecting apparatus |
| CN103995439B (en) * | 2014-06-12 | 2016-03-02 | 上海华力微电子有限公司 | A kind of method determining lithographic process window online |
| US10451412B2 (en) | 2016-04-22 | 2019-10-22 | Kla-Tencor Corporation | Apparatus and methods for detecting overlay errors using scatterometry |
| EP3499311A1 (en) * | 2017-12-14 | 2019-06-19 | ASML Netherlands B.V. | Method for controlling a manufacturing apparatus and associated aparatuses |
| EP3779882B1 (en) * | 2019-08-16 | 2022-07-20 | Sick IVP AB | Providing intensity peak position in image data from light triangulation in a three-dimensional imaging system |
| CN112631090B (en) * | 2019-09-24 | 2022-09-27 | 长鑫存储技术有限公司 | Overlay mark and overlay error testing method |
Family Cites Families (4)
| Publication number | Priority date | Publication date | Assignee | Title |
|---|---|---|---|---|
| US4149085A (en) * | 1978-01-16 | 1979-04-10 | International Business Machines Corporation | Automatic overlay measurements using an electronic beam system as a measurement tool |
| US5124927A (en) * | 1990-03-02 | 1992-06-23 | International Business Machines Corp. | Latent-image control of lithography tools |
| GB9603262D0 (en) * | 1996-02-16 | 1996-04-17 | Bio Rad Micromeasurements Ltd | Positional measurements |
| JP2842362B2 (en) * | 1996-02-29 | 1999-01-06 | 日本電気株式会社 | Superposition measurement method |
-
1999
- 1999-03-30 JP JP11089121A patent/JPH11325877A/en not_active Withdrawn
- 1999-03-31 KR KR1019990011140A patent/KR19990078430A/en not_active Application Discontinuation
- 1999-03-31 DE DE69933726T patent/DE69933726T2/en not_active Expired - Fee Related
- 1999-03-31 EP EP99302557A patent/EP0947828B1/en not_active Expired - Lifetime
- 1999-03-31 CN CN99104625A patent/CN1238461A/en active Pending
- 1999-05-10 TW TW088104995A patent/TW414992B/en not_active IP Right Cessation
Cited By (1)
| Publication number | Priority date | Publication date | Assignee | Title |
|---|---|---|---|---|
| USRE45245E1 (en) | 2000-08-30 | 2014-11-18 | Kla-Tencor Corporation | Apparatus and methods for determining overlay of structures having rotational or mirror symmetry |
Also Published As
| Publication number | Publication date |
|---|---|
| TW414992B (en) | 2000-12-11 |
| DE69933726T2 (en) | 2007-10-04 |
| CN1238461A (en) | 1999-12-15 |
| KR19990078430A (en) | 1999-10-25 |
| EP0947828A2 (en) | 1999-10-06 |
| DE69933726D1 (en) | 2006-12-07 |
| EP0947828A3 (en) | 2001-10-31 |
| JPH11325877A (en) | 1999-11-26 |
Similar Documents
| Publication | Publication Date | Title |
|---|---|---|
| EP0947828B1 (en) | Method and apparatus for improved inspection measurements | |
| US7643961B2 (en) | Position detecting device and position detecting method | |
| US8148682B2 (en) | Method and apparatus for pattern position and overlay measurement | |
| US6549648B1 (en) | Method for determining a position of a structural element on a substrate | |
| US5805866A (en) | Alignment method | |
| US6128089A (en) | Combined segmented and nonsegmented bar-in-bar targets | |
| EP0444450B1 (en) | Latent-image control of lithography tools | |
| KR100255399B1 (en) | Condition optimization method for measuring overlay accuracy of pattern | |
| US7477396B2 (en) | Methods and systems for determining overlay error based on target image symmetry | |
| EP0965889A2 (en) | Overlay measurement technique using moire patterns | |
| US7894660B2 (en) | Image processing alignment method and method of manufacturing semiconductor device | |
| US5868560A (en) | Reticle, pattern transferred thereby, and correction method | |
| US20070081161A1 (en) | Alignment method and apparatus and exposure apparatus | |
| US7336352B2 (en) | Position detection apparatus | |
| JP3339079B2 (en) | Alignment apparatus, exposure apparatus using the alignment apparatus, alignment method, exposure method including the alignment method, device manufacturing method including the exposure method, device manufactured by the device manufacturing method | |
| US6980304B2 (en) | Method for measuring a characteristic dimension of at least one pattern on a disc-shaped object in a measuring instrument | |
| JP2001189263A (en) | Method of inspecting misalignment and charge beam exposure method | |
| US6727989B1 (en) | Enhanced overlay measurement marks for overlay alignment and exposure tool condition control | |
| KR100950488B1 (en) | Exposure apparatus | |
| JPH06151274A (en) | Method and device for positioning semiconductor integrated circuit pattern | |
| WO2001098835A1 (en) | Method for determining overlay measurement uncertainty | |
| EP1930777B1 (en) | Exposure Apparatus | |
| EP0890983A1 (en) | Measurement pattern set and method for measuring dimension accuracy and overlay accuracy of circuit pattern | |
| US6785615B2 (en) | Method and structure for detection of electromechanical problems using variance statistics in an E-beam lithography device | |
| JPH0737770A (en) | Alignment apparatus |
Legal Events
| Date | Code | Title | Description |
|---|---|---|---|
| PUAI | Public reference made under article 153(3) epc to a published international application that has entered the european phase |
Free format text: ORIGINAL CODE: 0009012 |
|
| AK | Designated contracting states |
Kind code of ref document: A2 Designated state(s): AT BE CH CY DE DK ES FI FR GB GR IE IT LI LU MC NL PT SE Kind code of ref document: A2 Designated state(s): DE FR GB IE |
|
| AX | Request for extension of the european patent |
Free format text: AL;LT;LV;MK;RO;SI |
|
| PUAL | Search report despatched |
Free format text: ORIGINAL CODE: 0009013 |
|
| AK | Designated contracting states |
Kind code of ref document: A3 Designated state(s): AT BE CH CY DE DK ES FI FR GB GR IE IT LI LU MC NL PT SE |
|
| AX | Request for extension of the european patent |
Free format text: AL;LT;LV;MK;RO;SI |
|
| 17P | Request for examination filed |
Effective date: 20020422 |
|
| AKX | Designation fees paid |
Free format text: DE FR GB IE |
|
| 17Q | First examination report despatched |
Effective date: 20050502 |
|
| RAP1 | Party data changed (applicant data changed or rights of an application transferred) |
Owner name: INTERNATIONAL BUSINESS MACHINES CORPORATION Owner name: INFINEON TECHNOLOGIES AG |
|
| GRAP | Despatch of communication of intention to grant a patent |
Free format text: ORIGINAL CODE: EPIDOSNIGR1 |
|
| GRAS | Grant fee paid |
Free format text: ORIGINAL CODE: EPIDOSNIGR3 |
|
| GRAA | (expected) grant |
Free format text: ORIGINAL CODE: 0009210 |
|
| AK | Designated contracting states |
Kind code of ref document: B1 Designated state(s): DE FR GB IE |
|
| REG | Reference to a national code |
Ref country code: GB Ref legal event code: FG4D |
|
| REG | Reference to a national code |
Ref country code: HK Ref legal event code: WD Ref document number: 1022016 Country of ref document: HK |
|
| REG | Reference to a national code |
Ref country code: IE Ref legal event code: FG4D |
|
| REF | Corresponds to: |
Ref document number: 69933726 Country of ref document: DE Date of ref document: 20061207 Kind code of ref document: P |
|
| EN | Fr: translation not filed | ||
| PLBE | No opposition filed within time limit |
Free format text: ORIGINAL CODE: 0009261 |
|
| STAA | Information on the status of an ep patent application or granted ep patent |
Free format text: STATUS: NO OPPOSITION FILED WITHIN TIME LIMIT |
|
| 26N | No opposition filed |
Effective date: 20070726 |
|
| GBPC | Gb: european patent ceased through non-payment of renewal fee |
Effective date: 20070331 |
|
| PG25 | Lapsed in a contracting state [announced via postgrant information from national office to epo] |
Ref country code: GB Free format text: LAPSE BECAUSE OF NON-PAYMENT OF DUE FEES Effective date: 20070331 Ref country code: FR Free format text: LAPSE BECAUSE OF FAILURE TO SUBMIT A TRANSLATION OF THE DESCRIPTION OR TO PAY THE FEE WITHIN THE PRESCRIBED TIME-LIMIT Effective date: 20070608 |
|
| PG25 | Lapsed in a contracting state [announced via postgrant information from national office to epo] |
Ref country code: IE Free format text: LAPSE BECAUSE OF NON-PAYMENT OF DUE FEES Effective date: 20070402 |
|
| PGFP | Annual fee paid to national office [announced via postgrant information from national office to epo] |
Ref country code: DE Payment date: 20080510 Year of fee payment: 10 |
|
| PG25 | Lapsed in a contracting state [announced via postgrant information from national office to epo] |
Ref country code: FR Free format text: LAPSE BECAUSE OF FAILURE TO SUBMIT A TRANSLATION OF THE DESCRIPTION OR TO PAY THE FEE WITHIN THE PRESCRIBED TIME-LIMIT Effective date: 20061025 |
|
| PG25 | Lapsed in a contracting state [announced via postgrant information from national office to epo] |
Ref country code: DE Free format text: LAPSE BECAUSE OF NON-PAYMENT OF DUE FEES Effective date: 20091001 |