EP0807809B1 - System for indentifying materials by NIR spectrometry - Google Patents
System for indentifying materials by NIR spectrometry Download PDFInfo
- Publication number
- EP0807809B1 EP0807809B1 EP97107518A EP97107518A EP0807809B1 EP 0807809 B1 EP0807809 B1 EP 0807809B1 EP 97107518 A EP97107518 A EP 97107518A EP 97107518 A EP97107518 A EP 97107518A EP 0807809 B1 EP0807809 B1 EP 0807809B1
- Authority
- EP
- European Patent Office
- Prior art keywords
- product
- cluster
- vector
- vectors
- unknown
- Prior art date
- Legal status (The legal status is an assumption and is not a legal conclusion. Google has not performed a legal analysis and makes no representation as to the accuracy of the status listed.)
- Expired - Lifetime
Links
- 239000000463 material Substances 0.000 title description 21
- 238000004611 spectroscopical analysis Methods 0.000 title 1
- 239000013598 vector Substances 0.000 claims description 191
- 238000000034 method Methods 0.000 claims description 73
- 238000000513 principal component analysis Methods 0.000 claims description 17
- 238000000862 absorption spectrum Methods 0.000 claims description 11
- 238000010276 construction Methods 0.000 claims description 3
- 238000001228 spectrum Methods 0.000 description 67
- 239000011159 matrix material Substances 0.000 description 49
- 238000012549 training Methods 0.000 description 22
- 230000003595 spectral effect Effects 0.000 description 18
- 230000000875 corresponding effect Effects 0.000 description 11
- 238000005259 measurement Methods 0.000 description 9
- 238000004458 analytical method Methods 0.000 description 7
- 238000002835 absorbance Methods 0.000 description 6
- 230000014509 gene expression Effects 0.000 description 5
- 238000002329 infrared spectrum Methods 0.000 description 4
- 238000000354 decomposition reaction Methods 0.000 description 3
- 238000002310 reflectometry Methods 0.000 description 3
- 238000012935 Averaging Methods 0.000 description 2
- 238000013144 data compression Methods 0.000 description 2
- 238000010586 diagram Methods 0.000 description 2
- 230000001131 transforming effect Effects 0.000 description 2
- 238000011481 absorbance measurement Methods 0.000 description 1
- 230000002596 correlated effect Effects 0.000 description 1
- 230000001186 cumulative effect Effects 0.000 description 1
- 238000000556 factor analysis Methods 0.000 description 1
- 239000012535 impurity Substances 0.000 description 1
- 230000001678 irradiating effect Effects 0.000 description 1
- 238000002372 labelling Methods 0.000 description 1
- 238000004519 manufacturing process Methods 0.000 description 1
- 238000012986 modification Methods 0.000 description 1
- 230000004048 modification Effects 0.000 description 1
- 238000004445 quantitative analysis Methods 0.000 description 1
- 230000004044 response Effects 0.000 description 1
- 238000000926 separation method Methods 0.000 description 1
- 230000009466 transformation Effects 0.000 description 1
Images

Classifications
-
- G—PHYSICS
- G01—MEASURING; TESTING
- G01N—INVESTIGATING OR ANALYSING MATERIALS BY DETERMINING THEIR CHEMICAL OR PHYSICAL PROPERTIES
- G01N21/00—Investigating or analysing materials by the use of optical means, i.e. using sub-millimetre waves, infrared, visible or ultraviolet light
- G01N21/17—Systems in which incident light is modified in accordance with the properties of the material investigated
- G01N21/25—Colour; Spectral properties, i.e. comparison of effect of material on the light at two or more different wavelengths or wavelength bands
- G01N21/31—Investigating relative effect of material at wavelengths characteristic of specific elements or molecules, e.g. atomic absorption spectrometry
- G01N21/35—Investigating relative effect of material at wavelengths characteristic of specific elements or molecules, e.g. atomic absorption spectrometry using infrared light
- G01N21/359—Investigating relative effect of material at wavelengths characteristic of specific elements or molecules, e.g. atomic absorption spectrometry using infrared light using near infrared light
-
- G—PHYSICS
- G06—COMPUTING; CALCULATING OR COUNTING
- G06F—ELECTRIC DIGITAL DATA PROCESSING
- G06F18/00—Pattern recognition
- G06F18/20—Analysing
- G06F18/21—Design or setup of recognition systems or techniques; Extraction of features in feature space; Blind source separation
- G06F18/213—Feature extraction, e.g. by transforming the feature space; Summarisation; Mappings, e.g. subspace methods
- G06F18/2135—Feature extraction, e.g. by transforming the feature space; Summarisation; Mappings, e.g. subspace methods based on approximation criteria, e.g. principal component analysis
-
- G—PHYSICS
- G06—COMPUTING; CALCULATING OR COUNTING
- G06F—ELECTRIC DIGITAL DATA PROCESSING
- G06F18/00—Pattern recognition
- G06F18/20—Analysing
- G06F18/23—Clustering techniques
- G06F18/231—Hierarchical techniques, i.e. dividing or merging pattern sets so as to obtain a dendrogram
-
- G—PHYSICS
- G06—COMPUTING; CALCULATING OR COUNTING
- G06V—IMAGE OR VIDEO RECOGNITION OR UNDERSTANDING
- G06V10/00—Arrangements for image or video recognition or understanding
- G06V10/70—Arrangements for image or video recognition or understanding using pattern recognition or machine learning
- G06V10/762—Arrangements for image or video recognition or understanding using pattern recognition or machine learning using clustering, e.g. of similar faces in social networks
- G06V10/7625—Hierarchical techniques, i.e. dividing or merging patterns to obtain a tree-like representation; Dendograms
-
- G—PHYSICS
- G06—COMPUTING; CALCULATING OR COUNTING
- G06V—IMAGE OR VIDEO RECOGNITION OR UNDERSTANDING
- G06V10/00—Arrangements for image or video recognition or understanding
- G06V10/70—Arrangements for image or video recognition or understanding using pattern recognition or machine learning
- G06V10/77—Processing image or video features in feature spaces; using data integration or data reduction, e.g. principal component analysis [PCA] or independent component analysis [ICA] or self-organising maps [SOM]; Blind source separation
- G06V10/7715—Feature extraction, e.g. by transforming the feature space, e.g. multi-dimensional scaling [MDS]; Mappings, e.g. subspace methods
-
- G—PHYSICS
- G16—INFORMATION AND COMMUNICATION TECHNOLOGY [ICT] SPECIALLY ADAPTED FOR SPECIFIC APPLICATION FIELDS
- G16C—COMPUTATIONAL CHEMISTRY; CHEMOINFORMATICS; COMPUTATIONAL MATERIALS SCIENCE
- G16C20/00—Chemoinformatics, i.e. ICT specially adapted for the handling of physicochemical or structural data of chemical particles, elements, compounds or mixtures
- G16C20/20—Identification of molecular entities, parts thereof or of chemical compositions
Description
- This invention relates to a method for identifying materials and, more particularly, to a method making use of infrared analysis to match an unknown material with one of a large number of known materials and in this manner identify the unknown material as being the same as the material with which it matches.
- A multi-component quantitative analytical method is known (
WO 85/01348A - Industrial concerns have a need to be able to qualitatively analyze a material to identify the material. For example, when a purchased material has been received, it will normally be identified by labeling and by shipping documents, but these indications are sometimes in error or are missing. By having a method to quickly identify a material when it is received, the material can be identified even if it is mislabeled or the identification of the material is missing before the purchasing company accepts the material and becomes financially responsible for paying for the received material.
- Prior to the present invention, infrared analysis had been used to qualitatively identify known materials. One such system making use of infrared analysis is described in
U.S. Patent No. 4,766,551 to Timothy H. Begley issued August 23, 1988 . In the system of the Begley patent, the near infrared (NIR) spectrum of a large number of known products are measured by detecting the absorbance of each known product at incremental wavelengths distributed throughout the NIR spectrum. The measurements at each incremental wavelength making up 2 measurements are considered to be an orthogonal component of a vector extending in ℓ-dimensional space. The spectrum of the unknown material is also measured and is represented by a vector extending in ℓ-dimensional space. The angle between the vector of the unknown product and the vector of each of the known products is calculated and if the angle between the known product and an unknown product is less than a predetermined minimum, the unknown product is considered to be the same as the known product. - The above-described system is reasonably accurate in identifying unknown materials but it takes a substantial amount of time to complete the vector analysis to make the comparison of the unknown product with each known material. Accordingly, this system is not suitable for making a rapid identification of an unknown material such as might be needed on a loading dock.
- The present invention may be considered an improved method, as defined by the claims, which makes it possible to identify unknown materials very quickly.
- In accordance with the invention, a series of absorbance spectra are measured for a large number of known products. A set of spectra for each known product is determined from different batches of the same product having minor variations, such as might occur from being manufactured by a different process or by having permissible levels of impurities within the product. Each set of spectra comprises absorbance values measured at wavelengths distributed over the near infrared range from 1100 nanometers to 2500 nanometers. The set of spectra for each known product is subjected to principle component analysis to the condense the data representing each product to the order of 10 to 20 values or, more specifically, dimensions. The principle component analysis data compression will result in a set of data which will contain about 90 percent or more of the original set of spectra for a given product. The values of the condensed data for a given product are considered to represent a vector, extending in multidimensional or hyperspace and is referred to as a product score vector. Vectors representing the known products are divided into clusters each consisting of vectors close to one another in the hyperspace in which the vectors extend. The vectors all extend from a common origin in hyperspace and the phrase "position of the vector" refers to the position of the end point of the vector in hyperspace. Accordingly, the closeness of the vectors refers to the closeness of the end points of the vectors. A hypersphere, which is a multi-dimensional sphere, is constructed around the position in hyperspace represented by each known product score vector. The radius of the hypersphere will be a scaler quantity times the Euclidean norm determined from the standard deviation spectrum for the product based on the original set of spectra data obtained for the product. By making the
scaler multiplier 3, the hypersphere will encompass the positions of 99 percent of the product vectors of all products which are the same as the known product represented by the product vector at the center of the hypersphere. Following the construction of the hyperspheres around each point in space represented by each known product vector, envelopes are constructed around each group of products which are in the same cluster. These envelopes are preferably defined by rectangular coordinates in hyperdimensional space and, accordingly, correspond to a rectangular parallelepiped in three-dimensional space and may be appropriately termed a hyper-rectangular-parallelepiped. For convenience this structure will be referred to as a hyper-box. Each hyper-box will be defined by a minimum and maximum dimension in each of the n-dimensions of the hyperspace. - The clustering technique initially divides the vectors representing the known products into clusters having different numbers of vectors in a given cluster. For example, some clusters may have as many as 50 vectors contained therein and other clusters may have only 9 or 10 vectors contained therein or less. When the number of vectors within a cluster exceeds a selected number, for example, between 10 and 20, the vectors within that cluster are divided into child clusters or subclusters by applying principal component analysis to the spectra of the cluster. The child clusters are further divided into grandchild clusters or subclusters to define a hierarchial tree of clusters. The division process is carried out until the number of vectors in a given cluster at the most divided level does not exceed the selected number, preferably between 10 and 20. Each of the clusters and subclusters are surrounded by an envelope in the form of a hyper-box. The dimensions of each hyper-box are selected so that it encompasses each hypersphere of each known product vector within the cluster.
- When an unknown product is received to be identified, the near infrared spectra of the product is measured yielding absorbance values extending throughout the near infrared range, for example, from 1100 nanometers to 2500 nanometers. This spectral data is processed so as to construct a score vector representing the product, which vector extends in the same space and corresponds to the vectors representing known products. In accordance with the invention, it is first determined whether or not the score vector for the unknown product falls within the envelope of any of the highest order clusters in the hierarchial tree. If the vector of the unknown product falls in a cluster which has subclusters, a score vector of the unknown product is then compared with each of these subclusters at the next level in the hierarchial tree to determine if the vector of the unknown product falls within the envelope surrounding one of the subclusters. If the vector for the unknown product is then determined to fall into a subcluster which is further divided into subclusters, the process is then repeated at the next level down in the hierarchial tree until a score vector of the unknown product is determined to fall into a cluster or subcluster at the lowest level in the hierarchial tree. In this manner, the vector will have been determined to be the same as one of the products in the cluster or subcluster at this lowest level of the hierarchial tree. Since the subcluster or cluster will have at most 10 to 20 products in the cluster, the number of products to which the unknown product will correspond will have been reduced to 10 to 20 products or less. As indicated above, the number of products in the subcluster may be as few as 2 or may be as many as the selected maximum number between 10 or 20. Following the determination of the final subcluster in which the product falls, an exhaustive comparison is made between the spectrum of the unknown product with the spectra and each known product in the final subcluster to determine which product the unknown product corresponds.
- At any point during a process if it is determined that the vector of the unknown product does not fall within any cluster or finally to correspond to any product in the final subcluster, the unknown product is considered to be what is known as an outlier and is determined not to correspond to any of the known products.
- The clustering technique described above permits a quick search of the spectra in the library of known products to narrow the number of known products to match the unknown product to a few candidate products in the library. After this quick search by the above-identified process, an exhaustive comparison is made of the library spectra representing just those candidate known products, to which the clustering technique narrowed the search, to positively identify the unknown product as matching one of the known products. This exhaustive comparison on the search involves a relatively time consuming comparison of the spectral data of unknown product with sets of spectral data of the known candidate products to which the search has been narrowed by the clustering technique. Because this comparison is with just a few candidate products, the entire identification process is reduced to a small fraction of the time required by the prior art processes to identify a known product. Yet, because an exhaustive comparison is made of the unknown product with the spectra of the candidate products identified by the clustering technique, the accuracy of the identifying process is very high and is equal to that of the prior art processes.
-
-
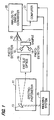
Fig. 1 is a block diagram illustrating the apparatus used with the method of the invention; -
Fig. 2 is a block diagram of the process representing the known products by vectors and dividing the vectors into a hierarchial tree of clusters and subclusters; -
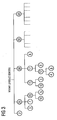
Fig. 3 illustrates an example of how known products might be divided into clusters by the process of the invention; -
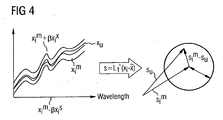
Fig. 4 is a schematic illustration of the process of projecting a product mean and standard deviation spectra into principal component inside model space as a score vector and surrounding the score vector with a hypersphere; -
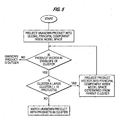
Fig. 5 is a flow chart representing the process of the system of the invention of comparing an unknown product represented by a vector with the clustered vectors of the known products to determine an identification of the unknown product. - The apparatus used with the method of the invention comprises a near
infrared spectrometer 11 having anoscillating grating 13 on which the spectrometer directs light. Thegrating 13 reflects light with a narrow wavelength band throughexit slit optics 15 to asample 17. As the grating oscillates, the center wavelength of the light that irradiates the sample is swept through the near infrared spectrum. Light from the diffraction grating that is reflected by the sample is detected byinfrared photodetectors 19. The photodetectors generate a signal that is transmitted to an analog-to-digital converter 22 byamplifier 20. Anindexing system 23 generates pulses as the grating 13 oscillates and applies these pulses to acomputer 21 and to the analog-to-digital converter 22. In response to the pulses from theindexing system 23, the analog-to-digital converter converts successive samples of the output signal of theamplifier 20 to digital values. Each digital value thus corresponds to the reflectivity of the sample at a specific wavelength in the near infrared range. Thecomputer 21 monitors the angular position of the grating 13 and accordingly monitors the wavelength irradiating the sample as the grating oscillates, by counting the pulses produced by theindexing system 23. The pulses produced by theindexing system 23 define incremental index points at which values of the output signal of the amplifier are converted to digital values. The index points are distributed incrementally throughout the near infrared spectrum and each correspond to a different wavelength at which the sample is irradiated. Thecomputer 21 converts each reflectivity value to an absorbance of the material at the corresponding wavelength. The structure and operation of a suitable spectrometer is described in greater detail inU.S. Patent No. 4,969,739 . - The instrument shown in
Figure 1 is used to measure the absorbance spectra from a large number of known products and stores a library of these spectra in its disc memory. The products from which the library of spectra are obtained are selected to be those which will be likely to correspond to an unknown product to be identified by the system of the present invention. The library of the spectra are subjected to principal component analysis using singular value decomposition. The singular decomposition algorithm is used to determine principal component model space in order to reduce the number of values representing the spectrum of each product in the library of products. - In accordance with the invention, several different samples of each product for the library are obtained and each of the different samples of a given product are selected to have minor variations from each other such as would occur from being provided by different manufacturers or being produced by different manufacturing processes.
- The system shown in
Fig. 1 is used to measure and obtain an absorbance spectrum of each sample of each product thus providing a plurality of spectra for each product. Each spectrum is measured at the same incremental wavelengths. - The several spectra for the different samples of a product in the library is called a training set. If there are n samples of a given product so that there are n spectra in a training set for a product, then the spectrum of one sample in the training set can be represented as follows:

in which xi is a column vector made up of reflectance measurements xi1 through xiℓ taken from the sample i at each of the incremental wavelength points 1 through ℓ. In accordance with the invention, the computer determines a mean spectra from each product training set by averaging the reflectivity values of the training set at each wavelength to thus determine a mean spectra for the product which can be represented as follows:
In the above equation xm is a column vector of the mean spectrum values and x1 to xn are each column vectors representing the spectrum of each of the samples 1 through n. - As described in the above-mentioned Begley patent, each known product may be represented by a multidimensional vector extending in hyperspace wherein each dimension of the vector is defined as a different one of the absorbance measurements distributed throughout the spectrum. Typically, the near infrared spectrum is measured by 700 incremental measurements distributed throughout the spectrum so that in the system of the Begley patent, each known product will be represented by a 700 dimensional vector.
- In the method of the present invention, to reduce the computation required and thereby reduce the amount of time to make the computation to identify the products, the spectra of the products are subjected to principal component analysis. This process reduces the number of numerical values representing each product so that each product may be represented by a vector extending in hyperspace of substantially fewer dimensions, e.g. 10 to 20 dimensions. To carry out the principal component analysis, first a global principal component model space is determined from the mean spectra representing the library of known products. As a first step of this process, the column vectors of the mean spectra are considered to form a matrix X as follows:

In this expression xm 1 through xm n each represents a column vector of a mean spectrum for a different one of the products in the product library of known products 1 through n. This expression for the mean spectral matrix of the product library is simplified by dropping the superscript as follows:
From the spectra x1 through xn a mean column vectorx is determined by averaging the values in the spectral matrix X at each wavelength. Since X is spectral matrix of mean vectors, the mean vectorx will actually be a mean vector of a set of mean vectors which is determined from the vectors in the matrix X ofEquation 3 as follows:
wherein x1 through xn are mean vectors representing the different products in the spectral library. The vectorx thus represents an average absorbance at each wavelength from these mean vectors representing the known products. From the global mean vectorx , a mean centered matrixX is calculated as follows:
Each of the expressions (x1-x ) through (xn-x ) is a column vector and each column vector is determined by subtracting the global mean vectorx from each of the product mean vectors x1 through xn. Singular value decomposition is then applied to the mean centered matrixX to obtain
in which U is an ℓ by n matrix of orthonormal vectors, V' is an n by n matrix of orthonormal vectors and W is an n by n diagonal matrix. The diagonal elements of W are
and are singular values ofX . The values w1 through wn are defined as the square root of the eigenvalues of the covariance matrixX 'X whereinX ' is the transpose ofX . The eigenvalues of the covariance matrixX 'X corresponding to the squares of w1 through wn are represented as λ1 through λn. The principal components of the mean centered spectral data matrixX are the eigenvectors of the covariance matrixX 'X , which are associated with the nonzero eigenvalues. The column vectors of U in theExpression 7 which are associated with nonzero eigenvalues are these eigenvectors and are the principal components for the mean centered spectral matrixX . Since there are n different mean centered product spectra making up the column vectors ofX , there are n column vectors in the mean centered matrixX and there exist n-1 nonzero singular values ofX . Accordingly, there are n-1 principal components of the matrixX . TheExpression 7 can be rewritten in the following standard form in principal component analysis:
in which L is an ℓ by n-1 matrix expressed as follows:
In the matrix L, u1 through un-1 are column vectors and comprise the principal components of the mean centered matrixX . The matrix L is referred to as the loading matrix. - In Equation (9) S is an n-1 by n matrix called the score matrix and is represented as follows:

The principal component vectors of the matrix L span a multidimensional space or hyperspace called principal component model space of the mean centered spectral matrixX . While as represented in the matrix L, the principal components (vectors) are normalized, the vector lengths are of no significance. It is the direction of the principal components in representing the coordinates of the principal component model space that is significant. Each of the column vectors in the mean centered spectral matrixX can be projected in principal component model space and represented as a linear combination of coordinate values. - The magnitude of the eigenvalues λ1 through λn-1 are proportional to the amount of variance in the mean centered spectral data matrix
X which are modeled by the corresponding principal components represented by the column vectors u1 through un-1 of the matrix L. The principal components associated with the largest eigenvalues model the largest fraction of the total variance inX . It is possible to model most of the variance in the spectral matrixX by substantially fewer than n-1 principal components. The set of nonzero eigenvalues can be partitioned in two sets, a primary set λ1 through λk, and a secondary set λk+1 through λn-1. The primary set includes all values substantially greater than zero so that the secondary set have minimum values substantially equal to zero. The primary set of eigenvalues will cover a large percentage of the cumulative variance of the mean centered spectral matrixX . In the same way the loading matrix L can be partitioned into LI and L0 wherein LI is a matrix made up of the column vectors u1 through uk called the primary principal components and L0 is a matrix made of the column vectors uk+1 through un-1 which are referred to as the secondary principal components. Equation (9) can be rewritten as:
In this equation, SI, which is a k by n matrix, can be expressed by following:
and So, which is an n-k-1 by-n matrix, can be represented as follows:
The set of primary principal component vectors represented by u1 through uk define the orthonormal basis of what is referred to as inside model space of the mean centered spectral matrixX . The set of secondary principal components represented by Vk+1 through Vn-1 define the orthonormal basis of what is defined as outside model space. Each spectrum represented by the column vectors ofX can be decomposed into the sum of two vectors. The first vector projects in the inside model space and represents the most significant correlated behavior of the vectors in principal component model space, since w1 through wk covers most of the variance inX . The second vector projects in outside model space, represents the residual variations in the principal component model space, and is considered to be random error. The second vectors projecting in outside model space are omitted from the analysis because they represent noise and other error terms. The primary principal component vectors u1 through uk provide an orthonormal basis for K-dimensional inside principal component space which describes most of the variation in the original mean center spectral data matrixX . The corresponding score matrix SI = [s1, s2, ..., sn] can be computed by
in which L'I is the transpose of LI.
The vectors s1 through sn are each column vectors having k dimensions and are the principal component scores for the corresponding vectors x1 -x through xn -x of the mean centered spectral data matrix in principal component inside model space. In other words, when one of the vectors xi -x is projected in principal component inside model space the values of its coordinates are represented by the column vector si. The principal component score vector for each mean centered spectrum (xi -x ) can be directly calculated by
The above equation gives a linear transformation in which a spectrum represented by a vector having ℓ dimensions is transformed to a score vector in the principal component inside model space. In this manner, each of the column vectors in this mean centered matrixX is transformed into a vector in principal component inside model space having substantially fewer dimensions than the original vector. - Principal component analysis is a known statistical data compression technique and is described in the text entitled Factor Analysis by Malinowski. By the process described thus far the entire or global set of mean vectors representing the known products are processed by principal component analysis to yield set of score vectors projected into principal component inside model space. Since each score vector represents a known product, they are referred to as known product score vectors. This process represented in the flow chart of
Figure 2 asstep 31 in which the global set of spectra of mean vectors representing known products is transformed into a mean centered matrixX and step 33 in which the mean centered matrix is subjected to principal component analysis to yield the known product score vectors for the matrix determined instep 31. These vectors, which each correspond to a different one of the products in the library of products, are then separated into clusters instep 35. To determine which known product score vectors will be in which cluster, the Euclidean distance between the end point of each known product score vector and each other known product score vector is measured and a minimal spanning tree is constructed linking the vectors. The minimal spanning tree is then used to separate the vectors into clusters by dividing the minimal spanning tree at those links of the minimal spanning tree which have the greatest lengths. More specifically, the average length of the minimal spanning tree link is determined and the standard deviation in the length of the minimal spanning tree links is also determined. The minimal spanning tree is then separated into clusters of vectors by defining a cluster separation at each minimal spanning tree link which is greater in length than the average minimal spanning link plus a scaling factor times the standard deviation in the lengths of the minimal spanning tree links expressed as follows:
wherein a is the average length of a minimal spanning tree link, k is the scaling factor and δ is the standard deviation in the length of the spanning tree link. - This process will thus divide the product score vectors from the entire library of products into a set of clusters.
- Typically, most of the clusters will contain more than the permitted maximum product score vectors and these clusters are further divided into subclusters by repeating the process limited to the products of each cluster. Thus in
step 37, if the permitted maximum number of vectors in an individual cluster is 10, it is determined whether any of the clusters have more than 10 vectors. If so, the process proceeds intostep 39 in which mean centered matrices are determined for the large clusters containing more than 10 vectors, a separate matrix being determined for each large cluster from the corresponding mean vectors representing the corresponding known products. The process then loops back throughstep 33 to perform the principal component analysis on the mean centered matrices determined from the large clusters. This process determines a set of principal components for each large cluster to be subdivided and then determines a principal component inside model space for each large cluster. Following this determination the process proceeds again throughstep 35 to divide vectors of each large cluster into subclusters in the same manner as described above. In this subdivision process, the vectors being subdivided will be closer together than in the first iteration throughstep 35 so the average length of the minimal spanning tree links between product vectors will be smaller and the criteria for separating the vectors into subclusters will therefore be finer. The principal component analysis as described above is thus carried out to further divide the large clusters containing more than permitted maximum number of product vectors into additional clusters called subclusters or child clusters. In a similar manner the child clusters are then further divided into grandchild clusters, and great grandchild clusters, and great, great grandchild clusters, if necessary, until each cluster or subcluster contains no more than ten products. - An example of this clustering technique is illustrated in
Figure 3 . In this figure the library of products is assumed to contain 150 known products and in the example illustrated the first division of these products into clusters divides them into a cluster of two, a cluster of 25, a cluster of 38, a cluster of 33, a cluster of nine, and a cluster of 43 products. In this example, the maximum number of vector permitted top be in cluster not to be further subdivided is selected to be ten. The clusters of 25, 38, 33 and 43 having more than ten products need to be divided into further subclusters because they contain more than ten products and accordingly the cluster containing 25 products is divided into subclusters or child clusters which in this example are represented as containing three, seven, and 15 products, respectively. The subcluster containing 15 products is then further divided into subclusters or grandchild clusters containing five and ten products, respectively. The highest level cluster containing 38 products in the example is shown as being divided into subclusters or child clusters containing 15, 17 and 6 products, respectively. The child cluster containing 15 products is then further divided into clusters containing ten and five products, respectively, at the third level, and the child cluster containing 17 products is further divided into grandchild clusters containing 12 and five products, and the grandchild cluster of 12 products is further divided into great grandchild clusters containing four and eight clusters at the fourth level. The remaining initial clusters containing 33 and 43 are similarly further divided. In the illustration, the cluster division goes to four levels or great grandchild clusters, but theoretically there is no limit to how many levels the clusters may be further subdivided. - When all of the large clusters have been subdivided into subclusters the process proceeds from
step 37 intostep 41. In this step a hypersphere is constructed around each vector in each cluster, including the parent clusters as well as the subclusters. The hypersphere will have the same number of dimensions as the principal component inside model space in which it is constructed and therefore will be k-dimensional The radius of each hypersphere is determined from the Euclidean norm of the standard deviation spectrum of the training set of spectra for the corresponding product multiplied times a scaler factor which may be selected by the user. To calculate the Euclidean norm of the standard deviation spectrum of a training set, the standard deviation is calculated from the training set values at each wavelength measurement point distributed throughout the spectrum and then the Euclidean norm is calculated from these values by taking the square root of the sum of the squares as follows:
in which r is the radius and
- The above described process is illustrated in
Fig. 4 . In this illustration the product mean spectrum
x , which is projected as a product score vector si into principal component inside model space by the operation L'1 (xi -x ). A hypersphere having a radius equal to the Euclidean norm of the standard deviation spectrum of the training set of absorbance spectra for the product multiplied times the scaler factor is constructed around the product score vector si. - Following the generation of the hyperspheres, envelopes are constructed in
step 43 around each cluster of products and each subcluster of products. The envelopes are in the form of multidimensional rectangular boxes called hyper-boxes having the same number of dimensions as the principal component inside model space (k dimensions), and will be constructed so as to encompass each of the vector end points and their surrounding hyperspheres. - The process of identifying an unknown product is illustrated in
Figure 5 . In this process, first a quick search of the library known spectra is conducted using the clusters defined as described above. In the quick search, the absorbance spectrum from the unknown product is obtained and a score vector of the resulting spectrum is projected into the principal component inside model space constructed for the global set of clusters in the first step of dividing the clusters. To carry out this projection, first the global mean vectorx has to be subtracted from the vector representing the unknown product, then the resultant mean corrected vector representing the unknown product is multiplied by the projection operator L'I wherein LI and L'I have been calculated as described above. The projection operator L'I projects the unknown sample spectrum as a score vector in the principal component inside space spanned by the global principal component vectors. After the projection of the unknown sample into the principal component inside space of the global set of mean vectors, the process determines whether or not the resulting projected product vector representing the unknown product falls within any of the hyper-box envelopes surrounding the clusters. If the vector representing the unknown product falls within the envelope of a cluster, that is one that is not further subdivided, the identification process then proceeds with the exhaustive search comparing the unknown product with each of the products in the cluster, as will be described below. - If the unknown product vector falls in a cluster which is further divided into subclusters, then the above-described process must be repeated for the subclusters to determined which of the subclusters a vector representing the unknown product falls into. As explained above, the principal component inside model space for dividing each cluster into subclusters is different than the global principal component inside model space determined for the global set of mean vectors and also different from that determined for other subclusters. Accordingly, the process of calculating the projection of the unknown product into principal component inside model space must be carried out separately for each subcluster. Thus, in carrying out the projection for given subcluster, the mean vector of the mean centered matrix for the parent cluster will be subtracted from the unknown product vector to determine the mean corrected vector representing the unknown product. Then this mean corrected spectrum vector is multiplied by the projection operator L'I for the relevant principal component inside model space to project the mean corrected unknown product vector into this principal component inside model space. The relevant principal component inside model space will be that hyperspace used to divide the parent cluster into subclusters. This process is repeated until the vector representing the product is found to fall in a subcluster which is not further divided or otherwise found to fall outside of any subcluster.
- When the cluster identification step of the process has been completed and the unknown product is found to fall into an identified cluster or subcluster which is not further divided, an exhaustive search is conducted on the library spectra of those known products of that identified cluster or subcluster to determine which product the unknown product corresponds with. This determination may be carried out by several different methods, one of which is the method described in the above-mentioned patent to Begley wherein the angle between the multidimensional vector represented by the product spectra is compared with the angles of the mean vectors representing the products in the same cluster and if the cosine of the angle between the vectors is less then a certain selected minimum, the product is deemed to be the same product.
- A second method is to compare the spectrum of the unknown product point by point with a spectrum band determined from each training set of spectra representing one of the products in the cluster. The spectrum band is determined by calculating the standard deviation of the training set at each wavelength measurement to determine an upper and lower limit for the band at each wavelength. The upper and lower limit is

Figure 4 . The product is determined to be the same as a specific product in the cluster if every point in its absorbance spectrum falls within the band determined from the training set spectra extending over the near infrared of measurement. - In accordance with a third method of performing an exhaustive search of the library spectra of the products corresponding to the cluster identified in the quick search, principal component analysis is applied to each training set of spectra for each product corresponding to the identified cluster. This determination yields a model of principal component inside space for the training set of each product of the cluster. To match the unknown sample with a known product, the score vector from the unknown sample in the local principal component inside model space is determined and the Mahalanobis distance of the score vector and the mean of the score vectors of the training set is calculated. If the Mahalanobis distance of the score vector of the unknown sample is less than the threshold value selected by the user, the unknown sample is determined to match the known sample of the local principal component inside model space. The Mahalanobis distance between the score vector and the mean of the training set score vectors of a known product can be determined from the sum of the squares of the coordinates of the unknown product of the score vector weighted by the associated eigenvalues as follows:

in which
- Each of the above-described methods of product identification is satisfactory with the first described method of the Begley patent taking the shortest amount of time, the second method taking more time and the third method taking still more time to complete the matching of the unknown product with the known product. Accordingly, in accordance with the preferred embodiment the three methods are carried out in sequence with the method of the Begley patent being used to rule out a first group of the products of the cluster, leaving a remaining smaller group to be considered and then the second method being used to rule out a subgroup of this second smaller group, leaving a third still smaller group to be considered, and then using the Mahalanobis distance method to perform the final matching of the unknown product with a known product in the product library.
- As described above, the process employs principal component analysis to reduce the dimensions of the vectors representing both the known products and the unknown products for comparison of the vectors with the clusters of hyperspheres. It will be apparent that the process could be performed without using principal component analysis and simply comparing the mean product vectors representing each product training set by a vector extending in hyperspace having dimensions equal to the number of spectral measurements throughout the infrared range and clustering the products and comparing the unknown products with the cluster of products in the same manner essentially as described above. In addition, other methods instead of principal component analysis may be used to compress the dimensions of the vectors representing each product.
- Because the above-described clustering technique is used and also because it is used in combination with the principal component analysis to reduce the number of dimensions of the vectors, the time required to match a product with an unknown product in the library is reduced to a small fraction of the time required by the prior art methods. Accordingly, the system may be used on a loading dock to quickly determine the contents of a received product before a newly delivered product is accepted.
- The above description is of a preferred embodiment of the invention and modification may be made thereto.
Claims (5)
- A method of identifying an unknown product by matching the unknown product with one of a number of known products in a library of known products comprising the following steps:- a known-product measuring step comprising measuring a set of near-infrared absorbance spectra for a plurality of known products;- a known-product vector generation step comprising generating from said measured absorbance spectra a known-product vector for each of said known products wherein said known-product vector extends into a hyperspace;- a cluster-division step comprising dividing said known-product vectors into clusters of vectors extending into hyperspace wherein the vectors within each cluster are closer to each other in said hyperspace than to the vectors outside of said cluster- a subcluster-division step comprising dividing at least some of said clusters of vectors into subclusters of vectors extending into hyperspace;- a further subcluster-division step comprising repeating said subcluster-division step on at least some of said subclusters until all of said subclusters have fewer than a predetermined number of vectors, thus forming smaller subclusters;- a cluster-envelope construction step comprising surrounding each of said clusters and subclusters with a cluster envelope defined in the hyperspace;- an unknown-product measuring step comprising measuring a set of near-infrared absorption spectra for an unknown product;- a first cluster identification step comprising determining into which cluster envelope an unknown-product vector, representing said unknown product, falls;- a second cluster identification step comprising determining into which subcluster envelope said unknown-product vector falls if said unknown product vector falls into a cluster envelope which is divided into subclusters;- a third cluster identification step comprising repeating said second cluster identification step on further divided subclusters until said unknown-product vector is determined to fall into the envelope of a subcluster which is not further divided; and- an unknown product determination step comprising determining which known-product vector within said determined envelope matches said unknown-product vector.
- A method as claimed in Claim 1 wherein said known-product vector generation step further comprises subjecting said absorbance spectra of said known products to principal component analysis in order to determine said known-product score vector for each known project wherein said known-project score vector extends into a principal-component-inside-model space.
- A method as claimed in Claim 2 wherein said subcluster-division step further comprises subjecting the absorbance spectra of the known product vectors of each cluster and subcluster to principal component analysis in order to determine for each cluster or subcluster a known-product score vector for each known product wherein said known-product score vector extends into a principal-component-inside-model space.
- A method as claimed in Claim 1 or 2 wherein said cluster-envelope construction step further comprises surrounding each known-product score vector with a hypersphere before surrounding each of said clusters and subclusters with a cluster envelope.
- A method as claimed in Claim 1 or 2 wherein said envelopes are in the form of hyperboxes of orthogonal dimensions.
Priority Applications (1)
| Application Number | Priority Date | Filing Date | Title |
|---|---|---|---|
| EP08021869A EP2040058A3 (en) | 1996-05-13 | 1997-05-07 | System for identifying materials by NIR spectrometry |
Applications Claiming Priority (2)
| Application Number | Priority Date | Filing Date | Title |
|---|---|---|---|
| US645104 | 1996-05-13 | ||
| US08/645,104 US5822219A (en) | 1996-05-13 | 1996-05-13 | System for identifying materials by NIR spectrometry |
Related Child Applications (1)
| Application Number | Title | Priority Date | Filing Date |
|---|---|---|---|
| EP08021869A Division EP2040058A3 (en) | 1996-05-13 | 1997-05-07 | System for identifying materials by NIR spectrometry |
Publications (3)
| Publication Number | Publication Date |
|---|---|
| EP0807809A2 EP0807809A2 (en) | 1997-11-19 |
| EP0807809A3 EP0807809A3 (en) | 1998-07-01 |
| EP0807809B1 true EP0807809B1 (en) | 2009-02-11 |
Family
ID=24587650
Family Applications (2)
| Application Number | Title | Priority Date | Filing Date |
|---|---|---|---|
| EP08021869A Withdrawn EP2040058A3 (en) | 1996-05-13 | 1997-05-07 | System for identifying materials by NIR spectrometry |
| EP97107518A Expired - Lifetime EP0807809B1 (en) | 1996-05-13 | 1997-05-07 | System for indentifying materials by NIR spectrometry |
Family Applications Before (1)
| Application Number | Title | Priority Date | Filing Date |
|---|---|---|---|
| EP08021869A Withdrawn EP2040058A3 (en) | 1996-05-13 | 1997-05-07 | System for identifying materials by NIR spectrometry |
Country Status (5)
| Country | Link |
|---|---|
| US (1) | US5822219A (en) |
| EP (2) | EP2040058A3 (en) |
| JP (2) | JP3904284B2 (en) |
| CA (1) | CA2203308A1 (en) |
| DE (1) | DE69739245D1 (en) |
Cited By (2)
| Publication number | Priority date | Publication date | Assignee | Title |
|---|---|---|---|---|
| CN103575689A (en) * | 2013-10-11 | 2014-02-12 | 西北农林科技大学 | Method for rapidly detecting amylose content in rice by near infrared spectrum and visible light analyzer |
| CN103837492A (en) * | 2014-02-24 | 2014-06-04 | 西北农林科技大学 | Nondestructive detection method for swelled kiwi fruits based on near-infrared spectrum technology |
Families Citing this family (54)
| Publication number | Priority date | Publication date | Assignee | Title |
|---|---|---|---|---|
| US5952660A (en) * | 1995-07-06 | 1999-09-14 | Dsm N.V. & Institut Fur Chemo | Method of identifying post consumer or post industrial waste carpet utilizing a hand-held infrared spectrometer |
| CA2201410A1 (en) * | 1996-04-16 | 1997-10-16 | Bogdan Kurtyka | System for matching absorbance spectra employing a library stabilization algorithm |
| DE19810917A1 (en) * | 1998-03-13 | 1999-09-16 | Buehler Ag | Calibration method used in evaluation of measured spectra |
| US6207956B1 (en) * | 1998-09-04 | 2001-03-27 | The Toro Company | Method and apparatus for quantitative determination of turfgrass color |
| US6587702B1 (en) * | 1999-01-22 | 2003-07-01 | Instrumentation Metrics, Inc | Classification and characterization of tissue through features related to adipose tissue |
| US6268226B1 (en) * | 1999-06-30 | 2001-07-31 | International Business Machines Corporation | Reactive ion etch loading measurement technique |
| US20060015265A1 (en) * | 1999-11-18 | 2006-01-19 | Raich Anne C | Method of rapidly identifying X-ray powder diffraction patterns |
| US6560546B1 (en) * | 2000-08-07 | 2003-05-06 | Infrasoft Llc | Remote analysis system |
| US6549861B1 (en) | 2000-08-10 | 2003-04-15 | Euro-Celtique, S.A. | Automated system and method for spectroscopic analysis |
| WO2002016905A2 (en) | 2000-08-21 | 2002-02-28 | Euro-Celtique, S.A. | Near infrared blood glucose monitoring system |
| US6534768B1 (en) * | 2000-10-30 | 2003-03-18 | Euro-Oeltique, S.A. | Hemispherical detector |
| CA2331116A1 (en) * | 2001-01-15 | 2002-07-15 | Chenomx, Inc. | Compound identification and quantitation in liquid mixtures -- method and process using an automated nuclear magnetic resonance measurement system |
| US6771369B2 (en) * | 2002-03-12 | 2004-08-03 | Analytical Spectral Devices, Inc. | System and method for pharmacy validation and inspection |
| FR2846095B1 (en) * | 2002-10-18 | 2005-04-08 | Proengin | METHOD AND DEVICE FOR DETECTION OF ATMOSPHERE PRESENCE AND REAL - TIME ANALYSIS OF CHEMICAL AND / OR BIOLOGICAL SUBSTANCES. |
| US7408636B2 (en) * | 2002-10-31 | 2008-08-05 | Chemimage Corporation | Method and apparatus for dark field chemical imaging |
| WO2004079347A1 (en) * | 2003-03-07 | 2004-09-16 | Pfizer Products Inc. | Method of analysis of nir data |
| US20050032235A1 (en) * | 2003-06-18 | 2005-02-10 | Srinivas Tummala | Method of monitoring the blending of a mixture |
| US7548310B2 (en) * | 2003-07-18 | 2009-06-16 | Chemimage Corporation | Method and apparatus for compact spectrometer for multipoint sampling of an object |
| US7542138B2 (en) * | 2003-07-18 | 2009-06-02 | Chemimage Corporation | Sample container and system for a handheld spectrometer and method for using therefor |
| US7738095B2 (en) * | 2003-07-18 | 2010-06-15 | Chemimage Corporation | Method and apparatus for compact spectrometer for detecting hazardous agents |
| US7440096B2 (en) * | 2003-07-18 | 2008-10-21 | Chemimage Corporation | Method and apparatus for compact spectrometer for fiber array spectral translator |
| US8269174B2 (en) * | 2003-07-18 | 2012-09-18 | Chemimage Corporation | Method and apparatus for compact spectrometer for multipoint sampling of an object |
| US7012695B2 (en) * | 2003-07-18 | 2006-03-14 | Chemimage Corporation | Method and apparatus for multiwavelength imaging spectrometer |
| US7286222B2 (en) * | 2003-07-18 | 2007-10-23 | Chemimage Corporation | Sample container and system for a handheld spectrometer and method for using therefor |
| WO2005038443A1 (en) * | 2003-10-17 | 2005-04-28 | Astellas Pharma, Inc. | Different-kind-of-object detector employing plane spectrometer |
| US20050097021A1 (en) * | 2003-11-03 | 2005-05-05 | Martin Behr | Object analysis apparatus |
| US7072770B1 (en) | 2004-03-29 | 2006-07-04 | Chemimage Corporation | Method for identifying components of a mixture via spectral analysis |
| US20060023217A1 (en) * | 2004-05-28 | 2006-02-02 | Chemimage Corporation | Method and apparatus for producing a mosaic image |
| US7239383B2 (en) * | 2004-06-30 | 2007-07-03 | Chemimage Corporation | Method and apparatus for spectral modulation compensation |
| US7394542B2 (en) | 2004-08-18 | 2008-07-01 | Chemimage Corporation | Method and apparatus for chemical imaging in a microfluidic circuit |
| US7286231B2 (en) * | 2004-06-30 | 2007-10-23 | Chemimage Corp. | Method and apparatus for peak compensation in an optical filter |
| US20060170916A1 (en) * | 2005-01-31 | 2006-08-03 | Voigt Thomas C | Method and apparatus for variable-field illumination |
| US8180579B2 (en) * | 2005-03-25 | 2012-05-15 | Lawrence Livermore National Security, Llc | Real time gamma-ray signature identifier |
| EP1869444A1 (en) * | 2005-04-15 | 2007-12-26 | Chemimage Corporation | Method and apparatus for spectral mixture resolution |
| US7330747B2 (en) * | 2005-06-07 | 2008-02-12 | Chemimage Corporation | Invasive chemometry |
| US7330746B2 (en) * | 2005-06-07 | 2008-02-12 | Chem Image Corporation | Non-invasive biochemical analysis |
| US8190551B2 (en) * | 2005-10-13 | 2012-05-29 | Baylor University | Classification of fabrics by near-infrared spectroscopy |
| JP4769705B2 (en) * | 2006-12-18 | 2011-09-07 | トヨタ自動車株式会社 | Exhaust gas temperature analysis device, exhaust gas temperature analysis method, and temperature analysis program |
| DE102007027569B3 (en) * | 2007-06-15 | 2009-01-02 | Bionorica Ag | A method for qualitatively classifying surfactant-containing compositions |
| US7626696B2 (en) * | 2007-08-07 | 2009-12-01 | Chemimage Corporation | Method and apparatus for reconfigurable field of view in a FAST-based imaging system |
| NO329603B1 (en) * | 2007-11-22 | 2010-11-22 | Integrated Optoelectronics As | Method and system for painting and determining / recognizing different materials |
| JP5206335B2 (en) * | 2008-11-07 | 2013-06-12 | アステラス製薬株式会社 | Principal component analysis method, principal component analysis apparatus, heterogeneous product detection apparatus, principal component analysis program, and recording medium on which principal component analysis program is recorded |
| DE102010006450B4 (en) * | 2010-02-01 | 2019-03-28 | Bruker Daltonik Gmbh | Stepped search for microbial spectra in reference libraries |
| CN102841063B (en) * | 2012-08-30 | 2014-09-03 | 浙江工业大学 | Method for tracing and identifying charcoal based on spectrum technology |
| CN103353443A (en) * | 2013-06-18 | 2013-10-16 | 西北农林科技大学 | Near infrared spectrum based discrimination method for Zhongning fructus lycii |
| DE102014203721B4 (en) * | 2014-02-28 | 2018-12-27 | Bruker Biospin Gmbh | Method for determining the concentration of a substance in a sample |
| CN105334183A (en) * | 2014-08-07 | 2016-02-17 | 重庆医科大学 | Method for identifying certifiable Herba Ephedrae based on near infrared spectroscopy |
| DE102015105039A1 (en) | 2015-04-01 | 2016-10-06 | Fritz Egger Gmbh & Co. Og | Impregnating plant and method for its monitoring |
| CN107449751A (en) * | 2017-09-16 | 2017-12-08 | 朱纪佳 | A kind of projection photosynthetic pigments absorption spectrum scope |
| JP7031450B2 (en) * | 2018-04-02 | 2022-03-08 | 日本製鉄株式会社 | Particle source analysis system, particle source analysis method, and program |
| US20210020276A1 (en) * | 2018-04-05 | 2021-01-21 | Inesc Tec - Instttuto De Engenharia De Sistemas, Tecnologia E Ciencia | Spectrophotometry method and device for predicting a quantification of a constituent from a sample |
| PL3948876T3 (en) | 2019-06-24 | 2023-01-02 | Evonik Operations Gmbh | Method for predicting a feedstuff and/or feedstuff raw material |
| CN113406037B (en) * | 2021-06-17 | 2023-07-25 | 中国科学院合肥物质科学研究院 | Infrared spectrum online rapid identification analysis method based on sequence forward selection |
| CN113626578B (en) * | 2021-10-12 | 2021-12-21 | 南通腾宇环保设备有限公司 | Intelligent analysis method and system for sealing material |
Family Cites Families (20)
| Publication number | Priority date | Publication date | Assignee | Title |
|---|---|---|---|---|
| US4660151A (en) * | 1983-09-19 | 1987-04-21 | Beckman Instruments, Inc. | Multicomponent quantitative analytical method and apparatus |
| US4661913A (en) * | 1984-09-11 | 1987-04-28 | Becton, Dickinson And Company | Apparatus and method for the detection and classification of articles using flow cytometry techniques |
| US4766551A (en) * | 1986-09-22 | 1988-08-23 | Pacific Scientific Company | Method of comparing spectra to identify similar materials |
| US5124932A (en) * | 1988-03-10 | 1992-06-23 | Indiana University Foundation | Method for analyzing asymmetric clusters in spectral analysis |
| US5121338A (en) * | 1988-03-10 | 1992-06-09 | Indiana University Foundation | Method for detecting subpopulations in spectral analysis |
| US4885697A (en) * | 1988-09-01 | 1989-12-05 | E. I. Du Pont De Nemours And Company | Method of identifying spectra |
| US4969739A (en) | 1989-01-09 | 1990-11-13 | Nirsystems Incorporated | Spectrometer with direct drive high speed oscillating grating |
| US5046846A (en) * | 1989-03-22 | 1991-09-10 | The Lubrizol Corporation | Method and apparatus for spectroscopic comparison of compositions |
| US5311445A (en) * | 1989-04-19 | 1994-05-10 | Board Of Regents Of The University Of Oklahoma | Deconvoluted band representation for infrared spectrum compression |
| US5205701A (en) * | 1990-06-04 | 1993-04-27 | Canon Kabushiki Kaisha | Industrial robot |
| MY107458A (en) * | 1990-10-12 | 1995-12-30 | Exxon Res & Engineering Company | Special data measurement and correction |
| US5121337A (en) * | 1990-10-15 | 1992-06-09 | Exxon Research And Engineering Company | Method for correcting spectral data for data due to the spectral measurement process itself and estimating unknown property and/or composition data of a sample using such method |
| US5223715A (en) * | 1991-09-20 | 1993-06-29 | Amoco Corporation | Process for spectrophotometric analysis |
| EP0535700B1 (en) * | 1991-10-04 | 1997-03-26 | The Perkin-Elmer Corporation | Method and apparatus for comparing spectra |
| US5397899A (en) * | 1992-07-21 | 1995-03-14 | Western Atlas International, Inc. | Method for improving infrared analysis estimations by automatically compensating for instrument instabilities |
| US5448070A (en) * | 1993-05-17 | 1995-09-05 | The Foxboro Company | Identification of unknown gases using infrared absorption spectroscopy |
| US5477322A (en) * | 1994-10-13 | 1995-12-19 | Nirsystems Incorporated | Spectrophotometer with light source in the form of a light emitting diode array |
| EP0846253A4 (en) * | 1995-08-07 | 2009-11-11 | Roche Diagnostics Operations | Biological fluid analysis using distance outlier detection |
| US5606164A (en) * | 1996-01-16 | 1997-02-25 | Boehringer Mannheim Corporation | Method and apparatus for biological fluid analyte concentration measurement using generalized distance outlier detection |
| CA2201410A1 (en) * | 1996-04-16 | 1997-10-16 | Bogdan Kurtyka | System for matching absorbance spectra employing a library stabilization algorithm |
-
1996
- 1996-05-13 US US08/645,104 patent/US5822219A/en not_active Expired - Lifetime
-
1997
- 1997-04-22 CA CA002203308A patent/CA2203308A1/en not_active Abandoned
- 1997-05-07 EP EP08021869A patent/EP2040058A3/en not_active Withdrawn
- 1997-05-07 DE DE69739245T patent/DE69739245D1/en not_active Expired - Lifetime
- 1997-05-07 EP EP97107518A patent/EP0807809B1/en not_active Expired - Lifetime
- 1997-05-13 JP JP12215497A patent/JP3904284B2/en not_active Expired - Fee Related
-
2006
- 2006-12-01 JP JP2006325737A patent/JP4477620B2/en not_active Expired - Lifetime
Cited By (4)
| Publication number | Priority date | Publication date | Assignee | Title |
|---|---|---|---|---|
| CN103575689A (en) * | 2013-10-11 | 2014-02-12 | 西北农林科技大学 | Method for rapidly detecting amylose content in rice by near infrared spectrum and visible light analyzer |
| CN103575689B (en) * | 2013-10-11 | 2015-07-15 | 西北农林科技大学 | Method for rapidly detecting amylose content in rice by near infrared spectrum and visible light analyzer |
| CN103837492A (en) * | 2014-02-24 | 2014-06-04 | 西北农林科技大学 | Nondestructive detection method for swelled kiwi fruits based on near-infrared spectrum technology |
| CN103837492B (en) * | 2014-02-24 | 2015-11-25 | 西北农林科技大学 | A kind of Kiwi berry based on near-infrared spectrum technique expand fruit lossless detection method |
Also Published As
| Publication number | Publication date |
|---|---|
| DE69739245D1 (en) | 2009-03-26 |
| CA2203308A1 (en) | 1997-11-13 |
| JPH1048128A (en) | 1998-02-20 |
| EP0807809A3 (en) | 1998-07-01 |
| JP3904284B2 (en) | 2007-04-11 |
| US5822219A (en) | 1998-10-13 |
| EP2040058A3 (en) | 2009-04-15 |
| EP2040058A2 (en) | 2009-03-25 |
| JP4477620B2 (en) | 2010-06-09 |
| EP0807809A2 (en) | 1997-11-19 |
| JP2007093617A (en) | 2007-04-12 |
Similar Documents
| Publication | Publication Date | Title |
|---|---|---|
| EP0807809B1 (en) | System for indentifying materials by NIR spectrometry | |
| US4766551A (en) | Method of comparing spectra to identify similar materials | |
| US5121337A (en) | Method for correcting spectral data for data due to the spectral measurement process itself and estimating unknown property and/or composition data of a sample using such method | |
| Hopke | The evolution of chemometrics | |
| US5446681A (en) | Method of estimating property and/or composition data of a test sample | |
| US5606164A (en) | Method and apparatus for biological fluid analyte concentration measurement using generalized distance outlier detection | |
| Brown | Chemical systems under indirect observation: Latent properties and chemometrics | |
| EP0954744B1 (en) | Calibration method for spectrographic analyzing instruments | |
| US20050010374A1 (en) | Method of analysis of NIR data | |
| JPH0582545B2 (en) | ||
| JPH06502492A (en) | Measurement and correction of spectral data | |
| US8112248B2 (en) | Forensic integrated search technology with instrument weight factor determination | |
| Downey | Tutorial review. Qualitative analysis in the near-infrared region | |
| CN101473197B (en) | Manufacture the method for multidimensional calibrating patterns | |
| US20080281581A1 (en) | Method of identifying documents with similar properties utilizing principal component analysis | |
| CN109409350B (en) | PCA modeling feedback type load weighting-based wavelength selection method | |
| AU711324B2 (en) | Biological fluid analysis using distance outlier detection | |
| Westerhaus et al. | Quantitative analysis | |
| EP0437249B1 (en) | Spectrometric method free from variations of error | |
| del Águila et al. | A review of dimensionality reduction techniques for processing hyper-spectral optical signal | |
| Miller | Chemometrics in process analytical chemistry | |
| Sørensen et al. | Nir data exploration and regression by chemometrics—a primer | |
| Bykov et al. | An expert system for identification of lines in vibrational-rotational spectra | |
| EP0802406A2 (en) | System for matching absorbance spectra employing a library stabilization algorithm | |
| WO2005045391A2 (en) | System and process for detecting substances |
Legal Events
| Date | Code | Title | Description |
|---|---|---|---|
| PUAI | Public reference made under article 153(3) epc to a published international application that has entered the european phase |
Free format text: ORIGINAL CODE: 0009012 |
|
| AK | Designated contracting states |
Kind code of ref document: A2 Designated state(s): DE FR GB |
|
| RIN1 | Information on inventor provided before grant (corrected) |
Inventor name: MONFRE, STEPHEN L. Inventor name: CHEN, XIAOLIN |
|
| PUAL | Search report despatched |
Free format text: ORIGINAL CODE: 0009013 |
|
| AK | Designated contracting states |
Kind code of ref document: A3 Designated state(s): DE FR GB |
|
| 17P | Request for examination filed |
Effective date: 19980914 |
|
| 17Q | First examination report despatched |
Effective date: 20061005 |
|
| GRAP | Despatch of communication of intention to grant a patent |
Free format text: ORIGINAL CODE: EPIDOSNIGR1 |
|
| RIC1 | Information provided on ipc code assigned before grant |
Ipc: G06K 9/62 20060101ALI20080703BHEP Ipc: G01N 21/35 20060101AFI20080703BHEP |
|
| GRAS | Grant fee paid |
Free format text: ORIGINAL CODE: EPIDOSNIGR3 |
|
| RAP1 | Party data changed (applicant data changed or rights of an application transferred) |
Owner name: FOSS NIRSYSTEMS, INC. |
|
| GRAA | (expected) grant |
Free format text: ORIGINAL CODE: 0009210 |
|
| RAP1 | Party data changed (applicant data changed or rights of an application transferred) |
Owner name: FOSS NIRSYSTEMS, INC. |
|
| AK | Designated contracting states |
Kind code of ref document: B1 Designated state(s): DE FR GB |
|
| REG | Reference to a national code |
Ref country code: GB Ref legal event code: FG4D |
|
| REF | Corresponds to: |
Ref document number: 69739245 Country of ref document: DE Date of ref document: 20090326 Kind code of ref document: P |
|
| PLBE | No opposition filed within time limit |
Free format text: ORIGINAL CODE: 0009261 |
|
| STAA | Information on the status of an ep patent application or granted ep patent |
Free format text: STATUS: NO OPPOSITION FILED WITHIN TIME LIMIT |
|
| 26N | No opposition filed |
Effective date: 20091112 |
|
| PGFP | Annual fee paid to national office [announced via postgrant information from national office to epo] |
Ref country code: FR Payment date: 20100601 Year of fee payment: 14 |
|
| PGFP | Annual fee paid to national office [announced via postgrant information from national office to epo] |
Ref country code: DE Payment date: 20100527 Year of fee payment: 14 |
|
| PGFP | Annual fee paid to national office [announced via postgrant information from national office to epo] |
Ref country code: GB Payment date: 20100525 Year of fee payment: 14 |
|
| REG | Reference to a national code |
Ref country code: DE Ref legal event code: R119 Ref document number: 69739245 Country of ref document: DE |
|
| REG | Reference to a national code |
Ref country code: DE Ref legal event code: R119 Ref document number: 69739245 Country of ref document: DE |
|
| GBPC | Gb: european patent ceased through non-payment of renewal fee |
Effective date: 20110507 |
|
| REG | Reference to a national code |
Ref country code: FR Ref legal event code: ST Effective date: 20120131 |
|
| PG25 | Lapsed in a contracting state [announced via postgrant information from national office to epo] |
Ref country code: FR Free format text: LAPSE BECAUSE OF NON-PAYMENT OF DUE FEES Effective date: 20110531 |
|
| PG25 | Lapsed in a contracting state [announced via postgrant information from national office to epo] |
Ref country code: GB Free format text: LAPSE BECAUSE OF NON-PAYMENT OF DUE FEES Effective date: 20110507 |
|
| PG25 | Lapsed in a contracting state [announced via postgrant information from national office to epo] |
Ref country code: DE Free format text: LAPSE BECAUSE OF NON-PAYMENT OF DUE FEES Effective date: 20111130 |