EP0189848A2 - Method and apparatus for software debugging - Google Patents
Method and apparatus for software debugging Download PDFInfo
- Publication number
- EP0189848A2 EP0189848A2 EP86100895A EP86100895A EP0189848A2 EP 0189848 A2 EP0189848 A2 EP 0189848A2 EP 86100895 A EP86100895 A EP 86100895A EP 86100895 A EP86100895 A EP 86100895A EP 0189848 A2 EP0189848 A2 EP 0189848A2
- Authority
- EP
- European Patent Office
- Prior art keywords
- signals
- dynamic
- address
- target system
- data
- Prior art date
- Legal status (The legal status is an assumption and is not a legal conclusion. Google has not performed a legal analysis and makes no representation as to the accuracy of the status listed.)
- Granted
Links
Images


Classifications
-
- G—PHYSICS
- G06—COMPUTING; CALCULATING OR COUNTING
- G06F—ELECTRIC DIGITAL DATA PROCESSING
- G06F11/00—Error detection; Error correction; Monitoring
- G06F11/36—Preventing errors by testing or debugging software
- G06F11/362—Software debugging
- G06F11/3636—Software debugging by tracing the execution of the program
- G06F11/364—Software debugging by tracing the execution of the program tracing values on a bus
Definitions
- the instant invention is an additional measurement tool that aids designers in nearly every phase of the software development cycle. It can be used for software characterization, testing, debugging, and optimization, and can characterize software nonintrusively as that software executes in real time.
- the software debugging' analyzer also disclosed herein performs real-time nonintrusive measurements. It greatly reduces the mismatch between the analyses and debugging capabilities of the measurement system and the level at which the program to be analyzed was conceptualized and implemented.
- the debugging analyzer includes basic performance measurement capabilities, providing for testing of module/program timing and code execution specifications. These performance measurement capabilities are fundamental to aid the user's verification and validation activities for improved software reliability, as well as in the basic debug process. Timing measurements provide important improvements in the debug effort, opening up a third dimension to the user to provide a more comprehensive picture of the system being analyzed. Also, the performance metrics of the analyzer allow the user to accomplish performance analysis and code optimization activities. (E.g., not meeting a timing, occurrence, or space specification is a but).
- the software code and data measurement capabilities provide significant improvements to programmer productivity over present debug and analysis packages. All these measurements can be accessed via a highly leveraged automatic test management capability. And of extreme importance to improved accuracy and reduced uncertainty of these measurements, is the non-intrusive and real-time implementation of this instrumentation. These resources are presented to the user in an easy-to-use implementation, which is in alignment with the way software solutions are conceptualized, designed, implemented and maintained.
- Figure 1 is a block diagram of a "microprocessor development system” that includes a keyboard 1 with a row of re-definable "soft keys" adjacent a CRT display 3.
- the apparatus also includes a host processor 2, memory 4 and a mass storage facility 5 (e.g., a hard disc drive) and is capable of receiving an extensive collection of options.
- Each option has one or more printed circuit boards that are interconnected with the host components via BPC bus 18.
- each option also has some associated software which augments to an operating and measurement system already resident in the host system.
- emulators Among the options that may be installed in the microprocessor development system are emulators, cross compilers; logic state analyzers, timing analyzers, and the subject of the instant disclosure, a software debugging analyzer.
- the options are interconnected via intermodule bus 6. It will, of course, be understood by those skilled in the art that the invention need not be produced as an option to some other apparatus, but may equally well be implemented as a complete stand-alone measurement device, if desired. Nevertheless, since the invention was first produced as such an option, it will, as a matter of convenience, be described in that form.
- the software debugging analyzer consists of three p.c. boards and some accompanying software that are installed in the microprocessor development system.
- the apparatus is a Hewlett-Packard model 64000 an emulator option must also be installed. In that case the connections for the plug-in p.c. boards are arranged so that the necessary signals from the target system under test are automatically coupled to the software debugging analyzer as the target software is executed with the emulator.
- various re-definable definitions appear at the bottom of the CRT display. These definitions are associated with the row of re-definable soft keys. With the aid of these keys the user instructs the apparatus and its various options (including the software debugging analyzer in particular) concerning the measurements that are desired. This is accomplished via an interactive process involving "directed syntax," wherein the operating and measurement system dynamically varies the definitions of the soft keys as the user proceeds through the syntax of each command. In this way the user is continually presented with only valid choices, and is automatically instructed and guided in his selection of parameters for the various commands. In response to his commands the operating and measurement system writes various control values into registers in the option p.c. boards and elsewhere. That configures those elements of hardware to operate in the modes selected and to perform the desired measurements.
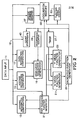
- Figure 2 illustrates the information flow in the analyzer.
- Signals from the target system under test enter the software debugging analyzer via data input 11 to emulation bus 12.
- the input signals include address, data and status information from the target system.
- the address and status signals which comprise 32 bits, are sent to dynamic recognition comparators 13 and address recognition comparators 15 and fast sequence generator 31.
- the data signals which comprise 16 bits, are sent to data recognition comparators 17.
- the address, status and data signals also go to the acquisition memory 35 for selective storage as described below.
- the address recognition comparators 15 are programmable to recognize target system signals which represent an event of interest in carrying out the chosen debugging analysis routine, i.e., whether a particular address or status is the same as or within a range of those chosen by the user.
- the data recognition comparators 17 are programmable to recognize the target system data signals which are equal to or within a range of those chosen by the user.
- the outputs from the address and data recognition comparators go to high level resource generator 19.
- the high level resource generator is programmable to determine the occurrence of a number of more complex events, i.e., combinations of multiple events recognized by the address and data recognition comparators.
- the address and data recognition comparators and the high level resource generator thus provide two levels of event recognition logic.
- the flexibility of the event recognition circuits is thereby increased because low-level events and complex combinations of elementary events can be programmed separately. This also allows the low-level events recognition to be programmed more simply, because an event may be defined as a single address, status or data stream rather than a combination of them.
- a further advantage is that the output of high level resource generator 19 has a relatively high density of information, thus the next level of recognition logic can be used to perform more complex analyses.
- the outputs of high level resource generator 19 go to two sequencers, X measurement function generator 21 and Y measurement function generator 23. These function generators are programmable to determine the occurrence of a sequence of the events represented by the outputs of high level resource generator 19. Additional inputs to function generators 21 and 23 come from timer 27 and fast sequence function generator 31, whose operation is described below. These additional inputs can also be employed in defining a sequence of events to be recognized.
- the outputs of function generators 21 and 23 are sent to dedicated function generator 25, to produce any of a number of operating functions. Included are: start, timer count, timer load, occur, count, store, stop and search.
- the start function initiates a measurement episode and enables the other functions.
- the occur function is used to provide input to occurrence counter 29 which counts selected events for high level resource generator 19.
- the count function is used for input to floating point counter 33 whose output can be stored in acquisition memory 35 and as input to line counter 45 for counting line execution.
- the store function stores in acquisition memory 35 the address, data and status information currently on emulation bus 12, as well as the current value in floating point counter 33 and the current value in opcode address register 37.
- the stop function terminates a measurement episode.
- the search function is used for driving signals to external apparatus in the host system such as the other analyzers.
- low-level event recognition is done by address and data recognition comparators 15 and 17;
- high-level event recognition -- complex event definitions -- is done by high level resource generator 19, and sequences of complex events are examined by function generators 21 and 23 to decide when a function is to be carried out by dedicated function generator 25 .
- Timer 27 and occurrence counter 29 are controlled by dedicated function generator 25 and provide feedback input to high level resource generator 19 and measurement function generators 21 and 23.
- variables- are assigned a memory location, or address, and any activity with respect to a variable can be tracked by watching that address.
- a variable may be assigned only a relative location, for example, a location relative to the top of a stack of local variables. In order to trace any activity with respect to such dynamically activated variables, the analyzer must keep track of where the top of the stack is and where the variable is located in the stack.
- the dynamic recognition comparators 13 are programmable in real-time to recognize target system signals which represent the activation of variables and the stack location assigned to them.
- Fast sequence function generator 31 is programmable to interpret the output signals from the dynamic recognition comparators 13 and reprogram at least one of the dynamic comparators with the address range assigned to the dynamically activated variable.
- the outputs of fast sequence function generator 31 go to X and Y measurement function generators 21 and 23 and to dedicated function generator 25.
- the count statements circuit 40 counts the occurrences of a high level language instruction, based on signals received from the dedicated function generator 25 and from emulation bus 12.
- the software debugging analyzer is contained on three interconnected p.c. boards which are inserted into the host microprocessor development system.
- Figures 3A; 3B and 3C illustrate schematically the layout of circuitry on the three p.c. boards.
- the first p.c. board contains emulation bus interface 41 address recognition comparators 15, data recognition comparators 17, high level resource generator 19, count mapper 43 and line counter 45, clock 47 and power supply 49.
- Emulation bus interface 41 provides an input port through which signals from the emulator enter the software debugging analyzer. The signals from the emulator are distributed to the appropriate circuits throughout the analyzer via emulation bus 12.
- the address recognition comparators 15 and the data recognition comparators 17 are 32-bit comparators.
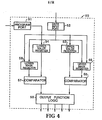
- Figure 4 shows a schematic block diagram of the components of the recognition comparators.
- the function of each comparator circuit 50 is to perform pattern and range recognition in a 1, 0, "don't care" manner on input data. Signals received at the program port 51 direct the 32-bit pattern received on the program input port 51 to one of four registers within the comparator.
- Each comparator has four 32-bit wide registers, an upper bound value register 53, a lower bound value register 54, an upper:bound mask register 55 and a lower bound mask register 56. All of the registers can be loaded on the fly, although the mask registers 55 and 56 in address and data recognition comparators 15 and 17 are typically loaded before a measurement is made and not altered during the measurement.
- the upper and lower bound value registers 53 and 54 and the upper and lower bound mask registers 55 and 56 are loaded with the configuration of the data or address event to be recognized.
- Input data received via the emulator bus 12 through data input port 52 is compared with the configurations loaded into the mask and value registers.
- the outputs of the upper boundary value and mask registers are sent to comparator 57 to determine if the input value is less than or equal to, or just equal to, the event data.
- the outputs of the lower boundary value and mask registers are sent to comparator 58 to determine if the input value is greater than or equal to, or just equal to the event data.
- output function logic 59 Based on the output signals from comparators 57 and 58, output function logic 59 provides one or more of five outputs: data is equal to the upper boundary mask, data is less than or equal to the upper boundary mask, data is greater than or equal to the lower boundary mask, data is equal to the lower boundary mask, and data is in the range between the upper boundary mask and the lower boundary mask.
- the comparators can operate in two modes, range recognition to determine if the input data or address is within a selected range, and equate recognition to detemine if the input data or address is the same as a selected configuration.
- address recognition comparators there are six address recognition comparators, two configured as address equate comparators and four configured as address range comparators.
- One of the address equate comparators is programmed to recognize the target system's "opcode fetch" instruction and to provide an output signal upon the occurrence of that instruction.
- the high level resource generator 19 comprises an additional set of ten 32-bit comparator circuits. These comparators are similar in construction and operation to those used for the address and data recognition comparators 15 and 17, illustrated in Figure 4.
- the inputs for the high level resource generator circuits are the outputs of the recognition comparators 15 and 17 rather than signals from the target system.
- the high level resource generator 19 can be programmed to recognize ten combinations of outputs from the recognition comparators 15 and 17, to construct complex event definitions.
- the ten outputs are distributed as follows: four to X-function generator 21, four to Y-function generator 23 and two to both X and Y function generators.
- the output signals are sent to the function generators, which are on a different p.c. board, via high level resource bus 16.
- Power supply 49 is a simple buck regulating switching power supply, to provide a source of 3.3V, 3.3A power for the recognition comparators 13, 15 and 17.
- Clock 47 is a 10Mhz clock generated from a 20Mhz clock whose output is divided by 2. The output pulses of clock 47 are distributed to various counters in the analyzer via system bus 14.
- Count mapper 43 and line counter 45 in combination constitute count statements circuitry 40, which counts the occurrences of a high level language instruction called a code line or simply a "line".
- Each high-level language line typically generates many low-level language opcodes, and the data on the emulation bus is in opcode, low-level form. Only the first opcode generated by each high-level language line should be counted to determine how many times that line was executed.
- the count mapper 43 is a RAM which maps the opcodes received over the emulation bus 12 into address locations in the line counter 45 which represent up to 255 chosen lines of high level language.
- the line counter 45 comprises a 256 x 12-bit RAM and a read- increment-write circuit.
- line counter 45 receives the count enable signal from the function generator 25, it reads the value at the address location, received from count mapper 43, increments the value by one, and writes the incremented value back into the same address location.
- each of the address locations assigned to count a high level language line contains the count of occurrences of that line.
- circuitry on the p.c. board shown in Figure 3A is connected to the circuitry on the p.c. board shown in Figure 3B via emulation bus 12, system bus 14 and high level resource bus 16.
- the second p.c. board contains the fast sequencer 22, the X and Y measurement function generators 21 and 23, dedicated function generator 25, timer 27 and occurrence counter 29.
- the "X” and “Y” measurement function generators 21 and 23, along with the dedicated function generator 25 translate general purpose output signals from the high level resource generator into special purpose, "dedicated” functions.
- the dedicated functions produced are used to control specific procedures of the analyzer. For example, the "Store” function causes the current cycle to be stored in acquisition memory; the "Timer Count” function determines whether or not timer 27 will be count enabled for the current cycle.
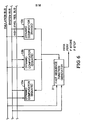
- Figure 5 depicts a block diagram of the components of the X and Y function generators.
- X function generator 21 comprises X generator RAM 61 (a 4k deep by 20-bit mapper RAM), a 12-bit multiplexer 63 to select what goes on the RAM address bus, and a 4-bit latch 65.
- X generator RAM 61 is loaded with address information from microprocessor 39 through multiplexer 63. The programming of the addresses in X generator RAM 61 determines which outputs from high level resource generator 19 affect which dedicated functions.
- the latch 65 provides a means for creating sequences within X generator 21.
- a feedback path between latch 65 and X generator RAM 61 allows a state of latch 65 to be used in a manner similar to an input from high level resource generator 19.
- the function created in the RAM might be defined as "true” for some combination of high level resource inputs and the latch being in a certain state.
- the output signals of X generator RAM 61 define the "next state” via the feedback path to latch 65, and also provide input signals to dedicated function generator 25.
- Y function generator 23 is similar to the X generator, except Y generator RAM 62 is 16 bits wide instead of 20 bits wide. Multiplexer 64 and latch 66 function like the equivalent circuits in the X generator. Output signals from Y generator RAM 62 also provide input signals-to dedicated function generator 25.
- Dedicated function generator 25 combines the output signals from X and Y function generator RAMS 61 and 62, and three other special purpose signals (store and stop signals from the fast sequencer and a memory full signal) to produce the dedicated functions output signals.
- the dynamic recognition portion of the analyzer referred to as fast sequencer 22 on Figure 3B, and shown in more detail in Figure 6, comprises three dynamic recognition comparators 13a, 13b and 13c and fast sequence function generator 31.
- fast sequencer 22 the analyzer can trace dynamically activated variables on a real-time basis.
- Dynamically activated variables used in many high level languages as local variables, have no permanently assigned memory address, but are assigned an address, usually on a stack, when the variable is needed during program execution.
- variable will be stored on the stack relative to a stack reference address used in the procedure which activates the variable.
- stack reference address used in the procedure which activates the variable.
- the fast sequencer is programmed to watch for entry into the procedure, determine the stack reference address, calculate the address range for the dynamic variable and then signal any access to the variable until it is inactivated.
- one dynamic recognition comparator 13a is loaded with the entry address for the procedure to activate the variable
- a second dynamic range comparator 13b is loaded with the status of the instruction which defines the stack reference address.
- the fast sequencer is loaded with the offset values which determine the range of locations of the dynamic variable and the location of the return address relative to the stack reference address.
- the fast sequence function generator begins to monitor comparator 13b for the "hook” operation.
- fast sequence function generator 31 acquires the current emulation address (actually the stack location), and adds this address to the stored offset values to determine the upper and lower boundary addresses for the location range of the dynamic variable.
- the sequencer 31 loads these boundary addresses into the third dynamic comparator 13c.
- the third comparator 1 3c is" configured in real-time upon activation of a variable being traced to signal access to that dynamic variable.
- the fast sequence function generator Upon any access to the variable, the fast sequence function generator provides a signal (F STORE) to the dedicated function generators 25 to enable the store function and store the current state in acquisition memory 35.
- the fast sequence function generator 31 also computes the return address of the stack from the hook address and the stored return address offset.
- the fast.sequence function generator 31 loads this address into dynamic comparator 13b, replacing the stack reference instruction status which is no longer needed.
- comparator 13b is configured to signal an exit from the procedure, indicating the variable being traced is no longer valid. At this point, if further tracing of the variable is required, the sequence is reinitiated, to determine the new address range allocated to the variable when it is activated subsequently.
- Timer 27 is a flexible 24-bit counter which can be programmed to count either signals from 10 Mhz clock 47 or from a state clock. Timer 27 can be reset before a measurement and then simply count an event or time until the end of the measurement. Alternatively, because the output of timer 27 is fed into X and Y function generators 21 and 23 just like a high level resource line, the timer can be loaded with an initial count and its output used to alter a sequence, cause a state to be stored or possibly stop the analyzer.
- Occurrence counter 29 is a 16-bit counter which counts occurrences of events. Occurrence counter 29 can be reset before a measurement and then count the occurrences of an event during the measurement. Alternatively, like timer 27, the occurrence counter can be loaded with an initial value and used to alter a sequence or cause a state to be stored, for example, after the Nth occurrence of an event. The output of the occurrence counter is fed into high level resource generator 19, and is thus similar to an output from the recognition comparators 15 and 17.
- Emulation bus 12, system bus 14 and high level resource bus 16 interconnect the p.c. board of Figure 3B with the boards of Figures 3A and 3C.
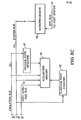
- the third p.c. board shown in block diagram form in Figure 3C, includes acquisition memory 35, floating point counter 33, o p code address register 37 and microprocessor 39 .
- Acquisition memory 35 comprises a 96-bit wide by 4096 deep RAM. During a measurement, acquisition memory stores the currently available block of data upon a signal from the store function in dedicated function generator 25. Each block of data stored in acquisition memory includes 96 bits: 8 bits of status, 24 bits of address and 16 bits of data from emulation bus 12, 24 bits from the opcode address register 37, 20 bits from the floating point counter 33 and 4 flag bits.
- sequential mode the memory is filled by storing the first block of data in a fixed location and storing succeeding blocks of data in sequentially following locations.
- the sequential mode is used generally for storing the data acquired during a measurement.
- the random access mode is used for a measurement called "last access", which stores data concerning the last occurrence of a chosen event.
- the event is typically access to a variable. Because the number of times the variable is accessed may exceed the capacity of acquisition memory, it is not effective to simply] sequentially store all accesses.
- random access mode data from an access to a given variable is written over data from any previous access to that variable.
- Each variable to be traced is thus assigned its own address location in acquisition memory.
- High level resource generator 19 is configured to output the assigned memory address to direct acquisiton memory 35 to store the current emulation data at the proper address. All event data is stored, but all unwanted event data is stored in a single address location in acquisition memory 35, designated the "discard" location. Thus, at the end of the measurement, the information concerning the last access to each chosen variable is stored in the memory location assigned to that variable.
- the data stored in acquisition memory 35 can be unloaded by microprocessor 39 for postprocessing and display of the data to the user.
- Opcode address register 37 comprises three 8-bit latches which can temporarily save the address information currently on emulation bus 12.
- the opcode address register latches the current emulation address upon receiving a signal from the address recognition comparator which is programmed to recognize when an "opcode read" is being performed by the target system.
- opcode address register 37 latches the latest opcode address.
- Opcode address register 37 is updated after the current state is stored in acquisition memory. Thus the current emulation address plus the previous opcode address are stored. When the current emulation address is an opcode address both this latest opcode address and the previous opcode address are stored. This can aid in sorting out program flow in certain measurements.
- Floating point counter 33 can count states or can be used as a timer counting pulses from lOMhz clock 47, depending on which measurement mode is being carried out. Whenever a state is stored in acquisition memory 35,-the floating point counter value is also stored.
- Microprocessor 39 is the interface between the software debugging analyzer and the host system via the BPC bus 18. Microprocessor 39 translates the low-level data acquired in acquisition memory 35 into high-level symbols suitable for display to the user by accessing the compiler database. Although microprocessor 39 does not participate actively in data acquisition, it translates the measurements specified by the user into the constructs required to set up the other components of the analyzer for making the measurements.
- the user installs certain controlling software into the host system when he installs the software debugging analyzer. That controlling software implements the various commands entered on keyboard 11 through which the user will operate the software debugging analyzer. As those commands are invoked, the controlling parameters for the various measurements emerge and are transferred to the onboard microprocessor 39 where they are used to configure the hardware elements of the software debugging analyzer and to control the operation of that circuitry.
- the user also installs certain compiler database information concerning the target system under test, which is used .in decoding high level language symbols into addresses and vice-versa.
- the raw data collected is transmitted to microprocessor 39 where it is post- processed to remove any extraneous data captured and relayed back to the host system processor where the processing is completed by reducing the data and creating various displays of the results on display 3.
- Microprocessor 39 is coupled to each of the system elements depicted in Figure 2 by system bus 14. After microprocessor 39 receives the parameters of the measurement to be performed, microprocessor 39 configures the circuit elements of the software debugging analyzer as described below.
- microprocessor 39 loads the proper configurations into address recognition comparators 15 and data recognition comparators 17.
- Microprocessor 39 configures high level resource generator 19 to define complex combinations of events recognized by the comparators 15 and 17.
- Microprocessor 39 also adjusts the operation of the sequencers in X and Y measurement function generators 21 and 23 to control the logic necessary to implement the high speed real-time acquisition of data carried out by dedicated function generator 25.
- microprocessor 39 For measurements which require recognition of dynamically activated variables, microprocessor 39 loads the proper configurations into the dynamic recognition comparators 13. Microprocessor 39 also adjusts the operation of the sequence in fast sequence function generator 31, so that the fast sequencer can control the operation of the dynamic recognition comparators 13 during the real-time measurement, loading the address of the dynamically activated variables into the comparators "on the fly” as those variables are activated and their locations defined.
- Microprocessor 39 also configures count mapper 43, and initializes floating point counter 33, timer 27 and occurrence counter 29.
- microprocessor 29 When the measurement has been completed, microprocessor 29 unloads the data stored in acquisition memory 35 and the count data stored in line counter 45, if required. Microprocessor 39 then post processes the data to remove any extraneous data such as unexecuted prefetched instructions and to translate the data from low-level code to high-level language. This translation is accomplished by referring to the compiler database information resident in the host system. Finally, microprocessor 39 passes the post processed data acquired from the measurement to the host system for display to the user.
- trace measurements form the backbone of the high-level software debugging operations provided by the software debugging analyzer.
- the trace modules and the trace data flow measurements are more global, giving the programmer an overview of both program and data flow at the module level.
- the trace statements and trace variables measurements are more local, and give the precise order of statement execution or the values of specific variables each time they are accessed.
- Two additional measurements, time modules and count statements aid the designer in software debugging as well as optimizing and testing procedures. While the measurements described below do not exhaust the entire range of measurement capabilities of the flexible hardware resources associated with the analyzer, they demonstrate the use of those hardware resources in performing measurements central to the software debugging process.
- the trace modules measurement tracks program flow by capturing the entry and exit to the specified modules. This is particularly useful in situations where modules are written by different programmers and may even be in different high-level languages. Tracing module flow when they are all first integrated shows in what order they were called and identifies possibly general locations of problems.
- modules or all the modules in a file can be traced.
- the "all" specification counts as one symbol; the modules can also be in up to four different non- adjacent files or in up to ten adjacent files.
- modules can be traced, with additional limitation imposed in this particular embodiment by the number of address range comparators. However, if the modules are not adjacent, only four can be traced (there are only four range resources). If all the modules in a file are specified, up to 255 different modules can be traced. In the most common setup of this measurement, using the "all" specification, no more than one range is used per file, so this is not a real limitation.
- the analyzer can trace recursive calls indefinitely and can trace both Pascal and C modules in the same measurement.
- the analyzer can run the trace modules measurement in both real-time and non-real-time modes.
- all modules in up to ten files can be traced to see program flow, including interrupt routines.
- Accurate time tags are displayed indicating the time spent in each module.
- the programmers can see quickly the order in which the modules are executed, when recursion occurred, how often an interrupt routine was called, and how much time was spent in each module.
- Figure 7 shows an example of how the analyzer's hardware resources are used for a measurement "trace modules PROCl, all FILE A, PROC4".
- Address comparators 15 configured as range comparators and data comparators 17 configured as equate comparators are used to detect module entry and module exit.
- the data equate comparators 17 are what actually determine the entry and exit points.
- Microprocessor 39 sets up these comparators to recognize the first and last instructions of a module based on data bus patterns.
- the address range comparators 15 are set up and used to qualify the entry and exit points so that only the ones in the specified modules are saved.
- Address ranges are set up around the addresses associated with the specified modules. In this example, even though three symbols were specified, only two ranges are needed; by definition all the modules in a single file are adjacent, and it happens that PROC4 is adjacent to FILE A.
- modules can be traced; with an additional limitation imposed in this particular embodiment by the number of address range comparators. However, if the modules are not adjacent, only four can be traced (there are only four range resources). If all the modules in a file are specified, up to 255 different modules can be traced.
- the trace data flow measurement tracks the values data at the entry and exit points of a procedure. Both static and dynamic variables can be traced. However, local variables and variables passed by value cannot be displayed at the exit point of the procedure, for at this point they are undefined. Unlimited recursion can also be traced. Up to three different modules can be traced in one. measur-ement, with up to 10 symbols specified. Since the traced data is not accessible on the emulation bus at entry and exit points of a module, this measurement must be run in non-real-time.
- Data can be viewed at entry and exit of a procedure, showing whether it was modified within the module. Values of important variables can be seen at each level of a recursive procedure; this is especially useful if a procedure is stuck in infinite recursion. The variable which should cause an exit condition can be traced and the bug quickly found.
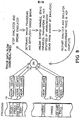
- Figure 8 shows how the analyzer's resources are used in a trace data flow measurement. As explained earlier, this measurement can only run non-real time because the analyzer needs information that is not flowing over the emulation bus 12.
- Three address recognition comparators 15 configured as equate comparators are used for each module, limiting the number of modules that can be specified to three. For each module, microprocessor 39 sets up one equate comparator for the entry, one for the exit, and a third comparator to recognize an address at the end of user code, just before the address of the module exit.
- the dedicated function generator halts the analyzer and the values of specified variables are read from emulation or user memory. Then the analyzer and emulator are restarted.
- the trace statements measurement traces statement flow within a single module.
- the statements are displayed in the order of their execution and variable values are displayed.
- the measurement can run in both real-time and non-real-time.
- the statement range which can be unlimited, can be defined as the entire procedure or a line range within a procedure.
- the advantage to running in non-real-time is that dynamic variables can be traced. Otherwise, only the values of static variables will show up on the display; using "don't care" no variable values will be displayed. Again, time tags are displayed showing an accurate execution time for each high-level statement.
- the display gives a step-by-step view of the execution order of the high-level statements, much like a state display of low-level code.
- the debugging process can be greatly sped up, as all the relevant information concerning the execution of a module is displayed. This is a highly effective way to observe the interaction between program and data flow.
- Trace statements can be divided into two measurements, a real-time one and a non-real-time one.
- the real-time one is less complex conceptually because the emulator is never halted, and all the stored information is flowing over emulation bus 12.
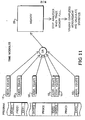
- Figure 9 illustrates an example of how the analyzer's resources are used in making a real-time trace statements measurement over a line range or procedure.
- Microprocessor 39 sets up one address recognition comparator 15 configured as a range comparator to detect activity in the specified line range to determine when a storing "window" should be opened.
- the special address recognition comparator which is set up to detect an opcode fetch is used to signal the execution of code.
- the high level resource generator 19 is set up so that these two signals are ANDed together and when they go true a "window” is opened and all the data flowing over the emulation bus is stored in acqusition memory.
- the address range comparator 15 signals that the program is executing code outside of the specified line range, then the storing "window” is closed.
- a trace statements measurement using the "don't care” specification is simply the analyzer executing with the window continuously open.
- the non-real-time trace statements measurement is more complex because more information is gathered, including information about dynamic variables.
- one address recognition comparator 15 is programmed to detect the range of statements traced and one address recognition comparator is used to detect an opcode fetch to create a measurement "window".
- two address recognition comparators are set up to recognize the entry and exit points. Upon entry or exit, the analyzer halts the emulator using the dedicated function generator 25 and stores data concerning the location and value of dynamic variables.
- the trace variables measurement allows the user to trace all acccesses to specified variables during program execution.
- the measurement can run both in real-time and non-real-time; the feature set for both modes is identical. Up to ten variables can be traced in each measurement, but, during execution the address recognition comparators 15 are used, so sometimes the number of static variables that can be traced is reduced. Up to ten of dynamic vairables under.a given module header can be traced. Source line numbers are displayed, convenient for localized debugging. A variable which is seen to have an incorrect value in a trace data flow measurement can thereafter be traced using the trace variables measurement, and all the reads and writes to it will be displayed. It is then a simple matter to determine where the program went astray.
- Trace variables works the same way in real time as in non-real time, as illustrated in Figure 10. Static variables are comparatively easy to trace. Address recognition comparators 15 configured as equate comparators are used for static variables that are a byte wide, and address comparators configured as range comparators are used on longer variables, records and arrays. The analyzer will also use one address range comparator over any adjacent variables. If the range is accessed the analyzer's recognition logic circuits, through dedicated function generator 25 cause the address and values to be stored in acquisition memory 35.
- Dynamic variables are traced in a similar way. However, since the number of dynamic recognition comparators is less; one dynamic comparator is used to cover all variables even if they are not adjacent. During postprocessing, unwanted accesses are filtered out by microprocessor 39. The difficulty in tracing dynamic variables is locating the stack reference, and the actual memory locations for these dynamic variables, since these are not defined until the program is executing.
- Microprocessor 39 sets up one dynamic equate comparator 13a to locate the entry of the procedure where the dynamic variables of interest are defined.
- the first data write after a module entry point is the dynamic variable stack reference, which is stored by the fast sequence function generator 31.
- fast sequence generator 31 uses this stack reference, and the offsets for dynamic variables which microprocessor 39 provided from the compiler data base, fast sequence generator 31 determines the locations range of the dynamic variables and loads these addresses into the other dynamic recognition range comparator 13c. This is done before any of these variables have been read or written to by the user program.
- the dynamic recognition comparator 13b which was used to recognize the first data write, is re-loaded to recognize the location on the stack of the procedure's return address.
- Fast sequence function generator 31, through dedicated function generator 25, causes all accesses to the range stored in the second comparator to be stored in acquisition memory 35 until equate comparator 13b indicates that the return address has been read. After this the variables no longer exist and the sequence is started up again.
- Up to four modules can be timed using the time modules measurement, which displays the minimum, maximum, and mean time spent in each module.
- the measured time includes all time between entry of the specified module and exit from that module, including time spent in subroutine calls and interrupts. Timing recursive modules is handled by the analyzer, up to 255 levels deep. The measurement can be run in both real-time and non-real-time.
- Modules can be tested to see if.they are executing within specified times. Inefficient modules can be spotted and then optimized. Also, the effect that interrupts have on modules can be studied. The display also shows the number of times the module was timed, which gives an indication of the statistical accuracy of the measurement.
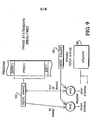
- Figure 11 illustrates how the analyzer's resources are used to make the time modules measurement.
- Two address recognition comparators 15 configured as equate comparators are used for each module, thus a limit of four modules can be traced. These equate comparators are set up by microprocessor 39 to look for entry and exit points of each module.
- the analyzer's logic recognition circuits through dedicated function generator 25 cause the state to be stored in acquisition memory 35.
- Dedicated function generator 25 also starts the floating point counter 33 at the beginning of the measurement, and the absolute time for every exit and entry point is stored in acquisition.memory 35 as a time tag with the stored state.
- microprocessor 39 uses these time tags to determine the time spent in each module, and then determine the statistical results.
- the count statements measurement counts the number of times each statement in a specified module or line range is executed. Up to 255 statements can be counted, but they all must be in one module. The counters will count up to 4094 then overflow; however, if only one line is traced, the analyzer uses the floating point counter 33 which has a much larger 20-bit floating point capacity.
- the count statements measurement uses the same address recognition comparators used in the other measurements, but also uses some dedicated hardware, the count mapper 43 and line counter 45.
- the analyzer can trace 255 lines in one module, but this traced part of the program cannot exceed 4k bytes of memory because the count mapper 43 is a 4k to 256 "bucket" mapper.
- the "bucket” refers to the 12-bit values in line counter 45 associated with each source line.
- the measurement works by setting up the address range comparator 15 for recognition over the specified module/line range to drive the count enable signal. Before the measurement is executed, microprocessor 39 loads count mapper 43, using the line number information found in the compiler database file.
Abstract
Description
- An increasing number of products are incorporating microprocessors. Much of the development cost of these products is related to the testing and debugging of the programs executed by the microprocessor. Also, the performance of the resulting product may depend heavily upon the various design choices made and the skill employed in writing those programs. That programming may be in the form of firmware or software; as far as the description below is concerned the difference is moot, and such programming will hereinafter be referred to simply as software.
- Any new product that relies heavily on software to accomplish its intended function goes through a development cycle during which designers depend on a variety of measurement tools (e.g., emulators, timing analyzers, logic state analyzers and the like) to test, debug, and analyze the product's performance. The instant invention is an additional measurement tool that aids designers in nearly every phase of the software development cycle. It can be used for software characterization, testing, debugging, and optimization, and can characterize software nonintrusively as that software executes in real time.
- Traditionally, program performance has been measured in one of two ways: through in-program "hooks", which print out a short message every time the block of code in which they reside is executed, or by custom designed monitoring programs, which oversee the execution of the target code and measure the duration of execution. The main drawback of both traditional methods is that they are intrusive and affect real-time operation. In-program hooks lengthen the program under test and must be removed if the finished code is to fit in a restricted memory space.
- Once removed, however, they are no longer available to monitor code execution. Therefore, for every debugging effort the hooks must be regenerated; a difficult and costly task. Similarly, program monitors, whether they be line-by-line tracers or event timers, add their own execution time to that of the program. As a consequence, they are not well suited to situations that require real detective work across a wide spectrum of module interaction. A further disadvantage of these traditional methods is that they must be specifically tailored to each measurement to be performed, a time consuming and possibly error prone programming task in itself.
- Traditional methods suffered another disadvantage in that they are not well suited to debugging or analyzing programs written in high level languages such as C and PASCAL. The programmer must do several hierarchy translations to bridge the gap between the language in which the program is designed and the raw state flow level in which the analyzer is operated. The result is that the programmer has to think through the testing and debugging procedure in a different context from that in which the basic program was conceptualized and implemented.
- Thus, it is an object of the invention to provide a method and an apparatus for software debugging, which do not affect real-time operation and do not require any specific tayloring to each measurement performed.
- According to the invention, this object is met by the method and apparatus as defined in
claims - In performing the disclosed method, the software debugging' analyzer also disclosed herein performs real-time nonintrusive measurements. It greatly reduces the mismatch between the analyses and debugging capabilities of the measurement system and the level at which the program to be analyzed was conceptualized and implemented.
- The debugging analyzer disclosed herein provides increases in the automation of software testing and debugging at three levels: automation of the software hierarchy translation; automation of the basic test and debug measurements; and automation of a series or sequenc=e_ of measurements.
- Data collection parameters are entered quickly and easily with directed-syntax softkeys. Symbols and labels generated in program assembly or compilation can be used directly in defining measurements. Measurement configurations are flexible, meeting a variety of application requirements. The debugging analyzer includes basic performance measurement capabilities, providing for testing of module/program timing and code execution specifications. These performance measurement capabilities are fundamental to aid the user's verification and validation activities for improved software reliability, as well as in the basic debug process. Timing measurements provide important improvements in the debug effort, opening up a third dimension to the user to provide a more comprehensive picture of the system being analyzed. Also, the performance metrics of the analyzer allow the user to accomplish performance analysis and code optimization activities. (E.g., not meeting a timing, occurrence, or space specification is a but). The software code and data measurement capabilities provide significant improvements to programmer productivity over present debug and analysis packages. All these measurements can be accessed via a highly leveraged automatic test management capability. And of extreme importance to improved accuracy and reduced uncertainty of these measurements, is the non-intrusive and real-time implementation of this instrumentation. These resources are presented to the user in an easy-to-use implementation, which is in alignment with the way software solutions are conceptualized, designed, implemented and maintained.
- These and other aspects of the invention are achieved by a hybrid design with an optimized balance between hardware and software implementation, using hardware to provide real-time data acquisition, speed and nonintrusive measurement, and software to provide a flexible feature set.
- Figure 1 is a simplified block diagram of a microprocessor development system which illustrates the connection of the invention to a host system when the invention is configured as a plug-in option.
- Figure 2 is a simplified block diagram of the information flow in the system of the invention.
- Figures 3A, 3B and 3C are simplified block diagrams of the set of printed circuit boards incorporating the invention when configured as a plug-in option to the host system as illustrated in Figure 1.
- Figure 4 is a simplified block diagram which illustrates the components of a recognition comparator circuit used in the invention.
- Figure 5 is a simplified block diagram which illustrates in greater detail the components of the X and Y measurement function generators shown in Figure 2.
- Figure 6 is a simplified block diagram which illustrates in greater detail the components of the fast sequence function generator shown in Figure 2.
- Figure 7 is an idealized flow diagram illustrating the operation of the analyzer for the trace modules measurement.
- Figure 8 is an idealized flow diagram illustrating the operation of the analyzer for the trace data flow measurement.
- Figure 9 is an idealized flow diagram illustrating the' operation of the analyzer for the trace statements measurement.
- Figure 10 is an idealized flow diagram illustrating the operation of the analyzer for the trace variables measurement.
- Figure 11 is an idealized flow diagram illustrating the operation of the analyzer for the time modules measurement.
- Figure 12 is an idealized flow diagram illustrating the operation of the -analyzer for the count statements measurement.
- Figure 1 is a block diagram of a "microprocessor development system" that includes a
keyboard 1 with a row of re-definable "soft keys" adjacent aCRT display 3. The apparatus also includes ahost processor 2,memory 4 and a mass storage facility 5 (e.g., a hard disc drive) and is capable of receiving an extensive collection of options. Each option has one or more printed circuit boards that are interconnected with the host components viaBPC bus 18. Generally each option also has some associated software which augments to an operating and measurement system already resident in the host system. - Among the options that may be installed in the microprocessor development system are emulators, cross compilers; logic state analyzers, timing analyzers, and the subject of the instant disclosure, a software debugging analyzer. The options are interconnected via intermodule bus 6. It will, of course, be understood by those skilled in the art that the invention need not be produced as an option to some other apparatus, but may equally well be implemented as a complete stand-alone measurement device, if desired. Nevertheless, since the invention was first produced as such an option, it will, as a matter of convenience, be described in that form.
- In the present embodiment the software debugging analyzer consists of three p.c. boards and some accompanying software that are installed in the microprocessor development system. In one particular actual embodiment where the apparatus is a Hewlett-Packard model 64000 an emulator option must also be installed. In that case the connections for the plug-in p.c. boards are arranged so that the necessary signals from the target system under test are automatically coupled to the software debugging analyzer as the target software is executed with the emulator.
- It would, of course, be equally possible to equip the software debugging analyzer with its own probes as well as signal acquisition and conditioning circuitry, so that it could be attached directly to an arbitrary processor executing the target software. While that would have certain advantages pertaining to flexibility, the scheme of automatic coupling to an emulator has the equally attractive advantage of allowing software performance analysis to proceed even before the hardware of the target system is complete.
- Once the software debugging analyzer is installed and accessed, various re-definable definitions appear at the bottom of the CRT display. These definitions are associated with the row of re-definable soft keys. With the aid of these keys the user instructs the apparatus and its various options (including the software debugging analyzer in particular) concerning the measurements that are desired. This is accomplished via an interactive process involving "directed syntax," wherein the operating and measurement system dynamically varies the definitions of the soft keys as the user proceeds through the syntax of each command. In this way the user is continually presented with only valid choices, and is automatically instructed and guided in his selection of parameters for the various commands. In response to his commands the operating and measurement system writes various control values into registers in the option p.c. boards and elsewhere. That configures those elements of hardware to operate in the modes selected and to perform the desired measurements.
- Figure 2 illustrates the information flow in the analyzer. Signals from the target system under test enter the software debugging analyzer via
data input 11 toemulation bus 12. The input signals include address, data and status information from the target system. The address and status signals, which comprise 32 bits, are sent todynamic recognition comparators 13 andaddress recognition comparators 15 andfast sequence generator 31. The data signals, which comprise 16 bits, are sent todata recognition comparators 17. The address, status and data signals also go to theacquisition memory 35 for selective storage as described below. - The
address recognition comparators 15 are programmable to recognize target system signals which represent an event of interest in carrying out the chosen debugging analysis routine, i.e., whether a particular address or status is the same as or within a range of those chosen by the user. Similarly, thedata recognition comparators 17 are programmable to recognize the target system data signals which are equal to or within a range of those chosen by the user. - The outputs from the address and data recognition comparators go to high
level resource generator 19. The high level resource generator is programmable to determine the occurrence of a number of more complex events, i.e., combinations of multiple events recognized by the address and data recognition comparators. - The address and data recognition comparators and the high level resource generator thus provide two levels of event recognition logic. The flexibility of the event recognition circuits is thereby increased because low-level events and complex combinations of elementary events can be programmed separately. This also allows the low-level events recognition to be programmed more simply, because an event may be defined as a single address, status or data stream rather than a combination of them. A further advantage is that the output of high
level resource generator 19 has a relatively high density of information, thus the next level of recognition logic can be used to perform more complex analyses. - The outputs of high
level resource generator 19 go to two sequencers, Xmeasurement function generator 21 and Ymeasurement function generator 23. These function generators are programmable to determine the occurrence of a sequence of the events represented by the outputs of highlevel resource generator 19. Additional inputs to functiongenerators timer 27 and fastsequence function generator 31, whose operation is described below. These additional inputs can also be employed in defining a sequence of events to be recognized. - The outputs of
function generators dedicated function generator 25, to produce any of a number of operating functions. Included are: start, timer count, timer load, occur, count, store, stop and search. The start function initiates a measurement episode and enables the other functions. Timer count and timerload control timer 27. The occur function is used to provide input to occurrence counter 29 which counts selected events for highlevel resource generator 19. The count function is used for input to floatingpoint counter 33 whose output can be stored inacquisition memory 35 and as input toline counter 45 for counting line execution. The store function stores inacquisition memory 35 the address, data and status information currently onemulation bus 12, as well as the current value in floatingpoint counter 33 and the current value inopcode address register 37. The stop function terminates a measurement episode. The search function is used for driving signals to external apparatus in the host system such as the other analyzers. - To summarize the operation of the event recognition system described so far: low-level event recognition is done by address and
data recognition comparators level resource generator 19, and sequences of complex events are examined byfunction generators Timer 27 andoccurrence counter 29 are controlled bydedicated function generator 25 and provide feedback input to highlevel resource generator 19 andmeasurement function generators - The portion of the event recognition system shown on the left hand side of Figure 2, comprising
dynamic recognition comparators 13 and fast.sequence function generator 31, provides for recognition of events which involve dynamically activated variables. Typically, variables- are assigned a memory location, or address, and any activity with respect to a variable can be tracked by watching that address. However, in some high-level programming languages, e.g., PASCAL, a variable may be assigned only a relative location, for example, a location relative to the top of a stack of local variables. In order to trace any activity with respect to such dynamically activated variables, the analyzer must keep track of where the top of the stack is and where the variable is located in the stack. - The
dynamic recognition comparators 13 are programmable in real-time to recognize target system signals which represent the activation of variables and the stack location assigned to them. Fastsequence function generator 31 is programmable to interpret the output signals from thedynamic recognition comparators 13 and reprogram at least one of the dynamic comparators with the address range assigned to the dynamically activated variable. The outputs of fastsequence function generator 31 go to X and Ymeasurement function generators dedicated function generator 25. Thus, when adynamic comparator 13 detects access to a dynamic variable fastsequence function generator 31 can cause the current state onemulation bus 12 to be stored inacquisition memory 35. - The
count statements circuit 40 counts the occurrences of a high level language instruction, based on signals received from thededicated function generator 25 and fromemulation bus 12. - In the particular embodiment described herein, the software debugging analyzer is contained on three interconnected p.c. boards which are inserted into the host microprocessor development system. Figures 3A; 3B and 3C illustrate schematically the layout of circuitry on the three p.c. boards.
- Referring to Figure 3A, the first p.c. board contains
emulation bus interface 41address recognition comparators 15,data recognition comparators 17, highlevel resource generator 19,count mapper 43 andline counter 45,clock 47 andpower supply 49. -
Emulation bus interface 41 provides an input port through which signals from the emulator enter the software debugging analyzer. The signals from the emulator are distributed to the appropriate circuits throughout the analyzer viaemulation bus 12. - The
address recognition comparators 15 and thedata recognition comparators 17 are 32-bit comparators. Figure 4 shows a schematic block diagram of the components of the recognition comparators. The function of eachcomparator circuit 50 is to perform pattern and range recognition in a 1, 0, "don't care" manner on input data. Signals received at theprogram port 51 direct the 32-bit pattern received on theprogram input port 51 to one of four registers within the comparator. Each comparator has four 32-bit wide registers, an upper bound value register 53, a lower boundvalue register 54, an upper:boundmask register 55 and a lower boundmask register 56. All of the registers can be loaded on the fly, although the mask registers 55 and 56 in address anddata recognition comparators emulator bus 12 throughdata input port 52 is compared with the configurations loaded into the mask and value registers. The outputs of the upper boundary value and mask registers are sent tocomparator 57 to determine if the input value is less than or equal to, or just equal to, the event data. The outputs of the lower boundary value and mask registers are sent tocomparator 58 to determine if the input value is greater than or equal to, or just equal to the event data. - Based on the output signals from
comparators output function logic 59 provides one or more of five outputs: data is equal to the upper boundary mask, data is less than or equal to the upper boundary mask, data is greater than or equal to the lower boundary mask, data is equal to the lower boundary mask, and data is in the range between the upper boundary mask and the lower boundary mask. Thus the comparators can operate in two modes, range recognition to determine if the input data or address is within a selected range, and equate recognition to detemine if the input data or address is the same as a selected configuration. , - In the embodiment described, there are six address recognition comparators, two configured as address equate comparators and four configured as address range comparators. There are six data recognition comparators, four configured as data equate comparators and two configured as data range comparators. One of the address equate comparators is programmed to recognize the target system's "opcode fetch" instruction and to provide an output signal upon the occurrence of that instruction.
- Returning to the description of components shown in Figure 3A, the high
level resource generator 19 comprises an additional set of ten 32-bit comparator circuits. These comparators are similar in construction and operation to those used for the address anddata recognition comparators recognition comparators level resource generator 19 can be programmed to recognize ten combinations of outputs from therecognition comparators X-function generator 21, four to Y-function generator 23 and two to both X and Y function generators. The output signals are sent to the function generators, which are on a different p.c. board, via highlevel resource bus 16. -
Power supply 49 is a simple buck regulating switching power supply, to provide a source of 3.3V, 3.3A power for therecognition comparators Clock 47 is a 10Mhz clock generated from a 20Mhz clock whose output is divided by 2. The output pulses ofclock 47 are distributed to various counters in the analyzer viasystem bus 14. -
Count mapper 43 andline counter 45 in combination constitutecount statements circuitry 40, which counts the occurrences of a high level language instruction called a code line or simply a "line". Each high-level language line typically generates many low-level language opcodes, and the data on the emulation bus is in opcode, low-level form. Only the first opcode generated by each high-level language line should be counted to determine how many times that line was executed. - The
count mapper 43 is a RAM which maps the opcodes received over theemulation bus 12 into address locations in theline counter 45 which represent up to 255 chosen lines of high level language. - The
line counter 45 comprises a 256 x 12-bit RAM and a read- increment-write circuit. When line counter 45 receives the count enable signal from thefunction generator 25, it reads the value at the address location, received fromcount mapper 43, increments the value by one, and writes the incremented value back into the same address location. Thus at the end of a measurement, each of the address locations assigned to count a high level language line contains the count of occurrences of that line. - The circuitry on the p.c. board shown in Figure 3A is connected to the circuitry on the p.c. board shown in Figure 3B via
emulation bus 12,system bus 14 and highlevel resource bus 16. - Referring now to Figure 3B, the second p.c. board.contains the
fast sequencer 22, the X and Ymeasurement function generators dedicated function generator 25,timer 27 andoccurrence counter 29. - The "X" and "Y"
measurement function generators dedicated function generator 25 translate general purpose output signals from the high level resource generator into special purpose, "dedicated" functions. The dedicated functions produced are used to control specific procedures of the analyzer. For example, the "Store" function causes the current cycle to be stored in acquisition memory; the "Timer Count" function determines whether or nottimer 27 will be count enabled for the current cycle. - Figure 5 depicts a block diagram of the components of the X and Y function generators.
X function generator 21 comprises X generator RAM 61 (a 4k deep by 20-bit mapper RAM), a 12-bit multiplexer 63 to select what goes on the RAM address bus, and a 4-bit latch 65..X generator RAM 61 is loaded with address information frommicroprocessor 39 throughmultiplexer 63. The programming of the addresses inX generator RAM 61 determines which outputs from highlevel resource generator 19 affect which dedicated functions. Thelatch 65 provides a means for creating sequences withinX generator 21. A feedback path betweenlatch 65 andX generator RAM 61 allows a state oflatch 65 to be used in a manner similar to an input from highlevel resource generator 19. For example, the function created in the RAM might be defined as "true" for some combination of high level resource inputs and the latch being in a certain state. The output signals ofX generator RAM 61 define the "next state" via the feedback path to latch 65, and also provide input signals todedicated function generator 25. -
Y function generator 23 is similar to the X generator, exceptY generator RAM 62 is 16 bits wide instead of 20 bits wide.Multiplexer 64 and latch 66 function like the equivalent circuits in the X generator. Output signals fromY generator RAM 62 also provide input signals-todedicated function generator 25. -
Dedicated function generator 25 combines the output signals from X and Y function generator RAMS 61 and 62, and three other special purpose signals (store and stop signals from the fast sequencer and a memory full signal) to produce the dedicated functions output signals. - The dynamic recognition portion of the analyzer, referred to as
fast sequencer 22 on Figure 3B, and shown in more detail in Figure 6, comprises threedynamic recognition comparators sequence function generator 31. Withfast sequencer 22, the analyzer can trace dynamically activated variables on a real-time basis. Dynamically activated variables, used in many high level languages as local variables, have no permanently assigned memory address, but are assigned an address, usually on a stack, when the variable is needed during program execution. - One thing that is known about these variables is where the variable will be stored on the stack relative to a stack reference address used in the procedure which activates the variable. Thus, once the variable is activated, its location is defined if the stack reference address can be determined. This reference address, or "hook" is placed on the stack when the procedure to activate the variable is entered. Another quantity known relative to the hook is the return address, which is used to indicates that the variable has been inactivated and is no longer valid.
- The fast sequencer is programmed to watch for entry into the procedure, determine the stack reference address, calculate the address range for the dynamic variable and then signal any access to the variable until it is inactivated.
- To accomplish this, before starting a measurement, one
dynamic recognition comparator 13a is loaded with the entry address for the procedure to activate the variable, and a seconddynamic range comparator 13b is loaded with the status of the instruction which defines the stack reference address. The fast sequencer is loaded with the offset values which determine the range of locations of the dynamic variable and the location of the return address relative to the stack reference address. - When
comparator 13a signals entry into the procedure, the fast sequence function generator begins to monitorcomparator 13b for the "hook" operation. When the "hook" operation transpires, fastsequence function generator 31 acquires the current emulation address (actually the stack location), and adds this address to the stored offset values to determine the upper and lower boundary addresses for the location range of the dynamic variable. Thesequencer 31 loads these boundary addresses into the thirddynamic comparator 13c. Thus, the third comparator 13c is" configured in real-time upon activation of a variable being traced to signal access to that dynamic variable. Upon any access to the variable, the fast sequence function generator provides a signal (F STORE) to thededicated function generators 25 to enable the store function and store the current state inacquisition memory 35. - The fast
sequence function generator 31 also computes the return address of the stack from the hook address and the stored return address offset. The fast.sequence function generator 31 loads this address intodynamic comparator 13b, replacing the stack reference instruction status which is no longer needed. Thus,comparator 13b is configured to signal an exit from the procedure, indicating the variable being traced is no longer valid. At this point, if further tracing of the variable is required, the sequence is reinitiated, to determine the new address range allocated to the variable when it is activated subsequently. -
Timer 27 is a flexible 24-bit counter which can be programmed to count either signals from 10Mhz clock 47 or from a state clock.Timer 27 can be reset before a measurement and then simply count an event or time until the end of the measurement. Alternatively, because the output oftimer 27 is fed into X andY function generators -
Occurrence counter 29 is a 16-bit counter which counts occurrences of events.Occurrence counter 29 can be reset before a measurement and then count the occurrences of an event during the measurement. Alternatively, liketimer 27, the occurrence counter can be loaded with an initial value and used to alter a sequence or cause a state to be stored, for example, after the Nth occurrence of an event. The output of the occurrence counter is fed into highlevel resource generator 19, and is thus similar to an output from therecognition comparators -
Emulation bus 12,system bus 14 and highlevel resource bus 16 interconnect the p.c. board of Figure 3B with the boards of Figures 3A and 3C. - The third p.c. board, shown in block diagram form in Figure 3C, includes
acquisition memory 35, floatingpoint counter 33, opcode address register 37 and microprocessor 39. -
Acquisition memory 35 comprises a 96-bit wide by 4096 deep RAM. During a measurement, acquisition memory stores the currently available block of data upon a signal from the store function indedicated function generator 25. Each block of data stored in acquisition memory includes 96 bits: 8 bits of status, 24 bits of address and 16 bits of data fromemulation bus 12, 24 bits from theopcode address register 37, 20 bits from the floatingpoint counter - There are two modes of storing information in
acquisition memory 35, sequential and random access. In sequential mode, the memory is filled by storing the first block of data in a fixed location and storing succeeding blocks of data in sequentially following locations. The sequential mode is used generally for storing the data acquired during a measurement. - The random access mode is used for a measurement called "last access", which stores data concerning the last occurrence of a chosen event. The event is typically access to a variable. Because the number of times the variable is accessed may exceed the capacity of acquisition memory, it is not effective to simply] sequentially store all accesses. In random access mode, data from an access to a given variable is written over data from any previous access to that variable. Each variable to be traced is thus assigned its own address location in acquisition memory. High
level resource generator 19 is configured to output the assigned memory address todirect acquisiton memory 35 to store the current emulation data at the proper address. All event data is stored, but all unwanted event data is stored in a single address location inacquisition memory 35, designated the "discard" location. Thus, at the end of the measurement, the information concerning the last access to each chosen variable is stored in the memory location assigned to that variable. - When any measurement is completed, the data stored in
acquisition memory 35 can be unloaded bymicroprocessor 39 for postprocessing and display of the data to the user. -
Opcode address register 37 comprises three 8-bit latches which can temporarily save the address information currently onemulation bus 12. The opcode address register latches the current emulation address upon receiving a signal from the address recognition comparator which is programmed to recognize when an "opcode read" is being performed by the target system. Thus, opcode address register 37 latches the latest opcode address. -
Opcode address register 37 is updated after the current state is stored in acquisition memory. Thus the current emulation address plus the previous opcode address are stored. When the current emulation address is an opcode address both this latest opcode address and the previous opcode address are stored. This can aid in sorting out program flow in certain measurements. - Floating
point counter 33 can count states or can be used as a timer counting pulses fromlOMhz clock 47, depending on which measurement mode is being carried out. Whenever a state is stored inacquisition memory 35,-the floating point counter value is also stored. -
Microprocessor 39 is the interface between the software debugging analyzer and the host system via theBPC bus 18.Microprocessor 39 translates the low-level data acquired inacquisition memory 35 into high-level symbols suitable for display to the user by accessing the compiler database. Althoughmicroprocessor 39 does not participate actively in data acquisition, it translates the measurements specified by the user into the constructs required to set up the other components of the analyzer for making the measurements. - The user installs certain controlling software into the host system when he installs the software debugging analyzer. That controlling software implements the various commands entered on
keyboard 11 through which the user will operate the software debugging analyzer. As those commands are invoked, the controlling parameters for the various measurements emerge and are transferred to theonboard microprocessor 39 where they are used to configure the hardware elements of the software debugging analyzer and to control the operation of that circuitry. The user also installs certain compiler database information concerning the target system under test, which is used .in decoding high level language symbols into addresses and vice-versa. Upon completion of the measurement, the raw data collected is transmitted tomicroprocessor 39 where it is post- processed to remove any extraneous data captured and relayed back to the host system processor where the processing is completed by reducing the data and creating various displays of the results ondisplay 3. -
Microprocessor 39 is coupled to each of the system elements depicted in Figure 2 bysystem bus 14. Aftermicroprocessor 39 receives the parameters of the measurement to be performed,microprocessor 39 configures the circuit elements of the software debugging analyzer as described below. - If a measurement requires recognition of static address, data or state information,
microprocessor 39 loads the proper configurations intoaddress recognition comparators 15 anddata recognition comparators 17.Microprocessor 39 configures highlevel resource generator 19 to define complex combinations of events recognized by thecomparators Microprocessor 39 also adjusts the operation of the sequencers in X and Ymeasurement function generators dedicated function generator 25. - For measurements which require recognition of dynamically activated variables,
microprocessor 39 loads the proper configurations into thedynamic recognition comparators 13.Microprocessor 39 also adjusts the operation of the sequence in fastsequence function generator 31, so that the fast sequencer can control the operation of thedynamic recognition comparators 13 during the real-time measurement, loading the address of the dynamically activated variables into the comparators "on the fly" as those variables are activated and their locations defined. -
Microprocessor 39 also configurescount mapper 43, and initializes floatingpoint counter 33,timer 27 andoccurrence counter 29. - When the measurement has been completed,
microprocessor 29 unloads the data stored inacquisition memory 35 and the count data stored inline counter 45, if required.Microprocessor 39 then post processes the data to remove any extraneous data such as unexecuted prefetched instructions and to translate the data from low-level code to high-level language. This translation is accomplished by referring to the compiler database information resident in the host system. Finally,microprocessor 39 passes the post processed data acquired from the measurement to the host system for display to the user. - The details of the software by which the
microprocessor 39 operates are in the source code listing of that software which is attached as Appendix A. Reference to this appendix will be useful in answering any detailed questions concerning the operation ofmicroprocessor 39. - Four measurements, called trace measurements form the backbone of the high-level software debugging operations provided by the software debugging analyzer. The trace modules and the trace data flow measurements are more global, giving the programmer an overview of both program and data flow at the module level. The trace statements and trace variables measurements are more local, and give the precise order of statement execution or the values of specific variables each time they are accessed. Two additional measurements, time modules and count statements aid the designer in software debugging as well as optimizing and testing procedures. While the measurements described below do not exhaust the entire range of measurement capabilities of the flexible hardware resources associated with the analyzer, they demonstrate the use of those hardware resources in performing measurements central to the software debugging process.
- The trace modules measurement tracks program flow by capturing the entry and exit to the specified modules. This is particularly useful in situations where modules are written by different programmers and may even be in different high-level languages. Tracing module flow when they are all first integrated shows in what order they were called and identifies possibly general locations of problems.
- Either specifically named modules or all the modules in a file can be traced. The "all" specification counts as one symbol; the modules can also be in up to four different non- adjacent files or in up to ten adjacent files.
- Ten explicitly named modules can be traced, with additional limitation imposed in this particular embodiment by the number of address range comparators. However, if the modules are not adjacent, only four can be traced (there are only four range resources). If all the modules in a file are specified, up to 255 different modules can be traced. In the most common setup of this measurement, using the "all" specification, no more than one range is used per file, so this is not a real limitation. The analyzer can trace recursive calls indefinitely and can trace both Pascal and C modules in the same measurement.
- The analyzer can run the trace modules measurement in both real-time and non-real-time modes. In real-time, all modules in up to ten files can be traced to see program flow, including interrupt routines. Accurate time tags are displayed indicating the time spent in each module. Thus, the programmers can see quickly the order in which the modules are executed, when recursion occurred, how often an interrupt routine was called, and how much time was spent in each module. These are all useful measurements to generally locate a problem; if any of this information deviates from expectations, then another measurement can be made to localize the problem.
- Figure 7 shows an example of how the analyzer's hardware resources are used for a measurement "trace modules PROCl, all FILE A, PROC4".
Address comparators 15 configured as range comparators anddata comparators 17 configured as equate comparators are used to detect module entry and module exit. The data equatecomparators 17 are what actually determine the entry and exit points.Microprocessor 39 sets up these comparators to recognize the first and last instructions of a module based on data bus patterns. Theaddress range comparators 15 are set up and used to qualify the entry and exit points so that only the ones in the specified modules are saved. - Address ranges are set up around the addresses associated with the specified modules. In this example, even though three symbols were specified, only two ranges are needed; by definition all the modules in a single file are adjacent, and it happens that PROC4 is adjacent to FILE A.
- Finally, the results of the low-level recognition resources are logically combined by setting up high
level resource generator 19, so thatdedicated function generator 25 causes the data associated with an entry or exit point to be stored inacquisition memory 35. In prefetching, sometimes data is stored which was not a true entry;microprocessor 39 post processes the data and these points are filtered out. p - Ten explicitly named modules can be traced; with an additional limitation imposed in this particular embodiment by the number of address range comparators. However, if the modules are not adjacent, only four can be traced (there are only four range resources). If all the modules in a file are specified, up to 255 different modules can be traced.
- The trace data flow measurement tracks the values data at the entry and exit points of a procedure. Both static and dynamic variables can be traced. However, local variables and variables passed by value cannot be displayed at the exit point of the procedure, for at this point they are undefined. Unlimited recursion can also be traced. Up to three different modules can be traced in one. measur-ement, with up to 10 symbols specified. Since the traced data is not accessible on the emulation bus at entry and exit points of a module, this measurement must be run in non-real-time.
- Data can be viewed at entry and exit of a procedure, showing whether it was modified within the module. Values of important variables can be seen at each level of a recursive procedure; this is especially useful if a procedure is stuck in infinite recursion. The variable which should cause an exit condition can be traced and the bug quickly found.
- Figure 8 shows how the analyzer's resources are used in a trace data flow measurement. As explained earlier, this measurement can only run non-real time because the analyzer needs information that is not flowing over the
emulation bus 12. Threeaddress recognition comparators 15 configured as equate comparators are used for each module, limiting the number of modules that can be specified to three. For each module,microprocessor 39 sets up one equate comparator for the entry, one for the exit, and a third comparator to recognize an address at the end of user code, just before the address of the module exit. - Three equate comparators are needed for each module being traced to accommodate recursive routines. By having an equate comparator set up to look for an address that occurs within the module, but before the exit and preferably at the end of the user code, any calls would have to have occurred previously.
- When one of the equate comparators is satisfied, the dedicated function generator halts the analyzer and the values of specified variables are read from emulation or user memory. Then the analyzer and emulator are restarted.
- The only limit imposed on the number of variables specified is the 10 symbol limit on entering the measurement. Of course, variables that are not scoped at module entry or exit cannot be traced.
- The trace statements measurement traces statement flow within a single module. The statements are displayed in the order of their execution and variable values are displayed. The measurement can run in both real-time and non-real-time. The statement range, which can be unlimited, can be defined as the entire procedure or a line range within a procedure. There is also a "don't care" specification, that traces everything occurring on the emulation bus; it can trace statements in different modules. The advantage to running in non-real-time is that dynamic variables can be traced. Otherwise, only the values of static variables will show up on the display; using "don't care" no variable values will be displayed. Again, time tags are displayed showing an accurate execution time for each high-level statement.
- This measurement is useful when a problem has been isolated down to a module. The display gives a step-by-step view of the execution order of the high-level statements, much like a state display of low-level code. The debugging process can be greatly sped up, as all the relevant information concerning the execution of a module is displayed. This is a highly effective way to observe the interaction between program and data flow.
- Trace statements can be divided into two measurements, a real-time one and a non-real-time one. The real-time one is less complex conceptually because the emulator is never halted, and all the stored information is flowing over
emulation bus 12. Figure 9 illustrates an example of how the analyzer's resources are used in making a real-time trace statements measurement over a line range or procedure.Microprocessor 39 sets up oneaddress recognition comparator 15 configured as a range comparator to detect activity in the specified line range to determine when a storing "window" should be opened. The special address recognition comparator which is set up to detect an opcode fetch is used to signal the execution of code. The highlevel resource generator 19 is set up so that these two signals are ANDed together and when they go true a "window" is opened and all the data flowing over the emulation bus is stored in acqusition memory. When theaddress range comparator 15 signals that the program is executing code outside of the specified line range, then the storing "window" is closed. A trace statements measurement using the "don't care" specification is simply the analyzer executing with the window continuously open. - The non-real-time trace statements measurement is more complex because more information is gathered, including information about dynamic variables. As in the real-time measurement one
address recognition comparator 15 is programmed to detect the range of statements traced and one address recognition comparator is used to detect an opcode fetch to create a mesurement "window". In addition, two address recognition comparators are set up to recognize the entry and exit points. Upon entry or exit, the analyzer halts the emulator using thededicated function generator 25 and stores data concerning the location and value of dynamic variables. - The trace variables measurement allows the user to trace all acccesses to specified variables during program execution. The measurement can run both in real-time and non-real-time; the feature set for both modes is identical. Up to ten variables can be traced in each measurement, but, during execution the
address recognition comparators 15 are used, so sometimes the number of static variables that can be traced is reduced. Up to ten of dynamic vairables under.a given module header can be traced. Source line numbers are displayed, convenient for localized debugging. A variable which is seen to have an incorrect value in a trace data flow measurement can thereafter be traced using the trace variables measurement, and all the reads and writes to it will be displayed. It is then a simple matter to determine where the program went astray. - Trace variables works the same way in real time as in non-real time, as illustrated in Figure 10. Static variables are comparatively easy to trace. Address recognition comparators 15 configured as equate comparators are used for static variables that are a byte wide, and address comparators configured as range comparators are used on longer variables, records and arrays. The analyzer will also use one address range comparator over any adjacent variables. If the range is accessed the analyzer's recognition logic circuits, through
dedicated function generator 25 cause the address and values to be stored inacquisition memory 35. - Dynamic variables are traced in a similar way. However, since the number of dynamic recognition comparators is less; one dynamic comparator is used to cover all variables even if they are not adjacent. During postprocessing, unwanted accesses are filtered out by
microprocessor 39. The difficulty in tracing dynamic variables is locating the stack reference, and the actual memory locations for these dynamic variables, since these are not defined until the program is executing. -
Microprocessor 39 sets up one dynamic equatecomparator 13a to locate the entry of the procedure where the dynamic variables of interest are defined. As described earlier, the first data write after a module entry point is the dynamic variable stack reference, which is stored by the fastsequence function generator 31. Using this stack reference, and the offsets for dynamic variables whichmicroprocessor 39 provided from the compiler data base,fast sequence generator 31 determines the locations range of the dynamic variables and loads these addresses into the other dynamicrecognition range comparator 13c. This is done before any of these variables have been read or written to by the user program. Then thedynamic recognition comparator 13b, which was used to recognize the first data write, is re-loaded to recognize the location on the stack of the procedure's return address. Fastsequence function generator 31, throughdedicated function generator 25, causes all accesses to the range stored in the second comparator to be stored inacquisition memory 35 until equatecomparator 13b indicates that the return address has been read. After this the variables no longer exist and the sequence is started up again. - Up to four modules can be timed using the time modules measurement, which displays the minimum, maximum, and mean time spent in each module. The measured time includes all time between entry of the specified module and exit from that module, including time spent in subroutine calls and interrupts. Timing recursive modules is handled by the analyzer, up to 255 levels deep. The measurement can be run in both real-time and non-real-time.
- This measurement is useful in a variety of cases. Modules can be tested to see if.they are executing within specified times. Inefficient modules can be spotted and then optimized. Also, the effect that interrupts have on modules can be studied. The display also shows the number of times the module was timed, which gives an indication of the statistical accuracy of the measurement.
- Figure 11 illustrates how the analyzer's resources are used to make the time modules measurement. Two
address recognition comparators 15 configured as equate comparators are used for each module, thus a limit of four modules can be traced. These equate comparators are set up bymicroprocessor 39 to look for entry and exit points of each module. When an entry or exit is detected, the analyzer's logic recognition circuits, throughdedicated function generator 25 cause the state to be stored inacquisition memory 35.Dedicated function generator 25 also starts the floatingpoint counter 33 at the beginning of the measurement, and the absolute time for every exit and entry point is stored inacquisition.memory 35 as a time tag with the stored state. When the measurement is complete,microprocessor 39 uses these time tags to determine the time spent in each module, and then determine the statistical results. - The count statements measurement counts the number of times each statement in a specified module or line range is executed. Up to 255 statements can be counted, but they all must be in one module. The counters will count up to 4094 then overflow; however, if only one line is traced, the analyzer uses the floating
point counter 33 which has a much larger 20-bit floating point capacity. - This measurement's main benefit is in the area of software coverage testing. In the testing phase of software development it is often difficult to know whether all parts of the software have been exercised. For example a certain branch may never be taken or some parts of a case statement may never be executed. Count statements is a quick and simple way to verify this coverage testing. If a statement.is never executed, either another test can be run to exercise it, or it can be removed. Also, count statements is an easy way to verify the operation of loop counters, as the statements within the loop should be executed a known number of times.
- The count statements measurement uses the same address recognition comparators used in the other measurements, but also uses some dedicated hardware, the
count mapper 43 andline counter 45. The analyzer can trace 255 lines in one module, but this traced part of the program cannot exceed 4k bytes of memory because thecount mapper 43 is a 4k to 256 "bucket" mapper. The "bucket" refers to the 12-bit values inline counter 45 associated with each source line. The measurement works by setting up theaddress range comparator 15 for recognition over the specified module/line range to drive the count enable signal. Before the measurement is executed,microprocessor 39 loads countmapper 43, using the line number information found in the compiler database file. When the measurement is executed, the appropriate counter or "bucket" is incremented when the first machine code statement corresponding to a given line number is executed. Thus a line that contains many machine instructions (they could even loop and execute a number of times) is only incremented once.
Claims (2)
Applications Claiming Priority (2)
| Application Number | Priority Date | Filing Date | Title |
|---|---|---|---|
| US06/699,781 US4720778A (en) | 1985-01-31 | 1985-01-31 | Software debugging analyzer |
| US699781 | 1985-01-31 |
Publications (3)
| Publication Number | Publication Date |
|---|---|
| EP0189848A2 true EP0189848A2 (en) | 1986-08-06 |
| EP0189848A3 EP0189848A3 (en) | 1988-10-19 |
| EP0189848B1 EP0189848B1 (en) | 1993-03-03 |
Family
ID=24810890
Family Applications (1)
| Application Number | Title | Priority Date | Filing Date |
|---|---|---|---|
| EP86100895A Expired - Lifetime EP0189848B1 (en) | 1985-01-31 | 1986-01-23 | Method and apparatus for software debugging |
Country Status (5)
| Country | Link |
|---|---|
| US (1) | US4720778A (en) |
| EP (1) | EP0189848B1 (en) |
| JP (1) | JPH0833845B2 (en) |
| DE (1) | DE3687842T2 (en) |
| HK (1) | HK144594A (en) |
Cited By (6)
| Publication number | Priority date | Publication date | Assignee | Title |
|---|---|---|---|---|
| EP0271910A2 (en) * | 1986-12-19 | 1988-06-22 | Hitachi, Ltd. | One-chip microprocessor |
| EP0286988A2 (en) * | 1987-04-14 | 1988-10-19 | Hughes Aircraft Company | Method and apparatus for testing missile systems |
| EP0455946A2 (en) * | 1990-05-07 | 1991-11-13 | International Business Machines Corporation | System for debugging shared memory multiprocessor computers |
| EP0645705A1 (en) * | 1993-09-29 | 1995-03-29 | Philips Electronics Uk Limited | Testing and monitoring of programmed devices |
| EP0683455A1 (en) * | 1994-05-20 | 1995-11-22 | STMicroelectronics S.A. | Microcomputer with integrated breakpoint circuit triggered by combined events |
| FR2721725A1 (en) * | 1994-06-23 | 1995-12-29 | Matra Marconi Space France | Test module to analyse execution of program by microprocessor card |
Families Citing this family (76)
| Publication number | Priority date | Publication date | Assignee | Title |
|---|---|---|---|---|
| NL8602849A (en) * | 1986-11-11 | 1988-06-01 | Philips Nv | DEVICE FOR EMULSING A MICROCONTROLLER, USING A MOTHER MICROCONTROLLER AND A DAUGHTER MICROCONTROLLER, REPRODUCING A DAUGHTER MICROCONTROLLER FOR USE IN SUCH A DEVICE, INTEGRATED USER, INTEGRATED. |
| US5025364A (en) * | 1987-06-29 | 1991-06-18 | Hewlett-Packard Company | Microprocessor emulation system with memory mapping using variable definition and addressing of memory space |
| US5127103A (en) * | 1987-10-14 | 1992-06-30 | North American Philips Corporation | Real-time tracing of dynamic local data in high level languages in the presence of process context switches |
| US5050068A (en) * | 1988-10-03 | 1991-09-17 | Duke University | Method and apparatus for using extracted program flow information to prepare for execution multiple instruction streams |
| DE3909775A1 (en) * | 1989-03-21 | 1990-09-27 | Siemens Ag | METHOD FOR EXAMINING A DIGITAL DATA STREAM |
| US5325531A (en) * | 1989-06-30 | 1994-06-28 | Digital Equipment Corporation | Compiler using clean lines table with entries indicating unchanged text lines for incrementally compiling only changed source text lines |
| US5201050A (en) * | 1989-06-30 | 1993-04-06 | Digital Equipment Corporation | Line-skip compiler for source-code development system |
| US5465258A (en) * | 1989-11-13 | 1995-11-07 | Integrity Systems, Inc. | Binary image performance evaluation tool |
| JP3169597B2 (en) * | 1990-05-16 | 2001-05-28 | エヌイーシーソフト株式会社 | Multitask execution time accounting method and its mechanism |
| JPH04148242A (en) * | 1990-10-08 | 1992-05-21 | Fujitsu Ltd | Trace processing method for load module execution |
| CA2105055C (en) * | 1993-01-05 | 1998-06-16 | Jeffrey Scott Boston | Window restoration methods for halted debuggee window applications |
| AU682869B2 (en) * | 1993-05-10 | 1997-10-23 | Thinking Software, Inc | Method for minimizing uncertainty in computer software processes allowing for automatic identification of faults locations and locations for modifications due to new system requirements with introduction of an alternative form of the target process object code allowing for less recompilation and re-linkage processing |
| AU1994695A (en) * | 1994-03-14 | 1995-10-03 | Green Hills Software, Inc. | Optimizing time and testing of higher level language programs |
| US5649085A (en) * | 1994-12-09 | 1997-07-15 | International Business Machines Corporation | Method and system for storing and displaying system operation traces with asynchronous event-pairs |
| US5748878A (en) * | 1995-09-11 | 1998-05-05 | Applied Microsystems, Inc. | Method and apparatus for analyzing software executed in embedded systems |
| US5812850A (en) * | 1995-11-13 | 1998-09-22 | Object Technology Licensing Corp. | Object-oriented symbolic debugger using a compiler driven database and state modeling to control program execution |
| US7266725B2 (en) * | 2001-09-03 | 2007-09-04 | Pact Xpp Technologies Ag | Method for debugging reconfigurable architectures |
| US5732210A (en) * | 1996-03-15 | 1998-03-24 | Hewlett-Packard Company | Use of dynamic translation to provide fast debug event checks |
| US5764883A (en) * | 1996-03-28 | 1998-06-09 | Hewlett-Packard Co. | System and method for checking for dynamic resource misuse in a computer program |
| US6052530A (en) * | 1996-10-09 | 2000-04-18 | Hewlett-Packard Co. | Dynamic translation system and method for optimally translating computer code |
| US5946472A (en) * | 1996-10-31 | 1999-08-31 | International Business Machines Corporation | Apparatus and method for performing behavioral modeling in hardware emulation and simulation environments |
| DE19651075A1 (en) * | 1996-12-09 | 1998-06-10 | Pact Inf Tech Gmbh | Unit for processing numerical and logical operations, for use in processors (CPU's), multi-computer systems, data flow processors (DFP's), digital signal processors (DSP's) or the like |
| DE19654595A1 (en) * | 1996-12-20 | 1998-07-02 | Pact Inf Tech Gmbh | I0 and memory bus system for DFPs as well as building blocks with two- or multi-dimensional programmable cell structures |
| DE19654846A1 (en) * | 1996-12-27 | 1998-07-09 | Pact Inf Tech Gmbh | Process for the independent dynamic reloading of data flow processors (DFPs) as well as modules with two- or multi-dimensional programmable cell structures (FPGAs, DPGAs, etc.) |
| EP1329816B1 (en) * | 1996-12-27 | 2011-06-22 | Richter, Thomas | Method for automatic dynamic unloading of data flow processors (dfp) as well as modules with bidimensional or multidimensional programmable cell structures (fpgas, dpgas or the like) |
| US6542998B1 (en) | 1997-02-08 | 2003-04-01 | Pact Gmbh | Method of self-synchronization of configurable elements of a programmable module |
| US8686549B2 (en) | 2001-09-03 | 2014-04-01 | Martin Vorbach | Reconfigurable elements |
| DE19861088A1 (en) * | 1997-12-22 | 2000-02-10 | Pact Inf Tech Gmbh | Repairing integrated circuits by replacing subassemblies with substitutes |
| US6044335A (en) * | 1997-12-23 | 2000-03-28 | At&T Corp. | Productivity metrics for application software systems |
| US6106571A (en) * | 1998-01-29 | 2000-08-22 | Applied Microsystems Corporation | Relocatable instrumentation tags for testing and debugging a computer program |
| US6658486B2 (en) | 1998-02-25 | 2003-12-02 | Hewlett-Packard Development Company, L.P. | System and method for efficiently blocking event signals associated with an operating system |
| JP2003505753A (en) | 1999-06-10 | 2003-02-12 | ペーアーツェーテー インフォルマツィオーンステヒノロギー ゲゼルシャフト ミット ベシュレンクテル ハフツング | Sequence division method in cell structure |
| DE69900405T2 (en) * | 1999-08-06 | 2002-05-16 | Agilent Technologies Inc | Dynamic event detection |
| JP2001195281A (en) * | 2000-01-07 | 2001-07-19 | Sony Corp | System monitoring device |
| US7100152B1 (en) * | 2000-01-31 | 2006-08-29 | Freescale Semiconductor, Inc. | Software analysis system having an apparatus for selectively collecting analysis data from a target system executing software instrumented with tag statements and method for use thereof |
| DE50115584D1 (en) * | 2000-06-13 | 2010-09-16 | Krass Maren | PIPELINE CT PROTOCOLS AND COMMUNICATION |
| US8058899B2 (en) | 2000-10-06 | 2011-11-15 | Martin Vorbach | Logic cell array and bus system |
| US20070299993A1 (en) * | 2001-03-05 | 2007-12-27 | Pact Xpp Technologies Ag | Method and Device for Treating and Processing Data |
| US7844796B2 (en) * | 2001-03-05 | 2010-11-30 | Martin Vorbach | Data processing device and method |
| US9037807B2 (en) * | 2001-03-05 | 2015-05-19 | Pact Xpp Technologies Ag | Processor arrangement on a chip including data processing, memory, and interface elements |
| US20090210653A1 (en) * | 2001-03-05 | 2009-08-20 | Pact Xpp Technologies Ag | Method and device for treating and processing data |
| US7444531B2 (en) * | 2001-03-05 | 2008-10-28 | Pact Xpp Technologies Ag | Methods and devices for treating and processing data |
| US20090300262A1 (en) * | 2001-03-05 | 2009-12-03 | Martin Vorbach | Methods and devices for treating and/or processing data |
| AU2002347560A1 (en) * | 2001-06-20 | 2003-01-02 | Pact Xpp Technologies Ag | Data processing method |
| US7996827B2 (en) * | 2001-08-16 | 2011-08-09 | Martin Vorbach | Method for the translation of programs for reconfigurable architectures |
| US7434191B2 (en) * | 2001-09-03 | 2008-10-07 | Pact Xpp Technologies Ag | Router |
| US8686475B2 (en) | 2001-09-19 | 2014-04-01 | Pact Xpp Technologies Ag | Reconfigurable elements |
| US7577822B2 (en) * | 2001-12-14 | 2009-08-18 | Pact Xpp Technologies Ag | Parallel task operation in processor and reconfigurable coprocessor configured based on information in link list including termination information for synchronization |
| AU2003214046A1 (en) * | 2002-01-18 | 2003-09-09 | Pact Xpp Technologies Ag | Method and device for partitioning large computer programs |
| WO2003060747A2 (en) * | 2002-01-19 | 2003-07-24 | Pact Xpp Technologies Ag | Reconfigurable processor |
| AU2003214003A1 (en) | 2002-02-18 | 2003-09-09 | Pact Xpp Technologies Ag | Bus systems and method for reconfiguration |
| US8914590B2 (en) * | 2002-08-07 | 2014-12-16 | Pact Xpp Technologies Ag | Data processing method and device |
| WO2003081454A2 (en) * | 2002-03-21 | 2003-10-02 | Pact Xpp Technologies Ag | Method and device for data processing |
| AU2003286131A1 (en) * | 2002-08-07 | 2004-03-19 | Pact Xpp Technologies Ag | Method and device for processing data |
| US7657861B2 (en) * | 2002-08-07 | 2010-02-02 | Pact Xpp Technologies Ag | Method and device for processing data |
| US20110238948A1 (en) * | 2002-08-07 | 2011-09-29 | Martin Vorbach | Method and device for coupling a data processing unit and a data processing array |
| WO2005010632A2 (en) * | 2003-06-17 | 2005-02-03 | Pact Xpp Technologies Ag | Data processing device and method |
| EP1537486A1 (en) | 2002-09-06 | 2005-06-08 | PACT XPP Technologies AG | Reconfigurable sequencer structure |
| US8386852B2 (en) * | 2002-11-05 | 2013-02-26 | Hewlett-Packard Development Company, L.P. | Automated recording and replaying of software regression tests |
| DE112004000026D2 (en) * | 2003-04-04 | 2006-06-14 | Pact Xpp Technologies Ag | Method and device for data processing |
| WO2006082091A2 (en) * | 2005-02-07 | 2006-08-10 | Pact Xpp Technologies Ag | Low latency massive parallel data processing device |
| EP1676208A2 (en) * | 2003-08-28 | 2006-07-05 | PACT XPP Technologies AG | Data processing device and method |
| US7222034B2 (en) * | 2003-09-19 | 2007-05-22 | Tektronix, Inc. | In-circuit measurement of saturation flux density Bsat, coercivity Hc, and permiability of magnetic components using a digital storage oscilloscope |
| US20050144588A1 (en) * | 2003-12-30 | 2005-06-30 | Intel Corporation | System and method for embedded processor firmware development |
| JP4494899B2 (en) * | 2004-07-29 | 2010-06-30 | 富士通株式会社 | Processor debugging apparatus and processor debugging method |
| DE502005001065D1 (en) * | 2005-05-02 | 2007-08-30 | Accemic Gmbh & Co Kg | Method and device for emulation of a programmable unit |
| US7281942B2 (en) * | 2005-11-18 | 2007-10-16 | Ideal Industries, Inc. | Releasable wire connector |
| EP1974265A1 (en) | 2006-01-18 | 2008-10-01 | PACT XPP Technologies AG | Hardware definition method |
| US7693257B2 (en) * | 2006-06-29 | 2010-04-06 | Accuray Incorporated | Treatment delivery optimization |
| US20090158258A1 (en) * | 2007-12-17 | 2009-06-18 | James Gregory E | Instrumentation information gathering system and method |
| US20090327809A1 (en) * | 2008-06-26 | 2009-12-31 | Microsoft Corporation | Domain-specific guidance service for software development |
| US20100272811A1 (en) * | 2008-07-23 | 2010-10-28 | Alkermes,Inc. | Complex of trospium and pharmaceutical compositions thereof |
| JP2010244393A (en) * | 2009-04-08 | 2010-10-28 | Renesas Electronics Corp | Device and method for evaluating performance |
| US8990779B2 (en) * | 2009-08-11 | 2015-03-24 | Sap Se | Response time measurement system and method |
| JP5901668B2 (en) * | 2013-02-28 | 2016-04-13 | タタ コンサルタンシー サービシズ リミテッドTATA Consultancy Services Limited | System and method for grouping warnings generated during static analysis |
| US9594669B2 (en) * | 2015-04-30 | 2017-03-14 | International Business Machines Corporation | Debug management using a counter |
Citations (2)
| Publication number | Priority date | Publication date | Assignee | Title |
|---|---|---|---|---|
| US4338660A (en) | 1979-04-13 | 1982-07-06 | Relational Memory Systems, Inc. | Relational break signal generating device |
| EP0084431A2 (en) | 1982-01-15 | 1983-07-27 | Honeywell Information Systems Inc. | Monitoring computer systems |
Family Cites Families (5)
| Publication number | Priority date | Publication date | Assignee | Title |
|---|---|---|---|---|
| US4511960A (en) * | 1982-01-15 | 1985-04-16 | Honeywell Information Systems Inc. | Data processing system auto address development logic for multiword fetch |
| JPS59183443A (en) * | 1983-04-01 | 1984-10-18 | Omron Tateisi Electronics Co | Debug device |
| JPS59221753A (en) * | 1983-06-01 | 1984-12-13 | Hitachi Ltd | Subroutine tracer |
| JPS603031A (en) * | 1983-06-17 | 1985-01-09 | Fuji Electric Co Ltd | Information processor |
| US4631701A (en) * | 1983-10-31 | 1986-12-23 | Ncr Corporation | Dynamic random access memory refresh control system |
-
1985
- 1985-01-31 US US06/699,781 patent/US4720778A/en not_active Expired - Lifetime
-
1986
- 1986-01-23 EP EP86100895A patent/EP0189848B1/en not_active Expired - Lifetime
- 1986-01-23 DE DE86100895T patent/DE3687842T2/en not_active Expired - Fee Related
- 1986-01-31 JP JP61020434A patent/JPH0833845B2/en not_active Expired - Lifetime
-
1994
- 1994-12-22 HK HK144594A patent/HK144594A/en not_active IP Right Cessation
Patent Citations (2)
| Publication number | Priority date | Publication date | Assignee | Title |
|---|---|---|---|---|
| US4338660A (en) | 1979-04-13 | 1982-07-06 | Relational Memory Systems, Inc. | Relational break signal generating device |
| EP0084431A2 (en) | 1982-01-15 | 1983-07-27 | Honeywell Information Systems Inc. | Monitoring computer systems |
Cited By (12)
| Publication number | Priority date | Publication date | Assignee | Title |
|---|---|---|---|---|
| EP0271910A2 (en) * | 1986-12-19 | 1988-06-22 | Hitachi, Ltd. | One-chip microprocessor |
| EP0271910A3 (en) * | 1986-12-19 | 1989-10-25 | Hitachi, Ltd. | One-chip microprocessor |
| EP0286988A2 (en) * | 1987-04-14 | 1988-10-19 | Hughes Aircraft Company | Method and apparatus for testing missile systems |
| EP0286988A3 (en) * | 1987-04-14 | 1990-08-22 | Hughes Aircraft Company | Method and apparatus for testing missile systems |
| EP0455946A2 (en) * | 1990-05-07 | 1991-11-13 | International Business Machines Corporation | System for debugging shared memory multiprocessor computers |
| EP0455946A3 (en) * | 1990-05-07 | 1992-10-28 | International Business Machines Corporation | System for debugging shared memory multiprocessor computers |
| EP0645705A1 (en) * | 1993-09-29 | 1995-03-29 | Philips Electronics Uk Limited | Testing and monitoring of programmed devices |
| US5754759A (en) * | 1993-09-29 | 1998-05-19 | U.S. Philips Corporation | Testing and monitoring of programmed devices |
| EP0683455A1 (en) * | 1994-05-20 | 1995-11-22 | STMicroelectronics S.A. | Microcomputer with integrated breakpoint circuit triggered by combined events |
| FR2720173A1 (en) * | 1994-05-20 | 1995-11-24 | Sgs Thomson Microelectronics | An integrated circuit comprising means for stopping the execution of an instruction program when a combination of breakpoints is verified. |
| US5819023A (en) * | 1994-05-20 | 1998-10-06 | Sgs-Thomson Microelectronics, S.A. | Integrated circuit comprising means to halt the performance of a program of instructions when a combination of breakpoints is verified |
| FR2721725A1 (en) * | 1994-06-23 | 1995-12-29 | Matra Marconi Space France | Test module to analyse execution of program by microprocessor card |
Also Published As
| Publication number | Publication date |
|---|---|
| EP0189848B1 (en) | 1993-03-03 |
| DE3687842T2 (en) | 1993-10-14 |
| US4720778A (en) | 1988-01-19 |
| JPS61204749A (en) | 1986-09-10 |
| DE3687842D1 (en) | 1993-04-08 |
| HK144594A (en) | 1994-12-30 |
| JPH0833845B2 (en) | 1996-03-29 |
| EP0189848A3 (en) | 1988-10-19 |
Similar Documents
| Publication | Publication Date | Title |
|---|---|---|
| EP0189848B1 (en) | Method and apparatus for software debugging | |
| US4845615A (en) | Software performance analyzer | |
| US5265254A (en) | System of debugging software through use of code markers inserted into spaces in the source code during and after compilation | |
| US5103394A (en) | Software performance analyzer | |
| EP0567722B1 (en) | System for analyzing and debugging embedded software through dynamic and interactive use of code markers | |
| EP1130518B1 (en) | Software analysis system having an apparatus for selectively collecting analysis data from a target system executing software instrumented with tag statements and method for use thereof | |
| US7302675B2 (en) | System and method for analyzing a graphical program using debugging graphical programs | |
| Harrold et al. | An approach to analyzing and testing component-based systems | |
| US6247146B1 (en) | Method for verifying branch trace history buffer information | |
| US6173395B1 (en) | Mechanism to determine actual code execution flow in a computer | |
| CN112597006B (en) | Automatic execution system and method for embedded software integrated test | |
| US6618853B1 (en) | Program production system for semiconductor tester | |
| US8214701B1 (en) | Hardware and software debugging | |
| CN100456248C (en) | Simulation device for obtaining applied programe code execution-ratio and method therefor | |
| CN113157508B (en) | Test method, system, device, equipment and storage medium of embedded system | |
| Lutz et al. | Testing tools (software) | |
| Fryer | The memory bus monitor: a new device for developing real-time systems | |
| Faisal et al. | Awareness Implementation of a Real Time Operating Systems (RTOS) for Debugging | |
| Cunha et al. | On the use of boundary scan for code coverage of critical embedded software | |
| Randle et al. | Microprocessors in instrumentation | |
| Lee | Microprocessor analysers in the development and support of microprocessor-based systems | |
| Callaghan et al. | SAS—an experimental tool for dynamic program structure acquisition and analysis | |
| CN117787155A (en) | Chip testability code dynamic simulation test system and test method | |
| Morton | New Laboratory Tools and Techniques for Embedded Microcontrollers | |
| Grätsch et al. | Firmware monitoring—History and perspective |
Legal Events
| Date | Code | Title | Description |
|---|---|---|---|
| PUAI | Public reference made under article 153(3) epc to a published international application that has entered the european phase |
Free format text: ORIGINAL CODE: 0009012 |
|
| AK | Designated contracting states |
Kind code of ref document: A2 Designated state(s): DE FR GB |
|
| PUAL | Search report despatched |
Free format text: ORIGINAL CODE: 0009013 |
|
| AK | Designated contracting states |
Kind code of ref document: A3 Designated state(s): DE FR GB |
|
| 17P | Request for examination filed |
Effective date: 19881117 |
|
| 17Q | First examination report despatched |
Effective date: 19900626 |
|
| GRAA | (expected) grant |
Free format text: ORIGINAL CODE: 0009210 |
|
| AK | Designated contracting states |
Kind code of ref document: B1 Designated state(s): DE FR GB |
|
| REF | Corresponds to: |
Ref document number: 3687842 Country of ref document: DE Date of ref document: 19930408 |
|
| ET | Fr: translation filed | ||
| PLBE | No opposition filed within time limit |
Free format text: ORIGINAL CODE: 0009261 |
|
| STAA | Information on the status of an ep patent application or granted ep patent |
Free format text: STATUS: NO OPPOSITION FILED WITHIN TIME LIMIT |
|
| 26N | No opposition filed | ||
| PGFP | Annual fee paid to national office [announced via postgrant information from national office to epo] |
Ref country code: DE Payment date: 19991213 Year of fee payment: 15 |
|
| REG | Reference to a national code |
Ref country code: GB Ref legal event code: 732E |
|
| REG | Reference to a national code |
Ref country code: GB Ref legal event code: 732E |
|
| REG | Reference to a national code |
Ref country code: FR Ref legal event code: TP |
|
| PG25 | Lapsed in a contracting state [announced via postgrant information from national office to epo] |
Ref country code: DE Free format text: LAPSE BECAUSE OF NON-PAYMENT OF DUE FEES Effective date: 20011101 |
|
| REG | Reference to a national code |
Ref country code: FR Ref legal event code: TP |
|
| REG | Reference to a national code |
Ref country code: GB Ref legal event code: IF02 |
|
| PGFP | Annual fee paid to national office [announced via postgrant information from national office to epo] |
Ref country code: FR Payment date: 20020103 Year of fee payment: 17 |
|
| PGFP | Annual fee paid to national office [announced via postgrant information from national office to epo] |
Ref country code: GB Payment date: 20020104 Year of fee payment: 17 |
|
| PG25 | Lapsed in a contracting state [announced via postgrant information from national office to epo] |
Ref country code: GB Free format text: LAPSE BECAUSE OF NON-PAYMENT OF DUE FEES Effective date: 20030123 |
|
| GBPC | Gb: european patent ceased through non-payment of renewal fee | ||
| PG25 | Lapsed in a contracting state [announced via postgrant information from national office to epo] |
Ref country code: FR Free format text: LAPSE BECAUSE OF NON-PAYMENT OF DUE FEES Effective date: 20030930 |
|
| REG | Reference to a national code |
Ref country code: FR Ref legal event code: ST |