EP0184600B1 - Method for optically ascertaining parameters of species in a liquid analyte - Google Patents
Method for optically ascertaining parameters of species in a liquid analyte Download PDFInfo
- Publication number
- EP0184600B1 EP0184600B1 EP84810600A EP84810600A EP0184600B1 EP 0184600 B1 EP0184600 B1 EP 0184600B1 EP 84810600 A EP84810600 A EP 84810600A EP 84810600 A EP84810600 A EP 84810600A EP 0184600 B1 EP0184600 B1 EP 0184600B1
- Authority
- EP
- European Patent Office
- Prior art keywords
- waveguide
- species
- light
- hemoglobin
- analyte
- Prior art date
- Legal status (The legal status is an assumption and is not a legal conclusion. Google has not performed a legal analysis and makes no representation as to the accuracy of the status listed.)
- Expired - Lifetime
Links
Images


Classifications
-
- G—PHYSICS
- G01—MEASURING; TESTING
- G01N—INVESTIGATING OR ANALYSING MATERIALS BY DETERMINING THEIR CHEMICAL OR PHYSICAL PROPERTIES
- G01N21/00—Investigating or analysing materials by the use of optical means, i.e. using sub-millimetre waves, infrared, visible or ultraviolet light
- G01N21/62—Systems in which the material investigated is excited whereby it emits light or causes a change in wavelength of the incident light
- G01N21/63—Systems in which the material investigated is excited whereby it emits light or causes a change in wavelength of the incident light optically excited
- G01N21/64—Fluorescence; Phosphorescence
- G01N21/645—Specially adapted constructive features of fluorimeters
- G01N21/648—Specially adapted constructive features of fluorimeters using evanescent coupling or surface plasmon coupling for the excitation of fluorescence
-
- G—PHYSICS
- G01—MEASURING; TESTING
- G01N—INVESTIGATING OR ANALYSING MATERIALS BY DETERMINING THEIR CHEMICAL OR PHYSICAL PROPERTIES
- G01N21/00—Investigating or analysing materials by the use of optical means, i.e. using sub-millimetre waves, infrared, visible or ultraviolet light
- G01N21/75—Systems in which material is subjected to a chemical reaction, the progress or the result of the reaction being investigated
- G01N21/77—Systems in which material is subjected to a chemical reaction, the progress or the result of the reaction being investigated by observing the effect on a chemical indicator
- G01N21/7703—Systems in which material is subjected to a chemical reaction, the progress or the result of the reaction being investigated by observing the effect on a chemical indicator using reagent-clad optical fibres or optical waveguides
-
- G—PHYSICS
- G01—MEASURING; TESTING
- G01N—INVESTIGATING OR ANALYSING MATERIALS BY DETERMINING THEIR CHEMICAL OR PHYSICAL PROPERTIES
- G01N33/00—Investigating or analysing materials by specific methods not covered by groups G01N1/00 - G01N31/00
- G01N33/48—Biological material, e.g. blood, urine; Haemocytometers
- G01N33/50—Chemical analysis of biological material, e.g. blood, urine; Testing involving biospecific ligand binding methods; Immunological testing
- G01N33/53—Immunoassay; Biospecific binding assay; Materials therefor
- G01N33/543—Immunoassay; Biospecific binding assay; Materials therefor with an insoluble carrier for immobilising immunochemicals
- G01N33/54366—Apparatus specially adapted for solid-phase testing
- G01N33/54373—Apparatus specially adapted for solid-phase testing involving physiochemical end-point determination, e.g. wave-guides, FETS, gratings
-
- Y—GENERAL TAGGING OF NEW TECHNOLOGICAL DEVELOPMENTS; GENERAL TAGGING OF CROSS-SECTIONAL TECHNOLOGIES SPANNING OVER SEVERAL SECTIONS OF THE IPC; TECHNICAL SUBJECTS COVERED BY FORMER USPC CROSS-REFERENCE ART COLLECTIONS [XRACs] AND DIGESTS
- Y10—TECHNICAL SUBJECTS COVERED BY FORMER USPC
- Y10S—TECHNICAL SUBJECTS COVERED BY FORMER USPC CROSS-REFERENCE ART COLLECTIONS [XRACs] AND DIGESTS
- Y10S436/00—Chemistry: analytical and immunological testing
- Y10S436/805—Optical property
Landscapes
- Health & Medical Sciences (AREA)
- Immunology (AREA)
- Life Sciences & Earth Sciences (AREA)
- Chemical & Material Sciences (AREA)
- Engineering & Computer Science (AREA)
- Physics & Mathematics (AREA)
- Analytical Chemistry (AREA)
- General Health & Medical Sciences (AREA)
- General Physics & Mathematics (AREA)
- Pathology (AREA)
- Biochemistry (AREA)
- Hematology (AREA)
- Urology & Nephrology (AREA)
- Molecular Biology (AREA)
- Biomedical Technology (AREA)
- Chemical Kinetics & Catalysis (AREA)
- Cell Biology (AREA)
- Biotechnology (AREA)
- Microbiology (AREA)
- Plasma & Fusion (AREA)
- Nuclear Medicine, Radiotherapy & Molecular Imaging (AREA)
- Food Science & Technology (AREA)
- Medicinal Chemistry (AREA)
- Investigating, Analyzing Materials By Fluorescence Or Luminescence (AREA)
- Investigating Or Analysing Materials By Optical Means (AREA)
Description
- The present invention concerns a method for ascertaining at least one parameter of species in a liquid analyte, e.g. for determining one or more species dissolved therein.
- This method relates to the known techniques in which an optical waveguide carrying a totally reflected light signal is contacted with an analyte and the evanescent wave component of said signal interacts with the analyte at the solid-liquid interface in a manner responsive to some parameters inherent to the species therein. For instance, information on such parameters may concern an absorption of part of the luminous energy of the incident signal at the points of reflection thereof within the waveguide by the molecules of the species of interest at said interface or to an excitation of some fluorophores by said luminous energy with the consecutive production of a fluorescence signal characteristic of such species. In general, the interaction is limited to the region corresponding to the depth of penetration into the analyte of the evanescent wave component of the incident light, this depth ranging from a few angstroms to some hundreds of angstroms starting from the waveguide surface.
- Although it is generally known that the aforementioned interaction may provide information on some parameters in the bulk solution (Hardy, USP 4,050,895), recently published work has shown that improved results (i.e. better sensitivity and accuracy) are obtained when the effective interaction of the evanescent wave component with the analyte (or rather, the leaking into the analyte of a substantial portion of the energy thereof) is limited to involve a single layer (generally monomolecular) of compounds of interst bound to the surface of the waveguide. In other words, one has recently found that a very useful new analytical technique can be based on attaching to the waveguide, before contacting it with the analyte to be investigated, a reactant specific to a species of said analyte and, thereafter, immersing it into said analyte; in these conditions, the species of interest will bind to the said reactant and provide at the surface of the waveguide a layer of a complex whose content of the species of interest (i.e. the actual density of said species in the area of interaction) will grow very rapidly with time and provide increased interaction with the light travelling in the waveguide and stronger response at the output thereof (Kronick and Little, USP 3,939,350).
- In such types of analysis involving the formation of a very thin layer of product of interest on the waveguide surface, the interaction of the light signal with the bulk of the solution is considered a nuisance (background noise) and attempts have been made to minimize it as much as possible. For instance, compromising condition between maximal interaction of the evanescent component with the monomolecular layer deposited on the waveguide surface and minimal interaction with the bulk solution can be achieved by controlling the depth of penetration of said evanescent component outside the material of the waveguide at the waveguide/analyte interface. Such control can be effected by selecting a waveguide with a suitable refractive index n1 relative to that n2 of the solution and by choosing adequately the angle of total reflection in the guide as well as the wavelength of the incident light (more detailed explanation on why this can be so and how to make such selections will be provided hereafter). For instance in co-pending application EP-A-75353, it has been disclosed that this depth of penetration can be optimized to match with the thickness of said layer of interest or to be in excess thereof.
- However, it has now been found that unexpectedly this approach is not always the most desirable; indeed, it has been found with surprise that, under some conditions, the penetration of the evanescent wave component distinctively beyond the distance corresponding to the thickness of the layer of interest can be extremely useful in concurrently providing analytical results on parameters of the analyte other than that specifically involved in said layer of interest, e.g. on species in solution in the analyte. Therefore, this discovery led to the definition of one aspect of a new analytical method outlined in
claim 1 given in annexe to this specification. Moreover, this method was also extended to further aspects after realizing that useful interactions of the light carried by the waveguide with the analyte may involve more than one specific area of the waveguide (i.e. the area where interaction takes place with either a single layer coating on this area or with the bulk solution or, simultaneously with both bulk and coating), i.e. may involve two or several distinctly different areas of said waveguide (see co-pending application EP-A-185126). For instance, in one area the interaction will take place with the bulk solution and in another or more optically separated areas the interaction will take place with one or several layers of interest. Annexedclaim 1 actually summarizes the complete scope of this method of the invention. - In the method of the invention, any type of interaction of the light contained in the waveguide with the analyte can be considered. Thus, this interaction can result from absorption of part of the signal, the output response being then a decrease in output energy gathered by the collecting and detecting means located at the outlet of the waveguide. Alternatively, the interaction may result in the production of fluorescence if the species of interest (whether located in the bulk analyte or in a coating of interest at the waveguide surface) can generate fluorescence under excitation by the incident signal. Such is the case for instance in fluorescence type assays where one of the partners in a complex under formation on the surface of the waveguide comprises a fluorophore group which induces fluorescence upon formation of said complex. Otherwise, useful responses can also result from the scattering of the incident light by molecular aggregates built on the surface of the illuminated waveguide.
- In order to practically carry out the method of the invention, one can for instance use a waveguide in the form of an optical fiber or a glass or plastic slide coated with a reagent specific to one first species dissolved in an analyte which additionally contains another or more species of interest. In an example to be developed in detail hereinafter, this first species can be a specific hemoglobin compound in a sample of blood also containing other hemoglobin or blood factors. Thus, in this case, the waveguide will carry, attached thereto, an antibody specific to that first species and, upon contacting the lit waveguide with .the blood sample and arranging the measurement conditions (as specified hereafter) for providing an effective and signal generating interaction of the light in the waveguide with, simultaneously, the bulk solution and a monomolecular layer of a complex involving the antibody and that first species that forms on the waveguide surface, a signal is provided at the outlet of the guide, this signal being representative concurrently or simultaneously of the total hemoglobin (or other blood factors) having interacted in bulk with the excitation signal and of said first species involved in the formation of the complex.
- In this case, the signal at the outlet of the waveguide is representative of two independent effects and can be decoded by simple means since the response to the bulk hemoglobin corresponds to an instantaneous partial extinction of the signal output collected from the waveguide end (this is actually the aforementioned background noise) while the response to the thin layer is a time dependent signal due to the formation of said complex layer of antibody and the first specific species to be determined which is a rate reaction.
- Otherwise, if two specific factors in the analyte (for
instance factor 1 andfactor 2 among others present) must be determined, a waveguide with two independently working optical areas is preferably selected, each area being provided with one reagent (antibody) specific to one of said factors to be determined (see EP-A-185126 cited as cross-reference). In such case, the two response signals collected at the output of the waveguide (this being so if the waveguide is not provided already with separate outputs) are either (a) phase dependent or (b) frequency dependent. - Case (a) may be illustrated by a waveguide provided with two independent optical elements such as the two oppositely facing parallel walls of an analytical cuvette, said walls being light conductive for a fully reflected signal and each internally coated with one of the two aforementioned reactants, each being specific to one of the two factors (
factor 1 and factor 2) to be determined in the analyte. In this case the two elements are illuminated in turn (alternatively applied pulses), the mode of application being also used for synchronization purposes at the detecting and processing end to ensure proper separation and independent display of the corresponding signals. - Case (b) may be illustrated by a waveguide structure comprising two physically separated areas on the same light path of the waveguide (i.e. not separated optically) but providing responses at two different waveguides (this can be implemented, for instance, by having one area responsive to absorption, e.g. at the excitation wavelength and another area providing a fluorescent response, i.e. a signal of a wavelength different from the excitation wavelength). In this case the detector unit is provided with means to separate the components of the output consisting of a signal with two wavelengths into individual signals by usual means (band-pass filters or dichroic beam splitters). Such a situation can result for instance from attaching to a first area of the waveguide a first reagent specific of factor No. 1 to be analyzed, the layer of reaction product being light absorbing, and attaching to a second area of the waveguide a second reagent specific of factor No. 2, the reaction product of said second reagent and factor No. 2 being fluorescent under excitation by the incident light.
- Of course case (b) can also be illustrated by a variant of the structure of case (a), i.e. with one of the separately illuminated waveguide element being responsive to absorption while the other is fluorescence responsive.
- The practical aspect of the invention will now be illustrated with reference to actual analysis cases. The first case refers to blood analysis and, more particularly, to the direct determination in blood samples of hemoglobin and various other hemoglobin factors such as glycosylated hemoglobin, this being, if desired, relative to total hemoglobin in this sample.
- Glycosylated hemoglobins (HbA,a, Alb and A1c) are important factors in the diagnosis and monitoring of patients with diabetes. The determination of the content of HbA,, (which amounts to about 80% of total glycosylated hemoglobins (HbAi)) relative to total hemoglobin (i.e. HbAo, non-glycosylated hemoglobin plus (HbA,)) is particularly important with regard to that disease.
- Hemoglobin A1c is a glycohemoglobin with an amino acid structure which is identical to that of HbAo; the important difference is the presence of 1 - amino - 1 - deoxy - fructose attached to the 2,3 - diphosphoglycerate pocket to the N-terminal valine in the beta-chain of Hb A1c. The modification of HbAo to HbA1c is a continuous non-enzymatic post-translational process, the rate of which is a function of the blood glucose concentration. Glycosylation occurs as a two step process. Firstly, the open aldehydic form of glucose reacts with the terminal amino group of the beta-chains of Hb to form a Schiff base. Secondly, the Schiff base then undergoes an Amadori rearrangement to form HbA1c. The intermediate Schiff base is unstable with a 60-fold greater tendency to dissociate (to the free sugar plus protein) than the stable ketoamine of HbA1c· As only a small fraction of blood glucose is in the open aldehydic form (approximately 0.001%) and the rate of ketoamine formation is slow (although effectively irreversible), the formation of HbA1c is an indication of long term blood glucose concentration. Over the 120 days life-span of the human red blood cell, the number of glycosylated Hb molecules increases proportionally to the mean blood glucose concentration. The relationship between the mean plasma glucose and HbA,, concentrations is unique in that a single HbA,c measurement provides a retrospective assessment of blood glucose control over the preceding 6 to 8 weeks. It is generally accepted that HbA1c measurements are a very useful tool in monitoring diseases of carbohydrate metabolism, specifically diabetes mellitus. Diabetics have high long-term blood sugar levels and this is reflected in their HbA,, levels. Normal adults have about 3-6% of their total hemoglobin as HbA,, whereas the range in juvenile and maturity onset diabetics is 6-15% as HbA1c. A similar increase in HbA,c concentration has been noted in mice with genetic and chemically induced diabetes and in pancreatectomized dogs.
- Among the several methods which exist for determining glycosylated Hb in blood, HbA, and in particular HbA,, measurements have now become a method of choice for monitoring the treatment of diabetics (L. Jovanovic et al., American J. of Medicine (1981) 70, 331;D. E. Goldstein et al., Diabetes (1982) 31; 70; K. H. Gabboy et al., J. of Clinical Endocrinology and Metabolism (1977) 44, 859; B. Gonen et al., Diabetologia (1978) 15, 1; C. M. Peterson, Diabetes (1982) 31, 1 ). Also, the following patent documents can be usefully mentioned: US-A-4,247,553; GB-A-1,580,318; US-A-4,222,836; US-4,372,747; 4,200,435; 4,341,635. These methods can be readily classified by the mechanism used to separate glycosylated Hb from non-glycosylated Hb. For instance ion-exchange chromatography was used early and is still the most common method (H. G. Kunkel et al., Science (1955) 122,288). Although such ion-exchange technique is currently the only available method which specifically measures HbA1c, it has a number of limitations of which temperature and pH sensitivity are the most important. Ion-exchange also is subject to interferences as labile glycosylated Hb (pre-HbA1c) must be removed prior to assay and both fetal Hb (HbF) and Sickle Cell Hb (HbS) interfere with the results.
- Other techniques involve agar gel electrophoresis (L. Menard et al., Clinical Chemistry (1980) 26,1598), isoelectric focusing (K. M. Spicer et al., Diabetes (1978) 27,384), colorimetry, e.g. with thiobarbituric acid (R. Fluckiger et al., FEBS Letters (1976) 71, 356) and affinity chromatography (V. Bouriotis et al., Diabetologia (1981) 21, 579). Only one type radioimmunoassay has been reported (J. David et al., British J. of Haematology (1978) 38, 329) which was slow (more than 3 days to work) and technically complex as requiring the preparations of radiolabelled HbA1c. Although the methods of the prior art have merits, there is still a need for methods providing quick results (less than about 15 minutes), requiring less skilled operators and less costly to be undertaken on a routine basis. Current art methods are slow (typically more than 1 hour results), technically complicated (require more than five pipetting manipulation steps) and unsuited to testing outside a laboratory environment. Further, present methods require that total hemoglobin be ascertained separately from the glycosylated factors and it would be desirable that both analytical data can be ascertained substantially together and correlated without delay.
- The method of the present invention, as summarized in
claim 9, remedies the inconvenience of prior art methods and further offers the advantage of directly relating, if desired, the percent of glycosylated factor or other hemoglobin factors to total hemoglobin. - The present method allows for the separate determination of (Hb) A,,, A,a or A,b provided antibodies specific to any of such species are available in purified form. Otherwise, using less specific antibodies, the present method allows for the combined determination of two or more blood factors taken together, i.e. all glycosylated Hb relative to total Hb for instance. Of course, the method also provides forthe determination of blood factors other than the ones hereabove if corresponding reagents specific to said factors in complex formation reactions are available (e.g. HbF, HbS or other human hemoglobin variants).
- The present invention does not concern the obtention or preparation of such specifically reactive complex moieties (monoclonal or polyclonal antibodies) which belong to the prior art but it concerns their use as coating materials in the preparation of the active wave guides to be contacted with the blood sample to be analyzed according to the invention.
- The waveguides used in the present methods can be of many kinds and some have been disclosed in copending application EP-A-75353 together with the methods for coating the wave guides with the reactive antibodies selected.
- In the present case, plate-like or fiber optic waveguides included as members of an analytical cuvette are preferably used, the coated surface of the wave guides being put into contact with the blood sample once the latter has been injected into the cuvette.
- The optical technique used here relates, as discussed hereinabove, mainly to light absorption, i.e. there is an interaction of the evanescent component of the wave transported in the guide with the molecules, first in the ambient liquid (the depth of penetration the evanescent component exceeds somewhat the thickness of the antibody coating, which provides an instantaneous response) and, second, with the Hb-antibody complex which starts building up on the guide in forms of an additional layer due to the reaction of the blood factor to be determined with the specific complex moiety (antibody) previously coated on the guide surface. Although the depth of interaction of the evanescent light component is not substantially limited to the thickness of the layer of the complex, it has been surprisingly found that the optical response to that build-up is independent of the bulk absorption due to the blood itself and the two effects can be easily distinguished without sophisticated techniques for decoding the signals originating from one or the other effect.
- Hb derivatives have characteristic absorption spectra dependent on their chemical state. Hence, any of the usual absorptiometric techniques are equally applicable for implementing the invention (L. Tentori et al., Hemoglobin, in Methods in Enzymology (1981), vol. 76, 707-732, Academic Press, New York). Included are the cyanomethhemoglobin method and single or multi-wavelength absorptionmetric assays, preferably in the
range 400 to 600 nm, specifically 400-420 nm and 550-600 nm. Also included are such isobestic point methods where the absorption by the Hb molecule is independent of the degree of oxygen saturation. - The invention and its present illustrative aspect will be better understood with help of the accompanying drawing.
- Fig. 1a is a diagram explaining the propagation of totally reflected light in a medium (waveguide) of refractive index n, greater than n2, the refractive index of another medium (analyte) with which the wave guide is in contact.
- Fig. 1b is appendent to Fig. 1a and schematically represents the penetration of the evanescent wave component in the rarer medium (analyte).
- Fig. 2 is a schematic layout of a single waveguide apparatus for carrying out the method of the invention.
- Fig. 3 is a schematic layout of another embodiment of an apparatus for carrying out the method of the invention.
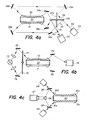
- Fig. 4a is a schematic top view of a detail of another embodiment of an analytical apparatus involving a double waveguide cell.
- Fig. 4b is a schematic view of a variant of the embodiment of Fig. 4a.
- Fig. 4c is a schematic view of still another embodiment.
- Fig. 5 is a schematized representation of the phenomena occurring during an analysis according to the method of the invention.
- Fig. 6 is a diagram showing response curves in performing an analysis according to one embodiment of the invention.
- Fig. 7 is a diagram showing the variation of one parameter of the response curve as a function of the angle of incidence of the multiply reflected light beam travelling through the waveguide.
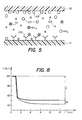
- Fig. 8 is a diagram with a typical response curve in the analysis of HbA1c in the presence of hemoglobin.
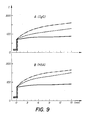
- Fig. 9 illustrates another type of analysis involving fluorescence.
- As said before, when a
light beam 1 strikes with an angle the interface between two transparent media n, and n2 (Fig. 1a), striking from the medium n, with the greater refractive index (n1>n2), total internal reflection occurs (N. J. Harrick, Internal Reflexion Spectroscopy, Wiley Interscience, New York (1967)) when the angle ofreflection 8 is larger than a certain value θc called the critical angle given by the equation:
- The reflected beam is indicated by
numeral 2. In this case the evanescent wave penetrates a distance (dp) of the order of a fraction of a wavelength beyond the reflecting surface into the rarer medium of refractive index n2. According to Maxwell's equations a standing sinusoidal wave, perpendicular to the reflecting surface, is established in the denser medium (Fig. 1 b). Although there is no net energy flow into the non absorbing, rarer medium, there is an evanescent,nonpropagating field 3 in that medium, the electric field amplitude (E) of which is largest at the surface interface (Eo) and decays exponentially with distance (Z) from the surface according to:
- The depth of penetration (dp), defined as the distance required for the electric field amplitude to fall to exp (-1) of its value at the surface, is given by:

- Starting from 90°, as 8 approaches θc, dp becomes infinitely large, and at a fixed angle, increases with closer index matching (i.e., as n2/n1→1). Also, because dp is proportional to wavelength, it is greater at longer wavelengths.
- Thus, by an appropriate choice of the refractive index n1 of the transparent waveguide, of the incident angle, and of the wavelength, one can select a dp to control optical interaction, either mainly with
substances 4 close or at given distance from the interface and minimally withsubstances 5 beyond said distance or, with varying response ratios, with both 4 and 5. And this is precisely one of the key factors of the present invention, i.e. to have established that appropriate selection of said parameters (n 1, 8 and λ) provides optical conditions for measuring, at the same time, two independent parameters in the analyte. In the present embodiment, the denser medium can be constituted by a quartz microscope slide (n1=1.54) and the rarer medium is aqueous blood sample (n2=1.34) and 8 is controllably variable so that when λ is a selected visible wavelength, dp can be varied from about 20 to 300 nm until optimal response is provided. Of course, other materials for the waveguide can be used with refractive indices other than 1.54. - Although single reflection systems can be used, one can enhance sensitivity (lower the limit of detection) by combining the evanescent wave principle with multiple internal reflections. The number of reflections (N) is a function of the length (L) and thickness (T) of waveguide and angle of incidence (8):

- The microscope slide waveguides used in some of the experiments had an active length of 36 mm, thickness of 1 mm and the angle of incidence varied from about 60 to 75°. Thus the number of reflections on one side for a discrete light beam was approximately 6. Similarly, in another embodiment using a fibre optic waveguide, the latter had an active length of 64 mm, a thickness of 0.6 mm and, with the same angles of incidence the total number of reflections for a discrete light beam varied from about 30 to 40.
- As said before, the method of the invention can also rely on fluorescence effects. Fluorescence emission generated at a waveguide liquid interface can also be monitored at the waveguide output. As predicted by the theory of reciprocity and demonstrated with dye molecules in both monomolecular layers (Carnaglia and Mandel, J. Optical Soc. of America 63, 479 (1972)) and in monodispersed spheres (Lee et al.,
Applied Optics 18, 862 (1979)), fluorescence emission at a waveguide/liquid interface can be treated as an evanescent wave. In effect, excitation of fluorescence by an evanescent wave produces fluorescence emission with the characteristics of an evanescent wave and thus generates an internally reflected beam of fluorescent light. The direction of fluorescence emission of this form is mainly a function of the respective refractive index ratio and has the major characteristic (see the above Carnaglia reference) that photon emission has a distribution of "preferred" angular probability close to the critical angle (8e). - In practical terms this means that fluorescence can be monitored at the output of the waveguide in the same optical plane as the excitation light. Theoretically, this has the advantages of concentrating the fluorescent emission intensity within a small angle; also, these fluorescent photons do not pass through the bulk of the solution and thus are not subject to major optical interference (e.g. absorption, scattering).
- This technique is disclosed in more detail in co-pending application EP-A-75353.
- For the fluorescence measurements illustrating the present invention, the excitation wavelength was selected at 490 nm and fluorescence emission measured (wavelength greater than 510 nm) at the waveguide output by positioning cut-off filters before the photodetector element (KV 8.5; 50% transmittance at 550 nm. Schott Glass Works, Mainz, Germany).
- Fluorescence techniques allowing for the simultaneous determination of two or more parameters, for instance with multi-analyte waveguide systems have many applications in the field of clinical diagnostics, e.g. simultaneous measurement of the thyroid hormones T4 and T3, the gonadotrophins LH and FSH, tumor markers such as AFP and CEA; also the whole gamut of cell surface antigen determination as applied to clinical microbiology.
- One embodiment of the apparatus used is schematically represented on Fig. 2 which shows a block diagram the major components; these components comprise a
monochromator 9, alight source 6, a flow cell 7 withwaveguide 8, and electronics with data-acquisition and processing microcomputer inlcuding aphotomultiplier detector 10, a preamplifier 11, a computerized lightsource control system 12, amicroprocessor 13, aprinter 14, and a memory (floppy disc) 15. - The
light source 6 in this instance was a xenon flash lamp (E. G. & G., Salem, MA) and the monochromator was equipped with a concave halographic grating (Jobin-Yvon, Paris, France) to permit a resolution of 5 nm. The flash lamp operation was controlled bymicrocomputer 12. To inject the samples through aninput 18 to the cell 7 a programmable automatic pipette (Microlab-P; Hamilton Bonaduz AG, Bonaduz, Switzerland) was preferably used. The optical component further included two mirrors M, and M2 and twoprisms house microcomputer 12 performed fast signal averaging, and all data were adjusted for variation in flash lamp intensity by reference to aphotodiode 19 placed in the monochromator. The signals were transmitted to amicrocomputer 13, preferably an Apple II model, for display and storage. Two different embodiments of waveguide systems were used: - The analytical cell or cuvette illustrated on Fig. 2 as one embodiment, is based on a microscope slide waveguide system. The illustrated system shows the flow cell 7 whose bottom is actually the
microscope slide 8. Tightness is ensured by agasket 20; theslides 8 were placed in direct optical contact with two quarter-round silica prisms gasket 20. - The flow cell, machined from aluminium alloy, met the criterion of allowing rapid, bubble-free laminar flow along the light path. Its design also ensured rapid and accurate demounting and repositioning. We chose an aluminium alloy, although other metals are also suitable, e.g. brass, because of its good thermal conductivity, relative lack of reactivity with saline solution, and low optical reflectivity after being anodized matt black to avoid stray light effects. The
gasket 20 was 0.5 mm thick medical grade silicone rubber and water tight under a constant sealing pressure of 2 kg/cm2. Includinginput 18 andexit 21 ports the total cell volume was 1.8 ml, the volume directly above the waveguide was 0.66 ml (53x25x0.5 mm) and the volume above the light path was 0.29 ml (36x16x0.5 mm). - A second embodiment (see Fig. 3) is based on a fibre optic system. The
fibre waveguide 31 was prepared from standard transmission optical fibres by first cutting them into 120 mm pieces, then removing the ethylene/tetrafluoroethylene coating and silicone cladding to expose an optically active surface area of 120 mm2. The ends of the fibres were bared and held within specially made stainless steel end-fittings 32 and 33 (7x3 mm internal diameter) for support and protection. Thefibre flow cell 34 was an open-ended quartz tube (internal diameter 4 mm,length 80 mm) withinput 35 andoutput 36 tubes added for inserting and removing sample. The fibres were set in place in the flow cell with silicone rubber plugs 37, 38. Light fromsource 39 was filtered (40) and focussed (41) with a lens onto the end of the fibre at a mean aperture angle of 68° (see Fig. 1); at the fibre output, light was refocussed by means of alens 42 onto aphotmultiplier tube 43. - The apparatus of which the essential optical components are schematized on Fig. 4a comprises a dual-
waveguide cell 50 of which themain walls source 53 and whose inner walls, either bared, blocked or coated with a specific reactant, are in contact with the analyte solution contained incell 50. The especially shaped light conductive walls of the cuvette can be provided by usual means, e.g. by molding with a transparent plastic, for instance lucite. These walls can be made from materials with the same or different refractive indices. - The beam of
light 54 originating fromsource 53 is alternatively split intobeams rotating chopper mirror 57a, b. On Fig. 4a, this mirror 57 has been represented in two positions, i.e. one instant position corresponds to numeral 57a and another position (at about right angle to the first one) by numeral 57b. It can be-readily seen that, depending on the position of the mirror 57, thebeam 54 is either reflected intobeam 55 or intobeam 56. Thus, the light from thesource 53 is alternatively injected in eitherportion dual waveguide cell 50 by means of either one of a series ofmirrors 58a, b, c and 59a, b and c, respectively. The output light, respectively 60 and 61, from either part of the waveguide is then collected on adetector 62. - The remaining components of this embodiment are not represented on the drawing as being known from the art and identical to the corresponding elements disclosed in connection with the embodiment of Fig. 2.
- In a further embodiment (see Fig. 4b), the apparatus comprises a dual-
waveguide cell 70 identical with the cell of the previous embodiment, i.e. havingwalls - The apparatus comprises a
light source 73, the output of which is focussed on either side by means of lenses and mirrors, respectively 74 and 75, on the input side ofguide elements chopper disk 76 with awindow hole 77 acts to alternatively distribute the exciting light intoelements detector 78 by means ofmirrors - In both embodiments depicted on Figs. 4a and 4b, one of the waveguide elements (51, 71) is coated with an antibody specific to one component to be measured in the analyte by a complexation reaction (as disclosed hereintofore) while the second element (52, 72) is left uncoated. Herein, uncoated refers to a surface without antibody. However the protein adsorption sites on this surface are usually blocked by adsorbing a protein (e.g. BSA) to the surface. Therefore during analysis, the signal collected at the output of the uncoated area reflects the interaction of the exciting beam with the bulk of the analyte, i.e. it provides the desired information on the total hemoglobin in the sample. However, simultaneously, the signal emerging from the coated side of the guide provides the required information on the component being bound by the specific reactant coated on the inner surface of this side of the cell. This will be illustrated in more detail with reference to Example 4 in this application. Suffice to say now that this kind of waveguide system (dual type) allows to gather the two types of information from separate areas of the waveguide (i.e. the phenomena are no longer superimposed like in the earlier embodiment) which may provide more accuracy in the determinations.
- A variant embodiment is represented on Fig. 4c. In this variant, a
dual waveguide cell 90 of the same general configuration as theaforementioned cells sources ends 91b and 92b, respectively, after crossing beam-splitters detector 97 for collecting the backward signals exiting from 91 b and 92b and directed thereto by means ofbeam splitters like mirror 98.Sources detector 97. - Fig. 5 is a schematic illustration at the molecular level of the phenomena taking place during analysis in a cell of the dual-waveguide type as disclosed previously. In Fig. 5 areas marked 51 and 52 correspond for instance to the
waveguide elements areas elements Element 51 is pictured to have deposited thereonantibodies 100 specific to HbA,c entities labelled 101. Some of these HbA,, molecules are shown after complexation with thespecific antibody 100, others are still free. The other surface (i.e. the surface of element 52) is shown coated with blocking agents 102 (for instance, bovine serum albumin) said agents being intended to minimize the possible affinity of the bare wall to other species in solution, for instance HbAo 103 and other proteins of any type 104. - Thus, during analysis, non specific binding of Hb to surface 52 is prevented (or at least strongly minimized) which makes it possible to measure the bulk hemoglobin by the interaction of the evanescent wave component of the signal travelling in 52 with the analyte solution at depths beyond that of the blocking coating deposited on the surface.
- In contrast, a complexation reaction occurs on
surface 51 between theantibody molecules 100 coated thereon and the HbA,c (AG) molecules in the analyte solution. This reaction although rapid is not instantaneous; therefore a layer of complex progressively builds up onsurface 51 with consecutive corresponding interaction with the light component travelling in that element of the waveguide, this resulting in the production of response curves of the A or B type depicted in Fig. 6 (see the Examples that follow). - In order to practically carry out the tests, the microscope slides were cleaned by consecutive immersion in concentrated sulfuric acid and distilled water, ethanol, and acetone, using standard slidestaining glassware. Fibres were cleaned in ethanol ultrasonically and, supported on glass rods, were immersed in the various antibody solutions. Antibodies were either physically adsorbed to the surface of the waveguides or covalently coupled. Adsorption was carried out by incubating cleaned waveguides with solutions of antibody (5 mg of protein/ml of 0.05 mol/I Tris Hcc buffer, pH 7.0) for four hours. Unadsorbed proteins were washed away with saline and residual protein binding sites blocked by incubation of the antibody-coated waveguides with bovine serum albumin (1.0% by weight in Tris Buffer). The method of coupling was essentially that of Weetall, involving aminopropyltriethoxysilane APTS (Immobilized Biochemicals and Affinity Chromatography, R. B. Dunlop, Plenum Press, New York, p. 191-212) in an acid aqueous silanization environment. (Immobilized Enzymes, Antigens, Antibodies and Peptides: Preparation and Chromatography, 1: Enzymology, H. A. Weetall, Marcel Dekker Inc. New York 1975, p. 1-48).
- In general, we reacted waveguides with APTS (0.4 mol/I) for 3 hours at 80°C. We then heated the slides or the cuvette walls at 120°C and the fibres at 100°C for 2 hours, then let them soak in glutaraldehyde solution (0.5 mol/I) in phosphate buffer (0.1 mol/I, pH 6.8) for 90 min at ambient temperature. The "activated" waveguides were then reacted with antiserum Ab (5 mg of protein per milliliter of phosphate buffer) for 24 hours at 4°C. After washing the antibody-coupled waveguides in phosphate buffer, we stored them at 4°C in isotonic saline (0.14 mol/I, containing sodium azide, 8 mmol/L). Measurements of protein (Anal.
Biochem 51, 654-655 (1973)) before and after the coupling demonstrated protein uptakes of approximately 1 pg/cm2 of quartz. - The following Examples illustrate the invention in more detail.
- (to demonstrate the existence of two distinct optical phenomena
- i) interaction of the evanescent wave component with hemoglobin in bulk,
- ii) interaction of the evanescent wave component with the Ag/Ab complex under formation).
- The apparatus used was that of embodiment of Fig. 2.
- Preparation of standards with known solutions of hemoglobin.
- Purified hemoglobin A (HbA) was obtained from Serva Feinbiochemica, Heidelberg, FRG. Bovine Serum Albumin (BSA) was from Sigma Chemical Co., St. Louis, Mo, USA. All chemicals for buffers and solvents were Analar or Reagent Grade from Merck, Darmstadt, FRG, or BDH, Poole, Dorset, UK. Rabbit antiserum to human Hba was purchased from Dako, Copenhagen, Denmark.
- Waveguides were fused-silica microscope slides (Suprasil 1.75 mmx25 mmx1 mm) from Heraeus Quarzschmelze GmbH, Hanau, FRG.
- Slides were cleaned by consecutive immersion (10 min each) in concentrated sulphuric acid, distilled water, ethanol and acetone. Antibody was coated to the surface by incubating the cleaned slides for 1 hour in a solution of anti-HbA diluted five-fold in phosphate buffered saline (PBS; 0.1 mol/L phosphate, pH 7.4, 0.9% (w/v) NaCI). Following rinsing with distilled water, remaining protein binding sites were blocked by incubation for 1 hour with 1 % (w/v) BSA in PBS. Slides were then rinsed in distilled water and stored at 4°C in isotonic saline prior to use.
- Slides were fixed in conformity to the first embodiment illustrated on Fig. 2 in a manner which allowed light to be coupled into the slides at
different angles 8. The flow cell 7 was fixed to the surface via a 0.5mm silastic gasket 20 and bubbles purged from the system by pumping assay buffer (PBS+5.0% (w/v) BSA) through the cell. Standard Hb solutions (1.0, 0.5, 0.1, 0.05 mg/ml) were made up in assay buffer to give a final protein concentration of 5 mg total protein/ml. - The assay procedure was initiated by injecting 3.5 ml of standard Hb solution into the cell after establishing a base-line signal. The wavelength of the input beam was selected by adjusting the monochromator at 410 nm and the reaction was monitored by the reduction in intensity at 410 nm. The
angle 8 was first selected at random above 66° (the critical angle). A value of about 67° was used in the test reported below. - Illustrated by Fig. 6 are the antibody-binding curves obtained with the 1.0 (curve A) and 0.1 mg/ml (curve B) Hb standards, using successive antibody-coated slides. After stabilising the base-line, the standards were injected at to and an immediate fall (IA, IB) in transmission (arbitrary units) was followed by a slower but still rapid binding event which continued over the next 10 minutes. The initial fall was due to free hemoglobin molecules optically absorbing within the Dp range of the evanescent wave (see Fig. 1). Note that at this early stage the complex layer is starting to form; therefore the evanescent wave component extends quite significantly beyond the initial Ab coating and is free to interact with the bulk solution. The subsequent slower change in signal of rate K and magnitude, respectively, MA and MB at time t, was due to antibody-binding of Hb at the surface. In the absence of antibody the signal changed minimally after the initial immediate fall. This was shown in a control experiment not shown on the drawing using no Ab coating.
- Then the cell was washed with assay buffer (t1) which removed all unbound materials. The residual absolute change in signal (WA, WB) is related to dose as indicated in the table below.

- The standard curves A and B were usable as templates for the determination of hemoglobin in unknown samples of blood. Similarly reproducible information could be gathered from measured values MA and MB provided unknown samples were measured after a constant time tl.
- With an antibody-coated slide in place, Hb standard solution (1 mg/ml) was injected into the flow cell. After 10 minutes reaction the unbound materials were washed out of the cell with assay buffer. Bound materials were monitored by the reduction in transmission at 410 nm. The effect of incident angle of light was investigated by varying the angle (8) from 64° to 78°. The critical angle (θc) is 66°. The results were plotted as the % transmission decrease (=sensitivity) vs angle of incidence (Fig. 7). It can be seen that with this system measurement of antibody-binding of Hb is possible with angles between 66 at 70°, with an optimum near to 68°. Larger angle shave too small a penetration depth in this case although they may suit analytical system of a different kind; smaller angles result in refraction not reflection. Angles between 66 and 68° are less suitable presumably because the depth of penetration of the evanescent wave component is too great.
- Hb standard solutions were incubated with separate antibody-coated slides and the reaction monitored using 8=about 68° as the optimal angle. The results expressed as % transmission, show a dose-response relationship:

- The minimum detection limit of this system is about 0.1 mg/ml or 0.1 g/I. Normal adult HbA values are 135-175 g/I, normal HbA1c levels are 4-9 g/I, thus this method can be mixed with x10-x100 dilution of normal samples with adequate sensitivity.
- Solution samples were prepared based on avian hemoglobin (pigeon) and containing variable proportions of human hemoglobin to be measured. The total of both hemoglobins was always 5 mg/ml and the proportions of human hemoglobin are given in the Table below. A dual waveguide of the type shown in Figs. 4a and 4b was used, one of the surfaces (e.g. 51) being coated with antibody to human IgG. The other surface (52) was blocked with bovine serum albumin as usual.
- Upon doing the measurements a sharp dip (I) corresponding to 75.3% transmission was observed in all cases; then the further drop in transmission (M) (cf. with Example 1 and Fig. 6) was recorded after an interval of 10 min. In the case of the sample containing only avian hemoglobin, no further change during the 10 min interval was observed. The results are summarized below.

- Thus the value recorded for the first initial dip I can be correlated with the total hemoglobin present while the values (M) observed after the 10 min reaction period and corresponding to the binding of the human hemoglobin factor to the antibody coated on
surface 51 can be correlated with the human hemoglobin content of the sample and its ratio to total hemoglobin. Standard curves were made from the above data by recording on an automatic recorder coupled to the apparatus used in this Example. Such curves were thereafter used as comparative data for determining unknown mixtures of human hemoglobin in avian hemoglobin. - Standard glycosylated Hb (HbA1c) was prepared from pooled heparinized whole blood by cation- exchange chromatography (L. A. Trivelli et al., New England J. of Medicine 284 (1971), 353), using Bio-Rex 70 resin (Bio-Rad, Richmond, Ca. USA). The purified HbA1c was then used to prepare standard samples by recombining it in varying known amounts with blood free from the glycosylated hemoglobin. The concentrations of HbA,, relative to total hemoglobin in the samples varied from 1 to 20% by weight and the total Hb concentration was of the order of 150 g/I.
- An analytical apparatus with cuvettes involving a dual waveguide as illustrated on Fig. 4b was used for the determinations; the inner surface of one side of the cuvette was plated with antibody specific to HbA1c while the surface of the opposite side was left free. The content of each cell (a fresh one was used for successively testing each standard) was about 1 ml and 0.1 ml of the standard to be measured with about 0.9 ml of PBS were pipetted therein. Fig. 8 depicts one of the titration curves obtained after 15 min incubation time (with the 20% HbA1c sample), the upper curve (nearly flat) being that recorded with the uncoated part of the guide and the lower curve showing the response of the antibody coated part of the waveguide.
- The results of the analysis of the various standards are also gathered in the table below.

- The difference of 0.3% for the zero HbA,, sample may indicate some degree of residual affinity of the HbA,, specific antibody for the deglycosylated blood medium. This factor is however considered negligible under practical analytical conditions.
- It should also be noted that the % transmission in the uncoated part of the waveguide was not constant from one cell to the other seeming to indicate that the method is not suitable for accurately determining total Hb. However it is not necessary in this instance to measure total Hb, but only to relate the signals from the uncoated and coated sides. Secondly, it is difficult to maintain a degree of constancy in manually fabricating a series of cuvettes such that each will enable full reproducibility of absolute measurements without initial calibration of the equipment. Undoubtedly, when cuvettes are manufactured industrially by molding on a large scale, this disadvantage is overcome.
- The simultaneous determination of human IgG and human serum albumin (HSA) by fluorescence type assay
- The dual waveguide system as in the previous Example was used, a cut-off filter to block the incident radiation at 490 nm and pass the fluorescent signal at 520 nm being inserted on the light path before
detector 78. The exciting light was generated by a monochromator of the type (9) disclosed in connection with Fig. 2. - One wall surface (A) of the cuvette serving as the dual-waveguide was coated with sheep raised antiserum against IgG. This was effected by adsorption according to usual means using a diluted solution of antiserum (y-chain specific; Sapu, Carluke, Scotland; dilution by
volume 1/400). The oppositely facing wall (B) of the cuvette was coated by the same technique with sheep antiserum against HSA (final dilution 1/100 by volume) obtained from the same source. - Then, mixed combination standard solutions were prepared by dissolving together human IgG (Serva Biochemicals) and HSA (UCB-Bioproducts, Brussels, Belgium). Concentrations of reagents in the standards were 0.1; 1.0; 10.0 and 100.0 pg/ml. The solution buffer used as the standard medium was phosphate buffer 0.05 mole/I (pH 7.4); 0.9% NaCI (W/v); 0.05% NaN3 (W/v); Tween 20 (Sigma) 0.1 % (v/v) and 2% (v/v) normal sheep serum (SAPU).
- The test disclosed in this experiment was based on making a "sandwich" type assay i.e. the cuvettes were contacted with the standards and incubation was carried out for a determined period to ensure sufficient binding of the antigens on the respective specific antibodies attached to surfaces (A) and (B). This incubation time was an accurately measured 10 min period in the course of which the amount of overall bound antigen was in proportion to its concentration in the standard. Tests against blanks (zero % of antigen reagents) were run identically.
- Thereafter, the cells were emptied and rinsed of all unbound materials and a combined solution of second antibodies to the antigents attached to the waveguide surface was added. This combination solution contained 1/40 (v/v) buffer diluted rabbit anti-HSA and rabbit anti-IgG (obtained from Dako Immunoglobulins) labelled with fluorescein (fluorescein isothiocyanate, FITC was used as the actual marker according to usual means).
- Once the fluorescent labelled mixed antibody solution was added, an instantaneous fluorescence rise was observed at the output of the waveguide followed by a slower rate dependent signal (see Fig. 9) whose height after a given period was in proportion to the standard concentrations in IgG and HSA taken independently. After decoding, the signals components originating from surfaces (A) and (B) were displayed separately and the results are gathered in the following table.

- Fig. 9 shows graphically for components A and B the situation from zero to 15 min in the case of the 1 pg/I (dashed line) and 10 µg/I (mixed line) standards. The full line represents blanks.
- As in the previous Example, samples with unknown concentrations of IgG and HSA were run identically and ascertained by comparing with the standards.
Claims (14)
Priority Applications (6)
| Application Number | Priority Date | Filing Date | Title |
|---|---|---|---|
| EP84810600A EP0184600B1 (en) | 1984-12-10 | 1984-12-10 | Method for optically ascertaining parameters of species in a liquid analyte |
| DE8484810600T DE3481644D1 (en) | 1984-12-10 | 1984-12-10 | METHOD FOR THE OPTICAL DETECTION OF PARAMETERS OF SUBSTANCES IN A LIQUID ANALYT. |
| AU50867/85A AU582604B2 (en) | 1984-12-10 | 1985-12-06 | Method for optically ascertaining parameters of species in a liquid analyte |
| US06/805,903 US4818710A (en) | 1984-12-10 | 1985-12-06 | Method for optically ascertaining parameters of species in a liquid analyte |
| CA000497202A CA1272617A (en) | 1984-12-10 | 1985-12-09 | Method for optically ascertaining parameters of species in a liquid analyte |
| JP60276144A JP2603611B2 (en) | 1984-12-10 | 1985-12-10 | Method and apparatus for optically identifying species parameters in liquid analytes |
Applications Claiming Priority (1)
| Application Number | Priority Date | Filing Date | Title |
|---|---|---|---|
| EP84810600A EP0184600B1 (en) | 1984-12-10 | 1984-12-10 | Method for optically ascertaining parameters of species in a liquid analyte |
Publications (2)
| Publication Number | Publication Date |
|---|---|
| EP0184600A1 EP0184600A1 (en) | 1986-06-18 |
| EP0184600B1 true EP0184600B1 (en) | 1990-03-14 |
Family
ID=8193057
Family Applications (1)
| Application Number | Title | Priority Date | Filing Date |
|---|---|---|---|
| EP84810600A Expired - Lifetime EP0184600B1 (en) | 1984-12-10 | 1984-12-10 | Method for optically ascertaining parameters of species in a liquid analyte |
Country Status (6)
| Country | Link |
|---|---|
| US (1) | US4818710A (en) |
| EP (1) | EP0184600B1 (en) |
| JP (1) | JP2603611B2 (en) |
| AU (1) | AU582604B2 (en) |
| CA (1) | CA1272617A (en) |
| DE (1) | DE3481644D1 (en) |
Cited By (2)
| Publication number | Priority date | Publication date | Assignee | Title |
|---|---|---|---|---|
| US7138268B2 (en) | 1995-03-28 | 2006-11-21 | Agilent Technologies, Inc. | Dry biochemical assay plate and method for making the same |
| DE102021133357A1 (en) | 2021-12-15 | 2023-06-15 | Endress+Hauser Conducta Gmbh+Co. Kg | Sensor element, sensor system and method for manufacturing the sensor element |
Families Citing this family (181)
| Publication number | Priority date | Publication date | Assignee | Title |
|---|---|---|---|---|
| US4621063A (en) * | 1982-10-12 | 1986-11-04 | The Center For Immunological Studies | Methods for the detection and quantitation of immunological substances |
| DE3344019C2 (en) * | 1983-12-06 | 1995-05-04 | Max Planck Gesellschaft | Device for optically measuring the concentration of a component contained in a sample |
| CH665033A5 (en) * | 1985-07-01 | 1988-04-15 | Prutec Ltd | WAVEGUIDE FOR USE AS AN OPTICAL PROBE IN SPECTROSCOPIC ANALYSIS WITH INTERNAL REFLECTION. |
| US4716121A (en) * | 1985-09-09 | 1987-12-29 | Ord, Inc. | Fluorescent assays, including immunoassays, with feature of flowing sample |
| US4945245A (en) * | 1986-01-14 | 1990-07-31 | Levin Herman W | Evanescent wave background fluorescence/absorbance detection |
| EP0245206A1 (en) * | 1986-05-05 | 1987-11-11 | IntraCel Corporation | Analytical method for detecting and measuring specifically sequenced nucleic acid |
| US4935346A (en) | 1986-08-13 | 1990-06-19 | Lifescan, Inc. | Minimum procedure system for the determination of analytes |
| US4717545A (en) * | 1986-09-11 | 1988-01-05 | Miles Inc. | Device and method for chemical analysis of fluids with a reagent coated light source |
| GB2199655A (en) * | 1986-12-10 | 1988-07-13 | Plessey Co Plc | Optical sensing system |
| BE1000572A4 (en) * | 1987-05-20 | 1989-02-07 | Block Myron J | Appts. for analysing polynucleotide in liq. sample - using internal reflection cell coated with complementary single strand sequences and selective fluorescent dye |
| DE3876398T2 (en) * | 1987-06-20 | 1993-04-08 | Applied Research Systems | WAVE GUIDE SENSOR. |
| DE3725652A1 (en) * | 1987-08-03 | 1989-02-16 | Kadia Diamant | CUTTING MACHINE TOOL |
| WO1989007254A1 (en) * | 1988-01-28 | 1989-08-10 | Spectran Corporation | Infrared transmitting probe and assays using same |
| US4929049A (en) * | 1988-01-29 | 1990-05-29 | Fiberchem, Inc. | Fiber optic refractive index sensor using a metal clad |
| JPH0746109B2 (en) * | 1988-02-29 | 1995-05-17 | ダイキン工業株式会社 | Immunoassay device and immunoassay method |
| JPH0746108B2 (en) * | 1988-02-29 | 1995-05-17 | ダイキン工業株式会社 | Immunoassay device and immunoassay method |
| SE8804074D0 (en) * | 1988-11-10 | 1988-11-10 | Pharmacia Ab | SENSOR UNIT AND ITS USE IN BIOSENSOR SYSTEM |
| SE8902043L (en) * | 1988-11-10 | 1990-05-11 | Pharmacia Ab | PROCEDURE CHARACTERIZES MACROMOLECULES |
| US6010867A (en) * | 1989-04-19 | 2000-01-04 | Ibiden Co., Ltd. | Reagent for biomaterials assay, preparation method thereof, and assay method |
| US5401469A (en) * | 1989-04-19 | 1995-03-28 | Ibiden Co., Ltd. | Plastic optical biomaterials assay device |
| WO1990013029A1 (en) * | 1989-04-19 | 1990-11-01 | Ibiden Co., Ltd. | Reagent for assaying biologically active substance, method of production thereof, and method and apparatus for assaying |
| CA1337173C (en) * | 1989-04-28 | 1995-10-03 | Westaim Biomedical Corp. | Thin film diagnostic device |
| US5807747A (en) * | 1989-06-13 | 1998-09-15 | Clinical Innovations Limited | Method and apparatus for determination of glycosylated protein |
| US5175438A (en) * | 1989-11-10 | 1992-12-29 | Nikuni Machinery Industrial Co., Ltd. | Method of distinguishing particles in fluid and apparatus for the same using dual wavelength reflectivity ratio sensing |
| AT398853B (en) * | 1989-12-06 | 1995-02-27 | Weigel Christian Dipl Ing | Analytical optical conductor for determining organic substances by means of total reflection infrared spectroscopy |
| US5082629A (en) * | 1989-12-29 | 1992-01-21 | The Board Of The University Of Washington | Thin-film spectroscopic sensor |
| AU6608490A (en) * | 1990-02-22 | 1991-09-18 | Royal Institution For The Advancement of Learning, The | A solid-phase interferometric immunoassay system |
| US5075551A (en) * | 1990-03-12 | 1991-12-24 | Fuji Electric Co., Ltd. | Infrared absorption enhanced spectroscopic apparatus |
| US5212099A (en) * | 1991-01-18 | 1993-05-18 | Eastman Kodak Company | Method and apparatus for optically measuring concentration of an analyte |
| US5192510A (en) * | 1991-01-30 | 1993-03-09 | E. I. Du Pont De Nemours And Company | Apparatus for performing fluorescent assays which separates bulk and evanescent fluorescence |
| CA2069537A1 (en) * | 1991-06-07 | 1992-12-08 | Thomas A. Cook | Multiple output referencing system for evanescent wave sensor |
| GB9119242D0 (en) * | 1991-09-09 | 1991-10-23 | Univ Coventry | Data transmission |
| US5257093A (en) * | 1991-11-12 | 1993-10-26 | Guziktechnical Enterprises, Inc. | Apparatus for measuring nanometric distances employing frustrated total internal reflection |
| JP3107649B2 (en) * | 1991-12-20 | 2000-11-13 | イビデン株式会社 | Fluorescent immunoassay |
| US5777726A (en) * | 1992-05-12 | 1998-07-07 | Raytheon Company | Spectrophotometric supercritical fluid contamination monitor |
| US5354574A (en) * | 1992-06-23 | 1994-10-11 | Ibiden Co., Ltd. | Method for producing optical fiber having formyl groups on core surface thereof |
| US5512492A (en) | 1993-05-18 | 1996-04-30 | University Of Utah Research Foundation | Waveguide immunosensor with coating chemistry providing enhanced sensitivity |
| CA2164725A1 (en) * | 1993-06-08 | 1994-12-22 | Alexander Saunders | Two-phase optical assay method and apparatus |
| US5552272A (en) * | 1993-06-10 | 1996-09-03 | Biostar, Inc. | Detection of an analyte by fluorescence using a thin film optical device |
| US5413939A (en) * | 1993-06-29 | 1995-05-09 | First Medical, Inc. | Solid-phase binding assay system for interferometrically measuring analytes bound to an active receptor |
| US5416579A (en) * | 1993-07-23 | 1995-05-16 | Nova Chem Bv | Method for determining concentration in a solution using attenuated total reflectance spectrometry |
| JP3326708B2 (en) * | 1993-08-31 | 2002-09-24 | 日水製薬株式会社 | Optical measuring device and method thereof |
| US5494798A (en) * | 1993-12-09 | 1996-02-27 | Gerdt; David W. | Fiber optic evanscent wave sensor for immunoassay |
| US5432096A (en) * | 1993-12-20 | 1995-07-11 | Cetac Technologies Inc. | Simultaneous multiple, single wavelength electromagnetic wave energy absorbtion detection and quantifying spectrophotometric system, and method of use |
| JPH07318481A (en) * | 1994-05-25 | 1995-12-08 | Daikin Ind Ltd | Optical measuring method and device therefor |
| JP2807777B2 (en) * | 1994-09-09 | 1998-10-08 | 工業技術院長 | Optical absorption spectrum measuring device using slab optical waveguide |
| US5577137A (en) * | 1995-02-22 | 1996-11-19 | American Research Corporation Of Virginia | Optical chemical sensor and method using same employing a multiplicity of fluorophores contained in the free volume of a polymeric optical waveguide or in pores of a ceramic waveguide |
| US5814565A (en) * | 1995-02-23 | 1998-09-29 | University Of Utah Research Foundation | Integrated optic waveguide immunosensor |
| US6887430B1 (en) * | 1996-01-26 | 2005-05-03 | Kyoto Dai-Ichi Kagaku Co., Ltd. | Apparatus for immune analysis |
| WO1997032212A1 (en) * | 1996-03-01 | 1997-09-04 | Beckman Instruments, Inc. | System for simultaneously conducting multiple ligand binding assays |
| US5854863A (en) * | 1996-03-15 | 1998-12-29 | Erb; Judith | Surface treatment and light injection method and apparatus |
| WO1997035176A1 (en) * | 1996-03-19 | 1997-09-25 | University Of Utah Research Foundation | Lens and associatable flow cell |
| US6356676B1 (en) | 1996-03-19 | 2002-03-12 | University Of Utah Research Foundation | Lens and associatable flow cell |
| GB9609653D0 (en) * | 1996-05-09 | 1996-07-10 | Applied Research Ars Holding N | Method of assay |
| US7153651B1 (en) * | 1996-10-31 | 2006-12-26 | Inverness Medical - Biostar, Inc. | Flow-through optical assay devices providing laminar flow of fluid samples, and methods of construction thereof |
| DE59712460D1 (en) * | 1996-11-18 | 2005-12-01 | Novartis Ag | MEASURING DEVICE WITH A PLANAR OPTICAL WAVEGUIDE |
| AU1060099A (en) * | 1997-06-10 | 1999-01-25 | American Research Corporation Of Virginia | Detection of chemical agent materials using a sorbent polymer and fluores cent probe |
| TR200000565T2 (en) * | 1997-08-29 | 2000-07-21 | Fertilitiy Acoustics Inc. | Method for rapid analysis of analysis components in biological samples |
| US6222619B1 (en) * | 1997-09-18 | 2001-04-24 | University Of Utah Research Foundation | Diagnostic device and method |
| US6404491B1 (en) * | 1997-10-30 | 2002-06-11 | International Business Machines Corporation | Rolling multiple internal reflection spectroscopy |
| DE19810615A1 (en) * | 1998-03-12 | 1999-09-16 | Thomas Ruckstuhl | High efficiency optical system detecting light from e.g. excited marked biomolecules |
| US6300082B1 (en) * | 1998-03-20 | 2001-10-09 | Ia, Inc. | Method and apparatus for measurement of the effect of test compounds on signal transduction at the level of biological receptors |
| US6300638B1 (en) | 1998-11-12 | 2001-10-09 | Calspan Srl Corporation | Modular probe for total internal reflection fluorescence spectroscopy |
| SE9901306D0 (en) * | 1999-04-09 | 1999-04-09 | Amersham Pharm Biotech Ab | Improved TIRF chamber |
| EE04249B1 (en) * | 1999-04-21 | 2004-02-16 | Asper O� | Method for reading biopolymer matrix and fluorescence detector |
| US6876760B1 (en) | 2000-12-04 | 2005-04-05 | Cytokinetics, Inc. | Classifying cells based on information contained in cell images |
| US6651008B1 (en) | 1999-05-14 | 2003-11-18 | Cytokinetics, Inc. | Database system including computer code for predictive cellular bioinformatics |
| US7151847B2 (en) * | 2001-02-20 | 2006-12-19 | Cytokinetics, Inc. | Image analysis of the golgi complex |
| US6743576B1 (en) | 1999-05-14 | 2004-06-01 | Cytokinetics, Inc. | Database system for predictive cellular bioinformatics |
| US8111401B2 (en) * | 1999-11-05 | 2012-02-07 | Robert Magnusson | Guided-mode resonance sensors employing angular, spectral, modal, and polarization diversity for high-precision sensing in compact formats |
| US7167615B1 (en) * | 1999-11-05 | 2007-01-23 | Board Of Regents, The University Of Texas System | Resonant waveguide-grating filters and sensors and methods for making and using same |
| US6458326B1 (en) | 1999-11-24 | 2002-10-01 | Home Diagnostics, Inc. | Protective test strip platform |
| US6399295B1 (en) | 1999-12-17 | 2002-06-04 | Kimberly-Clark Worldwide, Inc. | Use of wicking agent to eliminate wash steps for optical diffraction-based biosensors |
| RU2181487C2 (en) * | 2000-05-11 | 2002-04-20 | Никитин Петр Иванович | Process of optical detection of attachment of real component to sensor material based on biological, chemical or physical coupling and device for its implementation ( variants ) |
| EP1322788A2 (en) * | 2000-06-23 | 2003-07-02 | Cytokinetics, Inc. | Image analysis for phenotyping sets of mutant cells |
| US7714301B2 (en) * | 2000-10-27 | 2010-05-11 | Molecular Devices, Inc. | Instrument excitation source and calibration method |
| US7575939B2 (en) * | 2000-10-30 | 2009-08-18 | Sru Biosystems, Inc. | Optical detection of label-free biomolecular interactions using microreplicated plastic sensor elements |
| US7615339B2 (en) * | 2000-10-30 | 2009-11-10 | Sru Biosystems, Inc. | Method for producing a colorimetric resonant reflection biosensor on rigid surfaces |
| US7070987B2 (en) * | 2000-10-30 | 2006-07-04 | Sru Biosystems, Inc. | Guided mode resonant filter biosensor using a linear grating surface structure |
| US7175980B2 (en) * | 2000-10-30 | 2007-02-13 | Sru Biosystems, Inc. | Method of making a plastic colorimetric resonant biosensor device with liquid handling capabilities |
| US7875434B2 (en) * | 2000-10-30 | 2011-01-25 | Sru Biosystems, Inc. | Label-free methods for performing assays using a colorimetric resonant reflectance optical biosensor |
| US7202076B2 (en) * | 2000-10-30 | 2007-04-10 | Sru Biosystems, Inc. | Label-free high-throughput optical technique for detecting biomolecular interactions |
| US7142296B2 (en) * | 2000-10-30 | 2006-11-28 | Sru Biosystems, Inc. | Method and apparatus for detecting biomolecular interactions |
| US20030092075A1 (en) * | 2000-10-30 | 2003-05-15 | Sru Biosystems, Llc | Aldehyde chemical surface activation processes and test methods for colorimetric resonant sensors |
| US7264973B2 (en) * | 2000-10-30 | 2007-09-04 | Sru Biosystems, Inc. | Label-free methods for performing assays using a colorimetric resonant optical biosensor |
| US7101660B2 (en) * | 2000-10-30 | 2006-09-05 | Sru Biosystems, Inc. | Method for producing a colorimetric resonant reflection biosensor on rigid surfaces |
| US6951715B2 (en) * | 2000-10-30 | 2005-10-04 | Sru Biosystems, Inc. | Optical detection of label-free biomolecular interactions using microreplicated plastic sensor elements |
| US7300803B2 (en) * | 2000-10-30 | 2007-11-27 | Sru Biosystems, Inc. | Label-free methods for performing assays using a colorimetric resonant reflectance optical biosensor |
| US7118710B2 (en) * | 2000-10-30 | 2006-10-10 | Sru Biosystems, Inc. | Label-free high-throughput optical technique for detecting biomolecular interactions |
| US20030113766A1 (en) * | 2000-10-30 | 2003-06-19 | Sru Biosystems, Llc | Amine activated colorimetric resonant biosensor |
| US7217574B2 (en) * | 2000-10-30 | 2007-05-15 | Sru Biosystems, Inc. | Method and apparatus for biosensor spectral shift detection |
| US7371562B2 (en) | 2000-10-30 | 2008-05-13 | Sru Biosystems, Inc. | Guided mode resonant filter biosensor using a linear grating surface structure |
| US7153702B2 (en) * | 2000-10-30 | 2006-12-26 | Sru Biosystems, Inc. | Label-free methods for performing assays using a colorimetric resonant reflectance optical biosensor |
| US7306827B2 (en) * | 2000-10-30 | 2007-12-11 | Sru Biosystems, Inc. | Method and machine for replicating holographic gratings on a substrate |
| US7023544B2 (en) * | 2000-10-30 | 2006-04-04 | Sru Biosystems, Inc. | Method and instrument for detecting biomolecular interactions |
| JP2002221485A (en) * | 2000-11-22 | 2002-08-09 | Minolta Co Ltd | Micro chip |
| US7218764B2 (en) * | 2000-12-04 | 2007-05-15 | Cytokinetics, Inc. | Ploidy classification method |
| US6599694B2 (en) | 2000-12-18 | 2003-07-29 | Cytokinetics, Inc. | Method of characterizing potential therapeutics by determining cell-cell interactions |
| US20020127563A1 (en) * | 2001-01-08 | 2002-09-12 | Salafsky Joshua S. | Method and apparatus using a surface-selective nonlinear optical technique for detection of probe-target interactions without labels |
| DE60231960D1 (en) * | 2001-01-23 | 2009-05-28 | Univ Dublin City | LUMINESCENCE DETECTOR |
| US6956961B2 (en) * | 2001-02-20 | 2005-10-18 | Cytokinetics, Inc. | Extracting shape information contained in cell images |
| US7016787B2 (en) | 2001-02-20 | 2006-03-21 | Cytokinetics, Inc. | Characterizing biological stimuli by response curves |
| US6562625B2 (en) | 2001-02-28 | 2003-05-13 | Home Diagnostics, Inc. | Distinguishing test types through spectral analysis |
| US6541266B2 (en) | 2001-02-28 | 2003-04-01 | Home Diagnostics, Inc. | Method for determining concentration of an analyte in a test strip |
| US6525330B2 (en) | 2001-02-28 | 2003-02-25 | Home Diagnostics, Inc. | Method of strip insertion detection |
| US20040071328A1 (en) * | 2001-09-07 | 2004-04-15 | Vaisberg Eugeni A. | Classifying cells based on information contained in cell images |
| US7187444B2 (en) * | 2001-11-12 | 2007-03-06 | Fuji Photo Film Co., Ltd. | Measuring method and apparatus using attenuation in total internal reflection |
| US7102752B2 (en) * | 2001-12-11 | 2006-09-05 | Kimberly-Clark Worldwide, Inc. | Systems to view and analyze the results from diffraction-based diagnostics |
| US7098041B2 (en) | 2001-12-11 | 2006-08-29 | Kimberly-Clark Worldwide, Inc. | Methods to view and analyze the results from diffraction-based diagnostics |
| US7189361B2 (en) * | 2001-12-19 | 2007-03-13 | 3M Innovative Properties Company | Analytical device with lightguide Illumination of capillary and microgrooves arrays |
| US7214530B2 (en) | 2002-05-03 | 2007-05-08 | Kimberly-Clark Worldwide, Inc. | Biomolecule diagnostic devices and method for producing biomolecule diagnostic devices |
| US7223368B2 (en) * | 2002-05-03 | 2007-05-29 | Kimberly-Clark Worldwide, Inc. | Diffraction-based diagnostic devices |
| US7485453B2 (en) | 2002-05-03 | 2009-02-03 | Kimberly-Clark Worldwide, Inc. | Diffraction-based diagnostic devices |
| US7223534B2 (en) * | 2002-05-03 | 2007-05-29 | Kimberly-Clark Worldwide, Inc. | Diffraction-based diagnostic devices |
| US7771922B2 (en) * | 2002-05-03 | 2010-08-10 | Kimberly-Clark Worldwide, Inc. | Biomolecule diagnostic device |
| US7118855B2 (en) | 2002-05-03 | 2006-10-10 | Kimberly-Clark Worldwide, Inc. | Diffraction-based diagnostic devices |
| US7091049B2 (en) * | 2002-06-26 | 2006-08-15 | Kimberly-Clark Worldwide, Inc. | Enhanced diffraction-based biosensor devices |
| US7285424B2 (en) | 2002-08-27 | 2007-10-23 | Kimberly-Clark Worldwide, Inc. | Membrane-based assay devices |
| US7927822B2 (en) * | 2002-09-09 | 2011-04-19 | Sru Biosystems, Inc. | Methods for screening cells and antibodies |
| US7429492B2 (en) * | 2002-09-09 | 2008-09-30 | Sru Biosystems, Inc. | Multiwell plates with integrated biosensors and membranes |
| US7169550B2 (en) | 2002-09-26 | 2007-01-30 | Kimberly-Clark Worldwide, Inc. | Diffraction-based diagnostic devices |
| ATE491149T1 (en) * | 2002-10-07 | 2010-12-15 | Secr Defence | WAVEGUIDE STRUCTURE |
| AU2002952602A0 (en) * | 2002-11-12 | 2002-11-28 | Varian Australia Pty Ltd | Flow through cell for optical spectroscopy |
| US6954560B2 (en) * | 2002-12-30 | 2005-10-11 | Advanced Technology Materials, Inc. | Attenuated total reflection spectroscopic analysis of organic additives in metal plating solutions |
| US20050014217A1 (en) * | 2003-07-18 | 2005-01-20 | Cytokinetics, Inc. | Predicting hepatotoxicity using cell based assays |
| US7235353B2 (en) * | 2003-07-18 | 2007-06-26 | Cytokinetics, Inc. | Predicting hepatotoxicity using cell based assays |
| WO2005010677A2 (en) * | 2003-07-18 | 2005-02-03 | Cytokinetics, Inc. | Characterizing biological stimuli by response curves |
| US8298780B2 (en) * | 2003-09-22 | 2012-10-30 | X-Body, Inc. | Methods of detection of changes in cells |
| US20050214803A1 (en) * | 2003-11-06 | 2005-09-29 | Sru Biosystems, Llc | High-density amine-functionalized surface |
| US20050112703A1 (en) | 2003-11-21 | 2005-05-26 | Kimberly-Clark Worldwide, Inc. | Membrane-based lateral flow assay devices that utilize phosphorescent detection |
| US20050141843A1 (en) * | 2003-12-31 | 2005-06-30 | Invitrogen Corporation | Waveguide comprising scattered light detectable particles |
| US20050273271A1 (en) * | 2004-04-05 | 2005-12-08 | Aibing Rao | Method of characterizing cell shape |
| US7796266B2 (en) * | 2004-04-30 | 2010-09-14 | Kimberly-Clark Worldwide, Inc. | Optical detection system using electromagnetic radiation to detect presence or quantity of analyte |
| US7815854B2 (en) * | 2004-04-30 | 2010-10-19 | Kimberly-Clark Worldwide, Inc. | Electroluminescent illumination source for optical detection systems |
| US20060019265A1 (en) * | 2004-04-30 | 2006-01-26 | Kimberly-Clark Worldwide, Inc. | Transmission-based luminescent detection systems |
| US20050244953A1 (en) * | 2004-04-30 | 2005-11-03 | Kimberly-Clark Worldwide, Inc. | Techniques for controlling the optical properties of assay devices |
| US20070031818A1 (en) * | 2004-07-15 | 2007-02-08 | Cytokinetics, Inc., A Delaware Corporation | Assay for distinguishing live and dead cells |
| US7323318B2 (en) * | 2004-07-15 | 2008-01-29 | Cytokinetics, Inc. | Assay for distinguishing live and dead cells |
| US7619008B2 (en) * | 2004-11-12 | 2009-11-17 | Kimberly-Clark Worldwide, Inc. | Xylitol for treatment of vaginal infections |
| US20060217446A1 (en) * | 2005-03-28 | 2006-09-28 | Kimberly-Clark Worldwide, Inc. | Method for preventing and/or treating trichomonas vaginitis |
| US20060106117A1 (en) * | 2004-11-12 | 2006-05-18 | Kimberly-Clark Worldwide, Inc. | Compound and method for prevention and/or treatment of vaginal infections |
| US20070121113A1 (en) * | 2004-12-22 | 2007-05-31 | Cohen David S | Transmission-based optical detection systems |
| JP4214124B2 (en) * | 2005-03-14 | 2009-01-28 | 株式会社バイオエコーネット | Ear thermometer |
| US20060217443A1 (en) * | 2005-03-28 | 2006-09-28 | Kimberly-Clark Worldwide, Inc. | Method for preventing and/or treating vaginal and vulval infections |
| US20060223765A1 (en) * | 2005-03-30 | 2006-10-05 | Kimberly-Clark Worldwide, Inc. | Method for inhibiting and/or treating vaginal infection |
| US7786176B2 (en) | 2005-07-29 | 2010-08-31 | Kimberly-Clark Worldwide, Inc. | Vaginal treatment composition containing xylitol |
| US7248361B2 (en) * | 2005-12-22 | 2007-07-24 | Palo Alto Research Center Incorporated | Fluorescence reader based on anti-resonant waveguide excitation |
| US20070197888A1 (en) * | 2006-02-21 | 2007-08-23 | Physical Logic Ag | Blood Oxygenation Sensor |
| US7519407B2 (en) * | 2006-02-21 | 2009-04-14 | Physical Logic Ag | Optical sensing catheter system |
| CN101646943A (en) * | 2006-10-31 | 2010-02-10 | Sru生物系统公司 | Method for blocking non-specific protein binding on a functionalized surface |
| EP2153203A4 (en) * | 2007-04-19 | 2010-04-21 | Sru Biosystems Inc | Method for employing a biosensor to detect small molecules that bind directly to immobilized targets |
| JP2008268064A (en) * | 2007-04-23 | 2008-11-06 | Fuji Electric Systems Co Ltd | Multicomponent responsive laser type gas analyzer |
| AU2008274978A1 (en) * | 2007-07-11 | 2009-01-15 | Sru Biosystems, Inc. | Methods of identifying modulators of ion channels |
| US9134307B2 (en) * | 2007-07-11 | 2015-09-15 | X-Body, Inc. | Method for determining ion channel modulating properties of a test reagent |
| DE102007033124B4 (en) | 2007-07-16 | 2012-12-06 | Fraunhofer-Gesellschaft zur Förderung der angewandten Forschung e.V. | Device for the optical detection of substances in a liquid or gaseous medium |
| US7982878B1 (en) * | 2007-10-03 | 2011-07-19 | Nomadics, Inc. | Optical emission collection and detection device and method |
| US20090116021A1 (en) * | 2007-10-05 | 2009-05-07 | Jeffry Mark Bulson | Method and apparatus for determining composition and concentration of contaminants on a film encapsulated in a plasma display panel |
| US8257936B2 (en) * | 2008-04-09 | 2012-09-04 | X-Body Inc. | High resolution label free analysis of cellular properties |
| EP2108938A1 (en) * | 2008-04-09 | 2009-10-14 | Koninklijke Philips Electronics N.V. | A carrier for optical detection in small sample volumes |
| US20100015721A1 (en) * | 2008-06-04 | 2010-01-21 | Sru Biosystems, Inc. | Detection of Promiscuous Small Submicrometer Aggregates |
| US9182406B2 (en) * | 2008-08-04 | 2015-11-10 | Biodesy, Inc. | Nonlinear optical detection of molecules comprising an unnatural amino acid possessing a hyperpolarizability |
| US20100273185A1 (en) * | 2009-04-27 | 2010-10-28 | Sru Biosystems, Inc. | Detection of Biased Agonist Activation |
| WO2010132890A1 (en) * | 2009-05-15 | 2010-11-18 | Sru Biosystems, Inc | Detection of changes in cell populations and mixed cell populations |
| DE102009025073A1 (en) * | 2009-06-16 | 2010-12-30 | Fraunhofer-Gesellschaft zur Förderung der angewandten Forschung e.V. | Optical sensor has channel with opposite side panels which are connected by base, where optical fiber is formed along opposite side panels and along base, so that field generates light in channel by passing to optical fiber |
| EP2325624A1 (en) * | 2009-11-18 | 2011-05-25 | F. Hoffmann-La Roche AG | Method and device for inspecting a bodily fluid |
| EP3943920B1 (en) | 2010-02-19 | 2024-04-03 | Pacific Biosciences Of California, Inc. | Integrated analytical system and method for fluorescence measurement |
| EP2553151A4 (en) * | 2010-03-26 | 2013-07-31 | X Body Inc | Use of induced pluripotent cells and other cells for screening compound libraries |
| WO2012129347A1 (en) | 2011-03-21 | 2012-09-27 | Biodesy, Llc | Classification of kinase inhibitors using nonlinear optical techniques |
| JP5901012B2 (en) * | 2012-02-13 | 2016-04-06 | 国立大学法人 東京医科歯科大学 | Blood information measuring method and apparatus |
| US10101273B2 (en) | 2012-02-17 | 2018-10-16 | Flir Detection, Inc. | Optical emission collection and detection device and method |
| US9645085B2 (en) | 2012-02-17 | 2017-05-09 | Flir Detection, Inc. | Optical emission collection and detection device and method |
| US20130330711A1 (en) * | 2012-06-06 | 2013-12-12 | National Taiwan University | Sensor for detection of a target of interest |
| FR2998677B1 (en) * | 2012-11-27 | 2016-01-29 | Commissariat Energie Atomique | NANO-CHANNEL OPTICAL WAVEGUIDE AND OPTOFLUIDIC SENSOR USING SUCH AN OPTICAL WAVEGUIDE |
| JP2015025820A (en) * | 2014-11-04 | 2015-02-05 | 株式会社東芝 | Optical waveguide type measurement system and measurement method for glycosylated hemoglobin |
| EP3237906B8 (en) | 2014-12-23 | 2020-10-28 | Bluelight Therapeutics, Inc. | Attachment of proteins to interfaces for use in nonlinear optical detection |
| DE102015007029A1 (en) * | 2015-06-02 | 2016-12-08 | Fachhochschule Lübeck | Fluid sampling device and its manufacture, fluid analysis device and optical measurement method |
| WO2017200907A1 (en) * | 2016-05-20 | 2017-11-23 | Instrumentation Laboratory Company | Evanescent hemolysis detection |
| US10345239B1 (en) * | 2016-09-08 | 2019-07-09 | Verily Life Sciences Llc | Thin stackup for diffuse fluorescence system |
| US10948652B2 (en) * | 2017-11-03 | 2021-03-16 | Pacific Biosciences Of California, Inc. | Systems, devices, and methods for improved optical waveguide transmission and alignment |
| DE102018202591A1 (en) * | 2018-02-21 | 2019-08-22 | Robert Bosch Gmbh | Optical system and method of making an optical system |
| DE102019201440A1 (en) * | 2019-02-05 | 2020-08-06 | Implen GmbH | Device for light spectroscopic analysis |
Family Cites Families (12)
| Publication number | Priority date | Publication date | Assignee | Title |
|---|---|---|---|---|
| US3939350A (en) * | 1974-04-29 | 1976-02-17 | Board Of Trustees Of The Leland Stanford Junior University | Fluorescent immunoassay employing total reflection for activation |
| DE2606991A1 (en) * | 1976-02-20 | 1977-08-25 | Nils Dr Med Kaiser | DEVICE FOR DETERMINING THE CONTENT OF METABOLIC PRODUCTS IN THE BLOOD |
| DE2720370A1 (en) * | 1977-05-06 | 1978-11-16 | Max Planck Gesellschaft | OPTODE WITH AUXILIARY INDICATOR |
| US4451434A (en) * | 1978-03-27 | 1984-05-29 | Hiram Hart | Transparent optical container for non-destructive biological fluid assay |
| US4399099A (en) * | 1979-09-20 | 1983-08-16 | Buckles Richard G | Optical fiber apparatus for quantitative analysis |
| AU557816B2 (en) * | 1981-09-18 | 1987-01-08 | Prutec Ltd. | Method for the determination of species in solution with an optical wave-guide |
| US4582809A (en) * | 1982-06-14 | 1986-04-15 | Myron J. Block | Apparatus including optical fiber for fluorescence immunoassay |
| US4447546A (en) * | 1982-08-23 | 1984-05-08 | Myron J. Block | Fluorescent immunoassay employing optical fiber in capillary tube |
| US4584277A (en) * | 1983-04-05 | 1986-04-22 | Syntex (U.S.A.) Inc. | Fluorescent multiparameter particle analysis |
| US4558014A (en) * | 1983-06-13 | 1985-12-10 | Myron J. Block | Assay apparatus and methods |
| US4671938A (en) * | 1985-09-09 | 1987-06-09 | Ciba-Corning Diagnostics, Corp. | Immunoassay apparatus |
| US4654532A (en) * | 1985-09-09 | 1987-03-31 | Ord, Inc. | Apparatus for improving the numerical aperture at the input of a fiber optics device |
-
1984
- 1984-12-10 EP EP84810600A patent/EP0184600B1/en not_active Expired - Lifetime
- 1984-12-10 DE DE8484810600T patent/DE3481644D1/en not_active Expired - Lifetime
-
1985
- 1985-12-06 US US06/805,903 patent/US4818710A/en not_active Expired - Lifetime
- 1985-12-06 AU AU50867/85A patent/AU582604B2/en not_active Expired
- 1985-12-09 CA CA000497202A patent/CA1272617A/en not_active Expired
- 1985-12-10 JP JP60276144A patent/JP2603611B2/en not_active Expired - Lifetime
Cited By (2)
| Publication number | Priority date | Publication date | Assignee | Title |
|---|---|---|---|---|
| US7138268B2 (en) | 1995-03-28 | 2006-11-21 | Agilent Technologies, Inc. | Dry biochemical assay plate and method for making the same |
| DE102021133357A1 (en) | 2021-12-15 | 2023-06-15 | Endress+Hauser Conducta Gmbh+Co. Kg | Sensor element, sensor system and method for manufacturing the sensor element |
Also Published As
| Publication number | Publication date |
|---|---|
| AU5086785A (en) | 1986-06-19 |
| JPS61191965A (en) | 1986-08-26 |
| CA1272617A (en) | 1990-08-14 |
| AU582604B2 (en) | 1989-04-06 |
| EP0184600A1 (en) | 1986-06-18 |
| JP2603611B2 (en) | 1997-04-23 |
| US4818710A (en) | 1989-04-04 |
| DE3481644D1 (en) | 1990-04-19 |
Similar Documents
| Publication | Publication Date | Title |
|---|---|---|
| EP0184600B1 (en) | Method for optically ascertaining parameters of species in a liquid analyte | |
| US4775637A (en) | An immunoassay apparatus having at least two waveguides and method for its use | |
| US5340715A (en) | Multiple surface evanescent wave sensor with a reference | |
| EP0075353B1 (en) | Method and apparatus for the determination of species in solution with an optical wave-guide | |
| Sutherland et al. | Optical detection of antibody-antigen reactions at a glass-liquid interface. | |
| US4880752A (en) | Dielectric waveguide sensors and their use in immunoassays | |
| US4368047A (en) | Process for conducting fluorescence immunoassays without added labels and employing attenuated internal reflection | |
| USRE33064E (en) | Method for the determination of species in solution with an optical wave-guide | |
| US5830766A (en) | Enhanced signal-to-noise ratio and sensitivity optical immunoassay | |
| JP2969177B2 (en) | Analysis method | |
| EP0282505A1 (en) | Method and apparatus for determining the level of an analyte in a sample of whole blood | |
| EP0185126B1 (en) | Optical test probe and apparatus for optically determining species in solution | |
| JP2007501403A (en) | Optical fiber array biochip based on spectral change rule of white light reflection interference | |
| EP0202269B1 (en) | Analytical apparatus for optically determining species in solution | |
| EP0175585B1 (en) | Dielectric waveguide sensors and their use in immunoassays | |
| JPS62123358A (en) | Optical fiber type immune sensor | |
| Bluestein et al. | Rapid response fiber optic evanescent wave immunosensors | |
| Yoshida et al. | Development of fiber optic fluoroimmunoassay: proximal vs. distal end collection geometries of a fiber sensor | |
| Harmer | Guided-wave chemical sensors | |
| Walczak et al. | Sensitive fiber-optic immunoassay | |
| Smith | Invited Paper Optical Waveguide Immuno-Sensors | |
| NO161945B (en) | PROCEDURE AND APPARATUS FOR DETERMINATION OF SUBSTANCES IN SOLUTION WITH AN OPTICAL CHAIRMAN. |
Legal Events
| Date | Code | Title | Description |
|---|---|---|---|
| PUAI | Public reference made under article 153(3) epc to a published international application that has entered the european phase |
Free format text: ORIGINAL CODE: 0009012 |
|
| AK | Designated contracting states |
Kind code of ref document: A1 Designated state(s): AT BE CH DE FR GB IT LI LU NL SE |
|
| RBV | Designated contracting states (corrected) |
Designated state(s): BE CH DE FR GB IT LI NL |
|
| 17P | Request for examination filed |
Effective date: 19861120 |
|
| 17Q | First examination report despatched |
Effective date: 19880718 |
|
| RAP1 | Party data changed (applicant data changed or rights of an application transferred) |
Owner name: PRUTEC LIMITED |
|
| GRAA | (expected) grant |
Free format text: ORIGINAL CODE: 0009210 |
|
| AK | Designated contracting states |
Kind code of ref document: B1 Designated state(s): BE CH DE FR GB IT LI NL |
|
| REF | Corresponds to: |
Ref document number: 3481644 Country of ref document: DE Date of ref document: 19900419 |
|
| ET | Fr: translation filed | ||
| ITF | It: translation for a ep patent filed |
Owner name: MODIANO & ASSOCIATI S.R.L. |
|
| ITTA | It: last paid annual fee | ||
| PLBE | No opposition filed within time limit |
Free format text: ORIGINAL CODE: 0009261 |
|
| STAA | Information on the status of an ep patent application or granted ep patent |
Free format text: STATUS: NO OPPOSITION FILED WITHIN TIME LIMIT |
|
| 26N | No opposition filed | ||
| REG | Reference to a national code |
Ref country code: GB Ref legal event code: IF02 |
|
| PGFP | Annual fee paid to national office [announced via postgrant information from national office to epo] |
Ref country code: NL Payment date: 20031126 Year of fee payment: 20 |
|
| PGFP | Annual fee paid to national office [announced via postgrant information from national office to epo] |
Ref country code: GB Payment date: 20031127 Year of fee payment: 20 |
|
| PGFP | Annual fee paid to national office [announced via postgrant information from national office to epo] |
Ref country code: BE Payment date: 20031128 Year of fee payment: 20 |
|
| PGFP | Annual fee paid to national office [announced via postgrant information from national office to epo] |
Ref country code: DE Payment date: 20031210 Year of fee payment: 20 |
|
| PGFP | Annual fee paid to national office [announced via postgrant information from national office to epo] |
Ref country code: FR Payment date: 20031229 Year of fee payment: 20 |
|
| PGFP | Annual fee paid to national office [announced via postgrant information from national office to epo] |
Ref country code: CH Payment date: 20031230 Year of fee payment: 20 |
|
| PG25 | Lapsed in a contracting state [announced via postgrant information from national office to epo] |
Ref country code: LI Free format text: LAPSE BECAUSE OF EXPIRATION OF PROTECTION Effective date: 20041209 Ref country code: CH Free format text: LAPSE BECAUSE OF EXPIRATION OF PROTECTION Effective date: 20041209 Ref country code: GB Free format text: LAPSE BECAUSE OF EXPIRATION OF PROTECTION Effective date: 20041209 |
|
| PG25 | Lapsed in a contracting state [announced via postgrant information from national office to epo] |
Ref country code: NL Free format text: LAPSE BECAUSE OF EXPIRATION OF PROTECTION Effective date: 20041210 |
|
| REG | Reference to a national code |
Ref country code: GB Ref legal event code: PE20 |
|
| BE20 | Be: patent expired |
Owner name: *PRUTEC LTD Effective date: 20041210 |
|
| REG | Reference to a national code |
Ref country code: CH Ref legal event code: PL |
|
| NLV7 | Nl: ceased due to reaching the maximum lifetime of a patent |
Effective date: 20041210 |